
ABSTRACT
Background
Wearable sensors enable continuous vital sign monitoring, although information about their performance on nursing wards is scarce. Vital signs measured by telemonitoring and nurse measurements on a surgical ward were compared to assess validity and reliability.
Methods
In a prospective observational study, surgical patients wore a wearable sensor (Everion, Biovotion AG, Zürich, Switzerland) that continuously measured heart rate (HR), respiratory rate (RR), oxygen saturation (SpO2), and temperature during their admittance on the ward. Validity was evaluated using repeated-measures correlation and reliability using Bland-Altman plots, mean difference, and 95% limits of agreement (LoA).
Results
Validity analyses of 19 patients (median age, 68; interquartile range, 62.5–72.5 years) showed a moderate relationship between telemonitoring and nurse measurements for HR (r = 0.53; 95% confidence interval, 0.44–0.61) and a poor relationship for RR, SpO2, and temperature. Reliability analyses showed that Everion measured HR close to nurse measurements (mean difference, 1 bpm; LoA, −16.7 to 18.7 bpm). Everion overestimated RR at higher values, whereas SpO2 and temperature were underestimated.
Conclusions
A moderate relationship was determined between Everion and nurse measurements at a surgical ward in this study. Validity and reliability of telemonitoring should also be assessed with gold standard devices in future clinical trials.
1. Introduction
Sudden deterioration of patients on a surgical ward is a major challenge in hospital care [Citation1]. Deterioration of patients leads to more unplanned intensive care unit (ICU) admissions, avoidable cardiopulmonary arrest, extended hospital stay, increased costs, and adverse effects on quality of life [Citation2]. Vital signs of patients have been found to deviate hours before such adverse events occur [Citation3,Citation4]. However, the calculation of (modified) early-warning scores (MEWS) before deterioration of surgical patients is often not complete [Citation1,Citation5]. There are several possible reasons for this. First, this might be due to the increased complexity of patients admitted to hospitals during the past few years, resulting in a higher demand for care. Second, nurses cannot continuously monitor the patient’s condition at the bedside due to time restraints and high workload. Third, MEWS is intermittently monitored at the surgical ward, which might lead to delayed detection of deterioration [Citation6,Citation7].
Continuous monitoring of vital signs is associated with lower rates of cardiac or respiratory arrest, fewer ICU transfers and shorter average hospital length of stay (LOS) [Citation8–11]. However, implementation of currently available systems on general wards presents challenges. For example, monitoring systems, such as those used in the ICU, often limit patient mobility [Citation12]. Therefore, continuous telemonitoring using wearable sensors to monitor a patient’s vital signs seems a favorable solution [Citation13].
Although several wearable sensors are available for continuous telemonitoring of vital signs, insight into the comparison with current clinical practice of validity and reliability is still in its infancy [Citation14,Citation15]. Heart rate (HR) is most commonly monitored with use of wearable sensors and is often measured accurately [Citation6,Citation15], whereas blood oxygen saturation (SpO2) is not a common application [Citation16]. Studies investigating the performance of wearable sensors for vital sign monitoring in a clinical environment are scarce, while this information is essential for any potential wearable sensor before its use in clinical decision making, because it affects interpretation of vital sign data and quality of alarms.
Therefore, in this study, continuous telemonitoring of HR, respiratory rate (RR), SpO2, and temperature using the Everion biosensor (Biovotion AG, Zürich, Switzerland) was compared with routine nurse measurements on a surgical ward for validity and reliability.
2. Methods
2.1. Design
This prospective, observational study is an integral part of a single-center observational pilot study to investigate the feasibility, validity, and quality of the data collected by continuous telemonitoring on the surgical wards of the University Medical Center Groningen (UMCG) (PROMISE study, research register number #201900432). The protocol was approved by the UMCG Ethical Committee and was performed according to the Declaration of Helsinki. The study was conducted from January 2020 to January 2021.
2.2. Participants
Patients aged 18 years or older and scheduled for elective open abdominal surgery were asked to participate at the outpatient clinic. Exclusion criteria were being mentally incapable of participation or unable to wear the Everion sensor.
2.3. Data collection
The Everion is a Conformité Européene class IIa-certified reusable wearable sensor worn at the upper arm. It measures vital signs with a storage frequency of 1 Hz, including HR, RR and SpO2 based on photoplethysmography (PPG) and temperature using a negative temperature coefficient thermistor [Citation17]. Data were transmitted via Bluetooth to the HealthyChronos application (Hobbit Imaging Solutions, Alphen aan de Rijn, the Netherlands) on a bedside tablet. Vital signs measured by Everion were obtained from the database after study completion. Nurse measurements were extracted from the electronic medical record.
2.4. Protocol
Patients who gave informed consent wore the Everion sensor during their stay on the surgical ward. The sensor was worn on the upper arm approximately from 8 am until 10 pm and was charged during the night. Patients, nurses, and researchers were blinded for the sensor measurements, and care was provided as usual. Nurses were instructed to correctly enter their measurement time in the electronic medical record to enable the data pairing needed for assessing validity and reliability. According to the institutional protocol, nurses measured vital signs every 3 hours during the first 24 hours after surgery and subsequently once during an 8-hour nurse shift. Vital signs were collected at the bedside, with the patients sitting or supine. Nurses manually measured HR and SpO2 using the Vital Signs Monitors 53NTO® (Welch Allyn, Amsterdam, the Netherlands). Respiration rate was measured by counting breaths for 15 seconds and multiplying the number by 4 to calculate RR per minute. A temporal scanner (Exergen Corporation, Watertown, MA, USA) was used to monitor temperature.
2.5. Data preprocessing
Everion measurements were preprocessed before data analyses to remove artifacts in the three following preprocessing steps that we developed for this purpose. First, values were excluded if they were outside the technical ranges as defined by Biovotion: 30 to 240 beats/min (bpm) for HR, 6 to 30 breaths/min for RR, 65% to 100% for SpO2, and 28°C to 43°C for temperature. Instances in which temperature was measured and HR was not, or if HR or RR were measured and temperature was not, were removed.
Second, a filter was applied on temperature data to remove the period of warming up of the sensor at the start of each measurement period. This start was defined as the first measurement of temperature after 5 minutes without data, while temperature was below its median value minus 3 times its median absolute deviation (MAD), a method for outlier detection [Citation18,Citation19], based on all temperature measurements per patient. Temperature data were removed during the first 60 minutes, which was the warming up period according to visual inspection of the data.
Third, if the end of each measurement period (e.g. 5 minutes before the data point previous to each start) showed a rapid decrease of temperature (0.5°C or more) and a HR above its median plus 3 times its MAD, all vital sign data were removed from the moment of decrease until the end of the measurement period. This indicates that the sensor was removed without immediate placement on the charger. An example of the preprocessing steps is shown as Supplementary material.
2.6. Statistical analyses
Per vital sign, Everion data were selected within the 5 minutes before each registered nurse measurement. When at least two Everion measurements were present, the median value was calculated and paired to the nurse measurements. To evaluate data variability during these 5 minutes of continuous data, the MAD was calculated as well. The median absolute percentage error (MAPE) was calculated per vital sign to evaluate the agreement of the wearable sensor compared with nurse measurements.
Repeated measures correlation coefficients (rmcorr package, R 4.4.1) were calculated per vital sign as a measure of validity [Citation20]. A correlation coefficient between telemonitoring and nurse measurements below 0.5 was considered as a weak, 0.5 to 0.7 as a moderate, and 0.7 to 1.0 as strong positive relationship [Citation21].
Reliability was evaluated using Bland-Altman plots, mean differences, and 95% limits of agreement (LoA) per vital sign measured by Everion compared with nurse measurements. Bland-Altman analyses were corrected for repeated measurements, where variance between measurement pairs is the sum of between and within subject variances [Citation22]. Data were processed and analyzed in MATLAB R2018a (MathWorks, Inc., Natick, MA, USA).
3. Results
A total of 23 patients planned for open abdominal surgery participated in the study. For four patients, vital sign data on the surgical ward was not available during the study period because the surgical procedure was canceled (n = 2), the patient withdrew consent before admittance to the hospital (n = 1), or the patient had a prolonged stay at the ICU (n = 1). Of the 19 included patients, surgery for one patient was canceled because of heart failure during induction anesthesia; therefore, only preoperative data was available. Patient characteristics are summarized in .
Table 1. Patient characteristics (n = 19)
3.1. Data availability
shows the flow diagram with the total number of available nurse measurements for all included patients (n = 19) on the surgical ward, the excluded measurements due to missing Everion data or data preprocessing process, and total number of included data pairs per vital sign.
Figure 1. Data flow diagram of available vital sign data for heart rate (HR), respiratory rate (RR), oxygen saturation (SpO2), and temperature (T) measured by nurses in the included patients (n = 19) during admission on the surgical ward. The excluded and included numbers of measurements (n) due to absence of Everion data before nurse measurement or the data preprocessing process are also expressed in percentages of the total number of available nurse measurements.
The median (interquartile range [IQR]) number of available nurse measurements per patient for HR were 29 (19–38.8); for RR, 27 (19–38.5); for SpO2, 30 (19.3–39.8); and for temperature, 29 (20–37). In comparison, the available Everion measurements in the median (IQR) 5 minutes before a nurse measurement for HR were 12 (11–18.5); for RR, 12 (10–17.8); for SpO2, 6 (3.5–8); and for temperature, 12 (11–16.5).
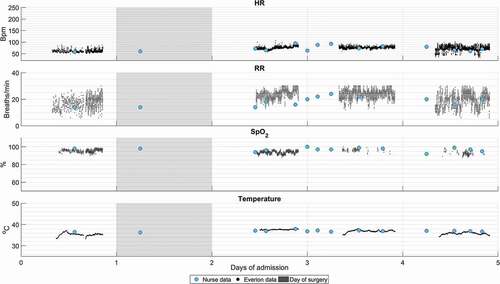
Nurses most often documented SpO2 measurements; however, this was the least frequently measured parameter of Everion before nurse measurements (only in 16.2%). In three patients, no SpO2 data by Everion were available before nurse measurements during the study period. shows an example of available nurse data and preprocessed Everion data for all vital signs during a patient’s stay at the surgical ward.
Figure 2. Example of available vital sign data of one patient during admission at the surgical ward measured by nurses (blue dots) and Everion (black dots). From top to bottom: heart rate (HR) in beats/min (bpm), respiratory rate (RR) in breaths/min, oxygen saturation (SpO2) in percentage (%), and temperature in degrees Celsius (°C).
3.2. Vital sign agreement
summarizes median values measured by nurses and Everion and the MAD and MAPE of Everion per vital sign. For HR, the median values measured by nurses and Everion are comparable (both 78 bpm). The MAD of Everion HR data indicates relatively low variability (median, 1.5 bpm) in the data set before a nurse measurement. The median MAPE for Everion HR measurements was 5.9% compared with nurse values.
Table 2. Median (IQR) of measured values by nurses and Everion, mean absolute deviation (MAD) of Everion measurements during five minutes prior to nurse registration, and median absolute percentage error (MAPE) of Everion compared to nurse measurements per vital sign: heart rate (HR) in beats/min (bpm), respiratory rate (RR) in breaths/min, oxygen saturation (SpO2) in percentage (%), and temperature in degrees Celsius (°C)
For RR, values measured by Everion were higher than those measured by nurses, respectively, median of 20 (IQR, 16–23) and 14 (IQR, 14–16) breaths/min. The small IQR of nurse measurements indicates a significant amount of 14 and 16 breaths/min reported by nurses, which is also indicated by the MAD of 1.0 (IQR, 1.0–2.0). The MAPE shows a mean deviation of 32.1% between the pairs.
The median SpO2 values measured by Everion are lower than those of nurse measurements. MAD of Everion data within the window of 5 minutes before nurse registration is 0.5% (IQR, 0.0%-1.0%) and the MAPE is 3% (IQR, 1.6%-4.5%) compared with nurse measurements.
Everion showed lower median temperature values compared with nurse measurements. Continuous temperature data of Everion are consistent with a MAD of 0.0 (IQR, 0.0–0.1). Median MAPE for temperature is 3.4% (IQR, 1.6–5.4%).
3.3. Validity
Repeated-measures correlation coefficients showed a moderate relationship between HR measured by Everion and nurses, with a correlation coefficient of rrm = 0.53 and a 95% confidence interval (CI) of 0.44 to 0.61. Measurements of Everion and nurses had a poor relationship for RR (rrm = 0.004; 95% CI, −0.12 to 0.13), SpO2 (rrm = 0.44; 95% CI, 0.23–0.60), and temperature (rrm = 0.18; 95% CI, 0.05–0.30).
3.4. Reliability
shows Bland-Altman plots of the paired Everion and nurse measurements for all vital signswith the mean difference and LoA. For HR, LoA ranged from −16.7 to 18.7 bpm, with a mean difference of 1 bpm.
Figure 3. Bland-Altman plots for all vital signs measured by Everion compared to nurse measurements: heart rate (HR) in beats/min (bpm), respiratory rate (RR) in breaths/min, oxygen saturation (SpO2) in percentage (%), and temperature in degrees Celsius (°C). The x-axis represents the mean of and the y-axis the difference (Δ) between both measurement pairs. The dotted lines represent the mean difference and 95% limits of agreement for repeated measurements.
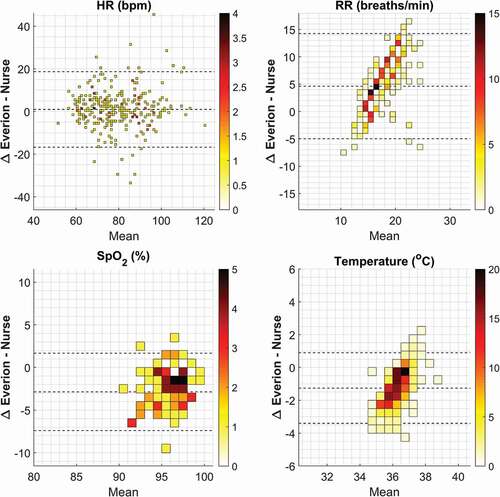
The mean difference for RR was 4.6 breaths/min and LoA of −5.0 to 14.3 breaths/min. The Bland-Altman plot for RR shows a specific pattern: at higher mean RR (>16 breaths/min), the mean difference is higher (more overestimation of Everion), whereas at a mean RR between 14 and 16 breaths/min, the mean difference between both measurements is close to zero.
In the 92 data pairs for SpO2, Everion underestimated SpO2 by 2.9% on average, with LoA of −7.4% to 1.7%.
Everion underestimated temperature by 1.3°C on average, with LoA of −3.4° to 0.9°C. There was less underestimation by Everion compared with nurse measurements at higher temperatures, as presented in .
4. Discussion
In this study, vital signs measured by telemonitoring using the Everion biosensor were compared with nurse measurements for validity and reliability. Results of this study showed that HR measured by Everion had a moderate relationship with current nurse measurements, whereas RR, SpO2, and temperature showed lower correlation coefficients. Reliability analyses showed that Everion measurements of HR were close to nurse measurements in mean difference. Everion overestimated RR at higher mean values >16 breaths/min, whereas SpO2 and temperature were underestimated compared with nurse measurements.
For HR, we reported comparable median values and relatively low variability in the data set before each nurse measurement. Even though Everion had a mean difference from only 1 bpm compared with nurse measurements, the large LoA, from −8.7 to 16.7 bpm are clinical relevant, because the MEWS may vary and result in different clinical decisions. Although the present results demonstrated HR is the parameter performing closest to nurse measurements in current clinical practice, studies using electrocardiogram-based wearable sensors found even smaller LoA compared with PPG-based sensors [Citation6]. A previous study evaluating the performance of Everion HR versus a medical-grade Holter monitor also found a smaller mean difference (−0.24 bpm) and LoA (−6.6 to 6.1 bpm) [Citation23]. However, that study was performed in different settings of activity, with healthy volunteers in a controlled environment.
For RR, the highest agreement between Everion and nurse measurements is between 14 and 16 breaths/min, which corresponds to a MEWS of 0 for RR. An overview of the raw data reveals frequent entries of 14 and 16 breaths/min in the nurse measurements. Either counting RR over a shorter time and multiplying it or estimating RR based on visual inspection of the chest related to the points of the MEWS could be an explanation for this. Similar results are found in studies comparing nurse measurements with electronic measurements [Citation24,Citation25]. In addition, inadequate measurement of RR due to the influence of motion artifacts experienced by wearable sensors may adversely affect the agreement.
Little is known about the accuracy of measuring SpO2 by wearable sensors. Everion is one of the few commercially available wearable sensors that measures this vital sign [Citation15]. Our results showed a mean underestimation for SpO2 measured by Everion of 2.9%, which is comparable to the results from a pilot study in which 88.4% of the cases had a difference of ≤2% between the wearable sensor and nurse measurements [Citation26]. However, this study reported many artifacts caused by, for example, connection failure or patient movement. Low availability of SpO2 data in our study might also be related to this, because Everion calculates an accuracy metric per vital sign that prevents data with an accuracy <50% from being stored. The placement site (upper arm) of the Everion may have played an important role as well, because this is a nontraditional and uncommon site to measure PPG signals [Citation27,Citation28].
A few wearable sensors have been developed with the ability to measure temperature. However, there is a gap of knowledge in the area of agreement in temperature measurements. Several reviews reported the availability of wearable sensors that monitor temperature [Citation15,Citation16,Citation29], and only one study investigated the validity of temperature measurements [Citation30]. The authors compared the SensiumVitals patch to nurse measurements and reported a mean difference of 0.82°C with LoA of −1.13°C to 2.78°C [Citation30]. The underestimation of temperature of 1.3°C that we found is small and could be explained by the differences in measurement technique. Nurses measured infrared temporal artery temperature (TAT), and Everion has a thermistor to measure temperature at the upper arm. Besides, whether the TAT is sufficient for body temperature monitoring in clinical practice is questionable [Citation31]. The possible relationship between environmental influences, such as the position of the arms above or under the blanket, and temperature measurement methods is unknown and needs to be further explored.
4.1. Strengths and limitations
A strength of this study is that nurses measured vital signs independently from telemonitoring. Everion data were not visible to participants or nurses, which reduced information bias. Commitment of nurses to measure vital signs and calculate the MEWS was prominent in this study. Because patients were asked to sit or lay down during nurse measurement, a median filter of 5 minutes was applied to the continuous data before each nurse measurement. Therefore, a representative period was used for data analysis.
This study has a few limitations. First, the small number of included patients and available SpO2 measurements may have led to increased variability in the analyses, and results cannot be extrapolated to larger groups of patients, nor clinical significance can be claimed. Evaluation of the performance of the Everion for detection of adverse events will be another important research subject, and also requires a large sample size with sufficient adverse events to demonstrate its eventual added value. Second, although nurses were asked to correctly enter their measurement time in the electronic medical record, it is possible that bias due to time synchronization occurred.
4.2. Implications
To properly continuously monitor patients on the general ward, clinical validation of wearable sensors is important. There are several implications for clinical practice and further research for telemonitoring on a general ward.
First, measurement technology of wearable sensors should be further improved. Algorithms should be able to limit data losses and artifacts due to patient movement. Moreover, measurement of RR is better when derived from an electrocardiogram instead of PPG [Citation32] and improves in proximity to the chest [Citation33,Citation34]. Currently, wearable sensors are mainly still in the phase of validation and feasibility [Citation14], which is important before they are used in clinical decision making. In addition to comparing wearable sensor measurements to those from clinical practice, validation studies in a controlled environment with gold standard reference devices should be performed to gain insight in wearable sensor performance under different levels of activity.
Second, vital signs measured by telemonitoring are of potentially high value for early detection of deterioration. With continuous measurement of vital signs it is preferable to set alarm criteria if nursing expertise at the patient’s bedside if required. While the MEWS is widely used for this purpose, not all parameters within the MEWS can be measured by a single wearable sensor. Nevertheless, a previous study with two wearable sensors resulted in early detection of a high MEWS during unobserved periods [Citation35]. Furthermore, the MEWS was developed as a generic tool for intermittent measurements. It may be beneficial to develop alarm criteria that focus on continuously measured parameters and consider person-specific trends. Besides, MEWS versus trend monitoring by means of wearable sensors is an issue for further research.
Third, the workload implications for nurses on the surgical ward should be investigated. Telemonitoring can only be successful if it does not add to nurses’ workloads and the required technical competencies are attained. As an example, although an advantage of Everion is measuring SpO2, the sensor must be recharged for at least 3 hours, resulting in unobserved periods [Citation17]. According to observations during this study, we suggest that the implementation of a new telemonitoring system on a general ward can only be successful if the role of nurses is investigated. The feasibility of telemonitoring with a wearable sensor on the surgical ward and acceptability of patients and nurses should also be assessed in future work toward actual use in clinical practice.
4.3. Conclusions
This prospective study found a moderate relationship between Everion measurements and nurse measurements on a surgical ward. However, the current study is limited to a small number of patients and the lack of validation with gold standard vital sign measurement. Comparing vital signs measured by telemonitoring and nurses provides valuable information for clinical application and should be analyzed before widespread clinical implementation of commercially available telemonitoring devices. Because nurse measurements are not considered as the gold standard, validity and reliability of telemonitoring should also be assessed with gold standard devices in future clinical trials.
Declaration of interest
The authors have no relevant affiliations or financial involvement with any organization or entity with a financial interest in or financial conflict with the subject matter or materials discussed in the manuscript. This includes employment, consultancies, honoraria, stock ownership or options, expert testimony, grants or patents received or pending, or royalties.
Reviewer disclosures
Peer reviewers on this manuscript have no relevant financial or other relationships to disclose.
Author contributions
M Haveman, R van Melzen, R Schuurmann, H Hermens, M Tabak and JP de Vries were involved in conception and design of this study, M Haveman and R van Melzen in data collection, and M Haveman, R van Melzen, M El Moumni, M Tabak and J de Vries in data analysis and interpretation. M Haveman and R van Melzen drafted the paper, and M Tabak and J de Vries critically revised the paper and approved the published version. All authors agree to be accountable for all aspects of the work.
Supplemental Material
Download TIFF Image (13.4 MB)Supplementary material
Supplemental data for this article can be accessed here.
Additional information
Funding
References
- Jonsson T, Jonsdottir H, Möller AD, et al. Nursing documentation prior to emergency admissions to the intensive care unit. Nurs Crit Care. 2011;16:164–169.
- Kause J, Smith G, Prytherch D, et al. A comparison of antecedents to cardiac arrests, deaths and emergency intensive care admissions in Australia and New Zealand, and the United Kingdom - The ACADEMIA study. Resuscitation. 2004;62:275–282.
- Fuhrmann L, Lippert A, Perner A, et al. Incidence, staff awareness and mortality of patients at risk on general wards. Resuscitation. 2008;77:325–330.
- Andersen LW, Kim WY, Chase M, et al. The prevalence and significance of abnormal vital signs prior to in-hospital cardiac arrest. Resuscitation. 2016;98:112–117.
- McGain F, Cretikos MA, Jones D, et al. Documentation of clinical review and vital signs after major surgery. Med J Aust. 2008;189:380–383.
- Breteler MJM, Huizinga E, Van Loon K, et al. Reliability of wireless monitoring using a wearable patch sensor in high-risk surgical patients at a step-down unit in the Netherlands: a clinical validation study. BMJ Open. 2018;8:1–9.
- Zimlichman E, Szyper-Kravitz M, Shinar Z, et al. Early recognition of acutely deteriorating patients in non-intensive care units: assessment of an innovative monitoring technology. J Hosp Med. 2012;7:628–633.
- Brown H, Terrence J, Vasquez P, et al. Continuous monitoring in an inpatient medical-surgical unit: a controlled clinical trial. Am J Med. [Internet]. 2014;127:226–232.
- Downey C, Randell R, Brown J, et al. Continuous versus intermittent vital signs monitoring using a wearable, wireless patch in patients admitted to surgical wards: pilot cluster randomized controlled trial. J Med Internet Res. 2018;20:1–10.
- Weller RS, Foard KL, Harwood TN. Evaluation of a wireless, portable, wearable multi-parameter vital signs monitor in hospitalized neurological and neurosurgical patients. J Clin Monit Comput. [Internet]. 2018;32:945–951.
- Sun L, Joshi M, Khan SN, et al. Clinical impact of multi-parameter continuous non-invasive monitoring in hospital wards: a systematic review and meta-analysis. J R Soc Med. 2020;113:217–224.
- Watkinson PJ, Barber VS, Price JD, et al. A randomised controlled trial of the effect of continuous electronic physiological monitoring on the adverse event rate in high risk medical and surgical patients. Anaesthesia. 2006;61(11):1031–1039.
- Kellett J, Sebat F. Make vital signs great again – a call for action. Eur J Intern Med [Internet]. 2017;45:13–19.
- Leenen JPL, Leerentveld C, van Dijk JD, et al. Current evidence for continuous vital signs monitoring by wearable wireless devices in hospitalized adults: systematic review. J Med Internet Res. 2020;22:6.
- Joshi M, Ashrafian H, Aufegger L, et al. Wearable sensors to improve detection of patient deterioration. Expert Rev Med Devices. [Internet]. 2019;16:145–154.
- Soon S, Svavarsdottir H, Downey C, et al. Wearable devices for remote vital signs monitoring in the outpatient setting: an overview of the field. BMJ Innov. 2020; 6: 55.
- Biovotion AG. Everion. 2018 p. 1–4.
- Leys C, Ley C, Klein O, et al. Detecting outliers: do not use standard deviation around the mean, use absolute deviation around the median. J Exp Soc Psychol. 2013;49:764–766.
- Dave D, Varma T. A review of various statistical methods for outlier detection. Int J Comput Sci Eng Technol. 2014;5:137–140.
- Sciences H, Bland JM, Altman DG. This is the twelfth in a series of occasional notes on medical statistics Department ofPublic statistics notes calculating correlation coefficients with repeated observations: part 1-correlation within subjects. British Medical Journal. 1995;310:1995.
- Schober P, Schwarte LA. Correlation coefficients: appropriate use and interpretation. Anesth Analg. 2018;126:1763–1768.
- Bland JM, Altman DG. Agreement between methods of measurement with multiple observations per individual. J Biopharm Stat. 2007;17:571–582.
- Barrios L, Oldrati P, Santini S, et al. Evaluating the accuracy of heart rate sensors based on photoplethysmography for in-the-wild analysis. ACM Int Conf Proc Ser 2019; 251–261.
- Kellett J, Li M, Rasool S, et al. Comparison of the heart and breathing rate of acutely ill medical patients recorded by nursing staff with those measured over 5 min by a piezoelectric belt and ECG monitor at the time of admission to hospital. Resuscitation. [Internet]. 2011;82:1381–1386.
- Granholm A, Pedersen NE, Lippert A, et al. Respiratory rates measured by a standardised clinical approach, ward staff, and a wireless device. Acta Anaesthesiol Scand. 2016;60:1444–1452.
- Weenk M, van Goor H, Frietman B, et al. Continuous monitoring of vital signs using wearable devices on the general ward: pilot study. JMIR mHealth uHealth. 2017;5:1–15.
- L’Her E, N’Guyen QT, Pateau V, et al. Photoplethysmographic determination of the respiratory rate in acutely ill patients: validation of a new algorithm and implementation into a biomedical device. Ann Intensive Care. Internet]. 2019;9. doi:https://doi.org/10.1186/s13613-019-0485-z
- Castaneda D, Esparza A, Ghamari M, et al., A review on wearable photoplethysmography sensors and their potential future applications in health care. 2018;Int J Biosens Bioelectron. 4:195–202.
- Leenen JPL, Dijkman EM, Van Dijk JD, et al. Feasibility of continuous monitoring of vital signs in surgical patients on a general ward: an observational cohort study. BMJ Open. 2021;11:2.
- Downey C, Ng S, Jayne D, et al. Reliability of a wearable wireless patch for continuous remote monitoring of vital signs in patients recovering from major surgery: a clinical validation study from the TRaCINg trial. BMJ Open. 2019;9:e031150.
- Cox EGM, Dieperink W, Wiersema R, et al. Temporal artery temperature measurements versus bladder temperature in critically ill patients, a prospective observational study. PLoS One. [Internet]. 2020;15:1–11.
- Charlton PH, Bonnici T, Tarassenko L, et al. An assessment of algorithms to estimate respiratory rate from the electrocardiogram and photoplethysmogram. Physiol Meas. 2016;37:610–626.
- Shelley KH, Jablonka DH, Awad AA, et al. What is the best site for measuring the effect of ventilation on the pulse oximeter waveform? Anesth Analg. 2006;103:372–377.
- Nilsson L, Goscinski T, Kalman S, et al. Combined photoplethysmographic monitoring of respiration rate and pulse: a comparison between different measurement sites in spontaneously breathing subjects. Acta Anaesthesiol Scand. 2007;070816180743003–???.
- Weenk M, Koeneman M, van de Belt TH, et al. Wireless and continuous monitoring of vital signs in patients at the general ward. Resuscitation. [Internet]. 2019;136:47–53.