
ABSTRACT
Introduction
The impact of robotic-assisted total knee arthroplasty (rTKA) vs. traditional, manual TKA (mTKA) on hospital costs is not well documented and is analyzed herein.
Research Design and Methods
Patients in the Premier billing Healthcare Database undergoing elective rTKA or mTKA (“index’) in the in- or outpatient setting for knee osteoarthritis between Oct 1st, 2015, to September 30th, 2021, were identified. Variables included patient demographics and comorbidities and hospital characteristics. Matched rTKA vs. mTKA cohorts were created using direct (on provider characteristics, age, gender, race and Elixhauser index) and propensity score matching (fixation type, comorbidities). Index and 90-day inflation-adjusted costs and healthcare utilization (HCU) were analyzed for both cohorts, using generalized linear models.
Results
16,714 rTKA patients were matched to 51,199 mTKA patients. Average 90-day hospital cost reached $17,932 and were equivalent for both cohorts (rTKA vs. mTKA: $132 (95% confidence interval; -$19 to $284). There was a 2.7% (95%CI: 2.2%-3.3%) increase in home or home health discharge, and a 0.4% (95%CI: 0%-0.8%) decrease in 90-day hospital knee related re-visit in the rTKA vs. mTKA group.
Conclusions
Cost-neutrality of rTKA vs. mTKA was observed, with a potential for lowered immediate post-operative HCU in the rTKA vs. mTKA cohorts.
1. Introduction
Total knee arthroplasty (TKA) is a generally successful and cost-effective procedure for the treatment of end-stage knee arthritis [Citation1–3]. Despite overall strong outcomes, 18% of devices may fail within 25 years of implantation; this number is significant considering the increasingly young population being treated with TKA [Citation4–6]. In addition, despite generally favorable post-operative satisfaction, for at least 80% patients, residual symptoms after TKA impact the quality of life of a large proportion of patients. As an example, 54% and 38% of patients who had TKA describe difficulty climbing stairs and getting in and out of cars, respectively [Citation7–9].
Robotic-assisted total knee arthroplasty (rTKA) has been developed to improve patient outcomes by increasing surgical precision and reducing surgical variability compared to traditional, manual TKA (mTKA). There are currently several robotic systems available, including ROBODOC® (Curexo Technology, Fremont, CA), Mako® (Stryker Corporation, Kalamazoo, MI), Navio™ (Smith & Nephew, Cordova, TN), OMNIbotics® (Corin Group, Raynham, MA), and Rosa® (Zimmer Biomet, Warsaw, IN). Current robotic systems require the creation of a three-dimensional plan derived from a process of mapping the anatomy of the joint surfaces, with or without a preoperative computed tomography (CT) scan. In image-guided systems, the surgeon uses this virtual model to plan optimal bone resection, implant positioning, bone coverage, and limb alignment based on the patient’s unique anatomy. An intraoperative robotic device helps to execute this preoperative plan [Citation10,Citation11]. In imageless systems, intraoperative registration of the anatomical surfaces and kinematics after arthrotomy is used to create a 3D virtual model, develop a surgical plan, and define boundaries beyond which the bone cutting tools should not remove surface tissue [Citation12].
Robotic TKA has been shown to deliver predictable and consistent component alignment and soft tissue balance [Citation12]. This increased accuracy in surgical methodology may result in further improved outcomes, especially range of motion and patient satisfaction [Citation13–16].
Most of the published medical literature evaluating rTKA suggests favorable clinical and radiographic outcomes versus mTKA [Citation17–27]. Early studies have suggested, however, that increased operating room time, technical complexity, and costs may be limitations to rTKA adoption [Citation28]. With limited data available on actual hospital costs, we designed our study to compare rTKA vs. mTKA in terms of operating room time, hospital length of stay (LOS), cost of the index hospitalization, and patient discharge status after TKA. Secondary objectives included all-cause and knee-related 90-day hospital-based healthcare resource utilization (HCU) and cost of hospitalizations (i.e. cost of index hospitalization + 90-day post-TKA hospital cost).
2. Methods
2.1. Data source
This retrospective, cross-sectional, real-world data study identified patients undergoing TKA in the Premier Healthcare Database between October 1st, 2015, and September 30th, 2021. The Premier, Inc. database contains complete standardized clinical coding, including diagnosis, procedure, and hospital-prescribed medications from more than 20% of all hospital admissions throughout the United States (>1041 hospitals and hospital systems). Premier collects data from participating hospitals in its health care alliance. Although the database excludes federally funded hospitals (e.g. Veterans Affairs), the hospitals included are nationally representative based on bed size, geographic region, location (urban/rural), and teaching hospital status. The database contains a date-stamped log of all billed items by the cost-accounting department (both fixed and variable) including devices, implants, medications; laboratory, diagnostic, and therapeutic services; and primary and secondary diagnoses for each patient’s hospitalization. Identifier-linked enrollment files provide demographic and payor information. Detailed service level information for each hospital day is recorded; this includes details on medication and devices received.
2.2. Patient population
All patients ≥18 years of age with a Current Procedural Terminology (CPT) code or International Classification of Diseases, Tenth Revision (ICD-10) code indicative of elective TKA were considered for inclusion in the study. The date of the TKA was defined as the ‘index date.’ Exclusion criteria included: 1) presence on admission of one of the following diagnoses: lower leg fracture, aseptic loosening, metastatic cancer (any) or deep infection/osteomyelitis; unicompartmental or computer-assisted TKA at index; bilateral, or TKA of the contralateral knee, from 0 to 90 days post-index. Data were analyzed for the duration of the patient’s index hospitalization and 90 days post-index.
2.3. Study measures
2.3.1. Baseline demographic and clinical characteristics
Patient demographic and clinical characteristics that were evaluated included age, gender, race, marital status, payer category (Medicare, Medicaid, or commercial health insurance), hospital admission type (inpatient or outpatient service), year of TKA surgery, and patient comorbidities. The baseline comorbidity index (i.e. comorbid conditions present prior to TKA) was assessed using the Elixhauser Comorbidity Score, an aggregate measure of comorbidity created by using 31 dimensions associated with chronic disease (e.g. heart disease, cancer) and overall health conditions. Prior research has shown that increasing Elixhauser Comorbidity Scores are associated with increased healthcare utilization and greater risk of mortality [Citation29,Citation30]. The Functional Comorbidity Index (FCI) was also evaluated. The FCI includes 18 medical conditions and the sum of the individual condition scores yields the FCI score (range from 0 to 18) [Citation31]. The FCI is particularly relevant for orthopedic care as it was developed as a measure of patient functioning capacity [Citation31,Citation32]. Additional comorbidities and health behaviors that were assessed included the presence of back or knee pain, arthritis, osteoporosis, and smoking status.
Provider variables included: 1) hospital size (defined by the number of beds); 2) teaching vs. community hospital; 3) urban vs. rural; 4) geographic location of the hospital, and 5) TKA volume. For this variable, the total count of TKA performed within each institution in the 12 months prior to a patient’s TKA was analyzed. This variable was important to evaluate whether the hospital was performing routine TKAs, or whether TKAs were rarely performed at that given site.
2.3.2. Outcomes
The procedure duration, LOS, costs for the index surgery, and hospital and discharge status were evaluated for each patient. Following discharge, occurrence and costs of all-cause and knee-related hospital visits (i.e. inpatient, or ER, or outpatient hospital visits), inpatient readmissions, and emergency room (ER) visits were analyzed for all patients. A total cost that included the index plus the 90-day post-index costs was estimated for all patients.
2.4. Statistical analyses
All study variables were analyzed descriptively. Counts and proportions (categorical variables) and means and standard deviations (continuous variables) were provided. Patients with rTKA and mTKA were matched 1:5 using a variable matching strategy. The variable matching allowed for fewer than five matches if the target number of matches was not found. This strategy has greater confounding control over the fixed-ratio matching [Citation33,Citation34]. Patients were matched directly on the following variables using exact matches: age categories, race, Elixhauser comorbidity score categories, year of surgery, hospital volume, hospital bed size, hospital teaching status, hospital urban or rural location, and geographic subdivision. These characteristics are important determinants of resource use [Citation35,Citation36]. Direct-match cohorts were further matched on propensity scores (PS) created using fixation type (cemented vs uncemented), patient demographics, health behaviors, and clinical characteristics. Greedy nearest neighbor matching technique with calipers of width equal to 0.2 of the pooled standard deviation of the logit of the PS was used. Standardized differences were evaluated to assess the balance between the groups. An absolute standardized difference <0.05 was used to indicate a negligible difference between rTKA and mTKA. HCU and costs over 90 days were compared using generalized linear models (GLM). LOS and duration of surgery were modeled using negative binomial distribution; discharge destination and health care utilization were modeled using a binomial distribution with a logit link; cost outcomes were modeled using a quasi (gamma) distribution with log link. To account for the clustering of subjects within matched sets, a robust variance estimator was used to compute 95% confidence intervals (CI). All costs were inflated to 2021 using Consumer Price Index.
2.4.1. Sensitivity analysis
Sensitivity analysis was carried out to obtain a stricter match between the rTKA and mTKA. In sensitivity analyses, all comorbidities that showed a greater than a 0.2%-point absolute difference between the matched rTKA and mTKA cohorts were identified. These comorbidities were included for direct-matching, in addition to previously mentioned variables that were matched directly. PS-matching was then carried out to match on the remaining variables.
3. Results
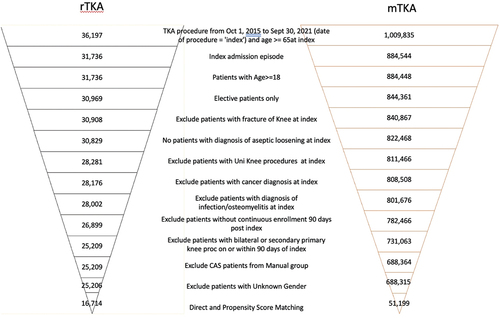
A total of 36,197 patients from the Premier Healthcare Database received rTKA and 1,009,835 patients received mTKA between 1 October 2015, to 30 September 2021. presents the attrition flow for rTKA and mTKA using the inclusion and exclusion criteria defined above. Before matching, 25,206 rTKA and 688,315 mTKA patients were identified. After DM-PSM, 16,714 patients with rTKA and 51,199 patients with mTKA were included in the analyses.
Figure 1. Attrition flow diagram of patients included in the analysis.
3.1. Patient baseline demographic and clinical characteristics
Baseline demographic and clinical characteristics for patients with rTKA and mTKA before and after matching are presented in . Before DM-PSM, a greater proportion of patients with rTKA were married, commercially insured, had their TKA procedure performed in 2019–2021 usually in inpatient setting, compared to mTKA.
Table 1. Baseline characteristics of patients undergoing rTKA and mTKA surgery before and after DM-PSM.
After DM-PSM, all standardized mean differences were lower than 0.05, suggesting appropriate matching based on all included variables. The mean age was ~67 years old, ~60% of the patients were ≥65 years old, ~60% of the patients were female, the majority of patients were White (~88%), ~65% of patients were married, and ~31% of patients were smokers. Most patients had Medicare (~57%) or private commercial health insurance (~35%) and were admitted as hospital inpatients (~87%) for their TKA. A greater proportion of TKAs was performed in 2019 (~29%) or 2020 (~23%) vs. prior years. Commonly observed comorbidities among patients included uncomplicated hypertension (~59%), obesity (~29%), hypothyroidism (~17%), chronic pulmonary disease (~15%), uncomplicated diabetes (~14%), and depression (~14%) (Supplementary Table 1).
3.2. Provider baseline characteristics
Baseline provider characteristics are presented in . Before DM-PSM, a greater proportion of hospitals performing rTKA vs. mTKA had a pre-index TKA volume of <274, a size ≥ 100 beds, were conducted in the New England or West South-Central geographic regions.
Table 2. Provider characteristics of patients undergoing rTKA and mTKA surgery before and after DM-PSM.
After DM-PSM, provider characteristics were similar for rTKA and mTKA and were as follows: most surgeries took place in an urban setting (~90%), ~44% were performed at teaching hospitals, ~ 26% in hospitals with 500 beds or more. Approximately 46% of all surgeries were conducted in the South census region and ~23% in the Northeast census region. The fixation method was also balanced with uncemented proportion of 12.1% for rTKA vs 11.8% for mTKA cohort (SMD = 0.008).
3.3. Resource use and costs
Hospital costs for the index- and post-index care were not different between patients treated with robotic vs. manual TKA (). Total costs over 90 days averaged approximately $17.9 K; excluding costs unrelated to knee care, costs averaged approximately 17.3 K. Compared to manual surgery, the duration of robotic surgery was longer by 11 minutes (95%CI: 9–13), resulting in increased operating room costs (an increase of $513 (95%CI: $466 to $559). However, LOS was shorter for patients with rTKA (0.2 days (0.17 to 0.22 days – 95%CI)) resulting in lower room and board costs for robotic vs. manual TKA (difference of $168 (95% CI: $129 to $206)).
Table 3. Healthcare resource utilization and costs for rTKA and mTKA from index surgery through 90 days post-index.
Differences in outcomes were identified by discharge disposition: a larger proportion of robotics patients were discharged to home (91.0% home discharge for rTKA, an increase of 2.8% (95%CI: 2.2% – 3.3%) from mTKA), and 2.8% fewer patients were discharged to skilled nursing homes. The 90-day post-index period showed consistently and fewer readmissions in terms of percentage of patients with revisits and the cost of revisits for patients treated with rTKA vs. mTKA. The percentage of patients requiring any inpatient readmission decreased by 0.4% (0.1–0.8%) in the rTKA vs. mTKA group, and specifically, knee-related readmissions decreased by 0.3% (0.1–0.5%). Emergency room visits also decreased significantly by 0.9% (0.5%-1.3%) in the rTKA vs. mTKA cohorts. The hospital inpatient costs for post-index care were, therefore, lower in the rTKA vs. mTKA group.
In sensitivity analyses, the rTKA and mTKA cohorts were directly matched on additional variables including congestive heart failure, peripheral vascular disorders, hypertension, uncomplicated diabetes, renal failure, fluid and electrolyte disorders, deficiency anemia, depression, arthritis, osteoporosis and marital status. After DM-PSM, 10,622 patients with rTKA and 31,327 patients with mTKA were included in the sensitivity analyses. The results in the sensitivity analyses were similar to the main analyses (). Patients with rTKA at index had significantly lower LOS, higher proportion discharged home and lower proportion discharged to a skilled nursing facility or other inpatient facility. Resource use and costs during the 90-day period after the TKA were lower for patients who received rTKA vs. patients who received mTKA. However, overall knee-related care cost was not statistically significantly different between rTKA and mTKA.
Table 4. Sensitivity analysis for healthcare resource utilization and costs for rTKA and mTKA from index surgery through 90 days post-index*.
4. Discussion
Our study evaluated the costs of rTKA vs. mTKA in a large database of > 1000 US hospitals, including more than 67,000 matched patients. Existing published retrospective database analyses evaluating rTKA and mTKA have used Medicare fee-for-service data, which limits the analysis to patients over the age of 65 who are publicly insured [Citation37,Citation38]. In contrast, our study is payer-agnostic, including all patients over the age of 18 and patients with both public insurance (Medicare ~57% and Medicaid ~3%) and private insurance (private commercial ~35%). Hospitals also bear the added costs of performing robotic TKA (vs manual). Findings from this study, therefore, constitute benchmarks for hospital-based resource use and costs associated with rTKA compared to mTKA from a nationally representative sample of patients across diverse hospitals in the United States.
In our matched analyses, the overall hospital costs of care from index to 90 days post-index were not different between rTKA vs. mTKA. Knee-related costs were higher for rTKA vs mTKA in our primary analysis, but not in our sensitivity analysis, where matching included a larger number of confounders. For all other outcomes, findings were consistent between our primary and sensitivity analysis. Length of stay was shorter, and more patients were discharged home following rTKA vs. mTKA. This finding suggests that rTKA patients had uncomplicated care and fast recovery. The duration of surgery, however, was 7.7% (11 minutes) longer with rTKA, which is aligned with the additional steps required for robotic use. From a financial standpoint, costs for room and board during the index hospitalization were lower with rTKA whereas operating room costs were higher with rTKA, vs. mTKA. These differences however balanced each other out.
Discharge disposition was also different between rTKA and mTKA: approximately 3% fewer patients were discharged to a skilled nursing facility (SNF), and about 5% more patients were discharged to home without home health in the rTKA vs. mTKA arm. These significant differences were not captured as cost savings in our analysis because our database only includes hospital costs, and costs of SNF/non-hospital admissions were not accessible for this research.
Over the 90 days post-index, rates of revisits and readmissions, both all-cause and knee-related, were also significantly lower for inpatient and ER setting in the rTKA vs. mTKA cohorts. These differences suggest potential early clinical advantages in patients treated with rTKA vs. mTKA. Interestingly, the overall costs were not different between rTKA and mTKA, possibly due to the fact that inpatient admissions were still relatively infrequent (4.0% or less), and small changes, once averaged across the entire population, did not reach significance.
The differences in post-operative healthcare revisits and readmissions may be explained by the following: Compared with manual surgery, rTKA provides improved precision of soft-tissue dissection and fewer soft-tissue releases, better visualization of the surgical field, and overall greater surgical accuracy [Citation10]. Other studies have also demonstrated that rTKA systems are associated with reduced postoperative pain and have improved functional outcomes compared to mTKA across the patient care pathway [Citation15,Citation16,Citation39–41]. These attributes may explain why, in our study, fewer patients return to the hospital for follow-up visits and readmissions. Other studies have shown that rTKA may lead to more reproducible bone preparation, component positioning, lower leg alignment, and soft tissue balancing [Citation26,Citation39–42]. These findings may contribute to less complicated recovery and increased gait quality, thus greater functional outcomes [Citation27,Citation38,Citation43]. Our findings suggest that, at cost neutrality between mTKA and rTKA, rTKA may result in reduced post-operative care requirements.
The observed variability in healthcare resource use and cost among patients receiving rTKA and mTKA suggests that there are still opportunities for improving care and reducing costs of patients who need TKA. Robotic solutions have become increasingly popular for TKA; however, some robotic systems are associated with limitations including the complexity of their use and training requirements [Citation41], additional operating room time [Citation41,Citation44], limitations of cut-block dependent or burr-based robotic systems [Citation45], large footprints which can be cumbersome in the operating room, need for additional personnel in the operating room, and additional processes required during set-up and during procedures such as CT upload, registration, and milling [Citation41]. The inefficiencies of some robotic systems may result in the full economic benefits of robotics not being fully realized.
This study represents the largest economic analysis of robotic versus manual TKA. The healthcare resource utilization and costs for rTKA and mTKA observed in this study are in alignment with previously published studies of smaller cohorts. A retrospective database evaluation by Cool et al. (2019) [Citation38] using Medicare data between 1 January 2016, and 31 March 2017, evaluated healthcare resource utilization and costs of rTKA (n = 519) vs. mTKA (n = 2,595) up to 90 days post-surgery. Study findings showed that rTKA was associated with lower 30-, 60-, and 90-day postoperative costs and health care utilization, including ER services, readmissions, and home health visits. The Cool et al. (2019) [Citation38] study results did find more pronounced differences for some resource use and cost study endpoints, which may be due to their focus on the payer vs. the hospital perspective.
Additional strengths of this study include the consideration of both all-cause and knee-related resource utilization and costs in rTKA and mTKA, Furthermore, the current study adjusted for an array of Elixhauser comorbidities and the Functional comorbidity index and was able to adjust for hierarchical confounding factors such as hospital volume, hospital bed size, hospital teaching status, hospital urban or rural location, and geographic subdivision. This study also carried out sensitivity analyses to confirm the results with stricter control of comorbidities to mitigate any residual confounding, demonstrating the robustness of the findings.
A limitation of the current study is that it only captures outcomes and resource utilization in the Premier Healthcare Database for the index hospitalization and for up to 90 days post-TKA. The resource use and costs beyond 90 days post-TKA were not evaluated, which could give important information for outcomes and resource utilization over a longer period of time. In addition, other important costs such as costs for SNF, home health, and other services (such as any preoperative imaging), were not available for analysis. Our study also reflects only robots that were used from 10/2015 to 09/2021 in the United States and may be specific to those technologies.
Another limitation of this study is that it uses billing data, which are not collected specifically for research purposes. Under-reported or missing diagnoses for variables such as smoking are based on patients’ choice not to seek care or access challenges. Billing data may also have clerical inaccuracies, recording bias secondary to financial incentives, and temporal changes in billing codes [Citation46,Citation47]. Costs from the Premier Healthcare Database do not include capital expenditure costs or operating expenses such as maintenance. However, robots are placed on varying contract terms, including no upfront fee for volume-based contracts. In this scenario, there would be no upfront cost to the hospital. The study also included both fixed and variable costs in cost calculation and amortization of capital expenditures would be part of variable costs thereby minimizing the impact of these limitations.
This study is also limited in that the findings from the Premier Healthcare Database may not be generalizable to all hospitalized patients with mTKA and rTKA, particularly those in other countries. Also, Patients treated in non-Premier Inc. hospitals for post-op care will be lost to follow-up in this study. The study has tried to capture as many patient, provider, surgeon and procedure characteristics as available; however, there might be other unmeasured variables (e.g. surgical technique, administrative policy, implants used) that may lead to residual confounding. The study has limitations associated with observational study design and as such the study showcases association in outcomes instead of causal relationship. Despite these limitations, this study provides an informative perspective of the hospital-based experience of care that patients had with rTKA and mTKA up to 90 days post-surgery.
5. Conclusions
These hospital data for more than 67,000 patients, under the limitation of the study (including unavailability of the purchase cost of robot), showed that rTKA was cost-neutral with mTKA over 90 days and may result in a greater discharge to home with fewer post-operative readmissions and revisits, compared to mTKA. These data demonstrate that the adoption of rTKA may benefit patients without adding costs to hospital systems. The economic benefit of rTKA will continue to increase with ongoing improvements in procedure efficiency and standardization.
Declaration of interest
LG, ASC, KM, AG, CEH and DH are employees of Johnson & Johnson (JnJ) and own stock in the company and participated in the design of the study and in the collection, analysis, and interpretation of the data and in the writing the manuscript. SK was a contractor with JnJ at the time of the study. The authors have no other relevant affiliations or financial involvement with any organization or entity with a financial interest in or financial conflict with the subject matter or materials discussed in the manuscript apart from those disclosed.
Reviewers Disclosure
Peer reviewers on this manuscript have no relevant financial relationships or otherwise to disclose.
IRB Approval
The use of Premier Healthcare Database was reviewed by the New England Institutional Review Board (IRB) and was determined to be exempt from broad IRB approval, as this research project did not involve human subject research and used data from an anonymous, de-identified, administrative claims database compliant with the Health Insurance Portability and Accountability Act of 1996.
Availability of Data and Materials
The data for these analyses were made available to the authors by third-party licenses from PREMIER (https://products.premierinc.com/applied-sciences/solutions/applied-research-and-analytics), a data provider in the US. Under the licensing agreement, the authors cannot provide raw data themselves. Other researchers could access the data by purchase through PREMIER, and the inclusion criteria specified in the Methods section would allow them to identify the same cohort of patients we used for these analyses.
Author’s Contributions
TBA, ASC, CEH, AG, KM, DPH and LG participated in the design of the study and in the collection, analysis, and interpretation of the data and in the writing the manuscript. KS, AG and CEH completed all programming for the research. TBA and DPH co-led the study design, reviewed all the data analyses and clinical interpretation, and led the final manuscript preparation.
Supplemental Material
Download MS Word (21.4 KB)Acknowledgments
The authors thank Natalie Edwards of Health Services Consulting Corporation, Boxborough, MA, USA for editorial assistance with the manuscript and Anshu Gupta of Johnson and Johnson, NJ, USA for re-doing the analysis to address reviewers’ comments.
Supplementary Material
Supplemental data for this article can be accessed online at https://doi.org/10.1080/17434440.2023.2185135
Additional information
Funding
References
- Losina E, Walensky RP, Kessler CL, et al. Cost-effectiveness of total knee arthroplasty in the United States: patient risk and hospital volume. Arch Intern Med. 2009;169(12):1113–1121.
- Carr AJ, Robertsson O, Graves S, et al. Knee replacement. Lancet. 2012;379(9823):1331–1340.
- Bemelmans YFL, Keulen MHF, Heymans M, et al. Safety and efficacy of outpatient Hip and knee arthroplasty: a systematic review with meta-analysis. Arch Orthop Trauma Surg. 2022;142(8):1775–1791.
- Losina E, Katz JN. Total knee arthroplasty on the rise in younger patients: are we sure that past performance will guarantee future success? Arthritis Rheum. 2012;64(2):339–341.
- Evans JT, Walker RW, Evans JP, et al. How long does a knee replacement last? A systematic review and meta-analysis of case series and national registry reports with more than 15 years of follow-up. Lancet. 2019;393(10172):655–663.
- Wang K, Sun H, Zhang K, et al. Better outcomes are associated with cementless fixation in primary total knee arthroplasty in young patients: a systematic review and meta-analysis of randomized controlled trials. Medicine (Baltimore). 2020;99(3):e18750.
- Parvizi J, Nunley RM, Berend KR, et al. High level of residual symptoms in young patients after total knee arthroplasty. Clin Orthop Relat Res. 2014;472(1):133–137.
- Bourne RB, Chesworth B, Davis A, et al. Comparing patient outcomes after THA and TKA: is there a difference? Clin Orthop Relat Res. 2010;468(2):542–546.
- Zaballa E, Ntani G, Harris EC, et al. Return to work and employment retention after uni-compartmental and total knee replacement: findings from the clinical outcomes in arthroplasty study. Knee. 2023;40:245–255.
- Kayani B, Haddad FS. Robotic total knee arthroplasty: clinical outcomes and directions for future research. Bone Joint Res. 2019;8(10):438–442.
- Smith AF, Eccles CJ, Bhimani SJ, et al. Improved patient satisfaction following robotic-assisted total knee arthroplasty. J Knee Surg. 2021;34(7):730–738.
- Jinnah A, Luo T, Plate J, et al. General concepts in robotics in orthopedics. In: Robotics in knee and hip arthroplasty. Springer, Cham. 2019. p. 27–35. DOI:10.1007/978-3-030-16593-2_3.
- Moreland JR. Mechanisms of failure in total knee arthroplasty. Clin Orthop Relat Res. 1988;226:49–64.
- Matsuda S, Kawahara S, Okazaki K, et al. Postoperative alignment and ROM affect patient satisfaction after TKA knee. Clin Orthop Relat Res. 2013;471(1):127–133.
- Khlopas A, Sodhi N, Hozack WJ, et al. Patient-reported functional and satisfaction outcomes after robotic-arm-assisted total knee arthroplasty: early results of a prospective multicenter investigation. J Knee Surg. 2020;33(7):685–690.
- Mulpur P, Masilamani ABS, Prakash M, et al. Comparison of patient reported outcomes after robotic versus manual total knee arthroplasty in the same patient undergoing staged bilateral knee arthroplasty. J Orthop. 2022;34:111–115.
- Choi YJ, Ra HJ. Patient satisfaction after total knee arthroplasty. Knee Surg Relat Res. 2016;28(1):1–15.
- Kayani B, Konan S, Pietrzak JRT, et al. Robotic-arm assisted total knee arthroplasty is associated with improved early functional recovery and reduced time to hospital discharge compared with conventional jig-based total knee arthroplasty. Bone Joint J. 2018;100B(7):930–937.
- Khlopas A, Sodhi N, Hozack WJ. Patient-reported functional and satisfaction outcomes after robotic-arm-assisted total knee arthroplasty: early results of a prospective multicenter investigation. J Knee Surg. 2019;33(7):685–690.
- Liow MHL, Goh GSH, Wong MK, et al. Robotic-assisted total knee arthroplasty may lead to improvement in quality-of-life measures: a 2-year follow-up of a prospective randomized trial. Knee Surg Sports Traumatol Arthrosc. 2017;25(9):2942–2951.
- Liow MHL, Xia Z, Wong MK, et al. Robot-assisted total knee arthroplasty accurately restores the joint line and mechanical axis: a prospective randomised study. J Arthroplasty. 2014;29(12)2373–2377.
- Marchand RC, Sodhi N, Anis HK, et al. One-year patient outcomes for robotic-arm-assisted versus manual total knee arthroplasty. J Knee Surg. 2019;32(11):1063–1068.
- Marchand RC, Sodhi N, Khlopas A, et al. Patient satisfaction outcomes after robotic arm-assisted total knee arthroplasty: a short-term evaluation. J Knee Surg. 2017;30(9):849–853.
- Marchand RC, Sodhi N, Khlopas A, et al. Coronal correction for severe deformity using robotic-assisted total knee arthroplasty. J Knee Surg. 2018;31(1):2–5.
- Xu JZ, Li LL, Fu J, et al. Comparison of serum inflammatory indicators and radiographic results in MAKO robotic-assisted versus conventional total knee arthroplasty for knee osteoarthritis: a retrospective study of Chinese patients. BMC Musculoskelet Disord. 2022;23(1):418.
- Xu Z, Li H, Liu Z, et al. Robot-assisted surgery in total knee arthroplasty: trauma maker or trauma savior? A prospective, randomized cohort study. Burns Trauma. 2022;10:tkac034.
- Ong KL, Coppolecchia A, Chen Z, et al. Robotic-arm assisted total knee arthroplasty: cost savings demonstrated at one year. Clinicoecon Outcomes Res. 2022;14:309–318.
- Bellemans J, Vandenneucker H, Vanlauwe J. Robot-assisted total knee arthroplasty. Clin Orthop Relat Res. 2007;464:111–116.
- Sharabiani MT, Aylin P, Bottle A. Systematic review of comorbidity indices for administrative data. Med Care. 2012;50(12):1109–1118.
- Menendez ME, Neuhaus V, van Dijk CN, et al. The Elixhauser comorbidity method outperforms the Charlson index in predicting inpatient death after orthopaedic surgery. Clin Orthop Relat Res. 2014;472(9):2878–2886.
- Groll DL, To T, Bombardier C, et al. The development of a comorbidity index with physical function as the outcome. J Clin Epidemiol. 2005;58(6):595–602.
- Groll DL, Heyland DK, Caeser M, et al. Assessment of long-term physical function in acute respiratory distress syndrome (ARDS) patients: comparison of the Charlson comorbidity index and the functional comorbidity index. Am J Phys Med Rehabil. 2006;85(7):574–581.
- Ming K, Rosenbaum PR. Substantial gains in bias reduction from matching with a variable number of controls. Biometrics. 2000;56(1):118–124.
- Rassen JA, Shelat AA, Myers J, et al. One-to-many propensity score matching in cohort studies. Pharmacoepidemiol Drug Saf. 2012;21(Suppl 2):69–80.
- Berry DJ, Bozic KJ. Current practice patterns in primary hip and knee arthroplasty among members of the American association of hip and knee surgeons. J Arthroplasty. 2010;25(6 Suppl):2–4.
- Garriga C, Leal J, Sánchez-Santos MT, et al. Geographical variation in outcomes of primary hip and knee replacement. JAMA Network Open. 2019;2(10):e1914325.
- Mont MA, Cool C, Gregory D, et al. Health care utilization and payer cost analysis of robotic arm assisted total knee arthroplasty at 30, 60, and 90 days. J Knee Surg. 2021;34(3):328–337.
- Cool CL, Jacofsky DJ, Seeger KA, et al. A 90-day episode-of-care cost analysis of robotic-arm assisted total knee arthroplasty. J Comp Eff Res. 2019;8(5):327–336.
- Batailler C, Fernandez A, Swan J, et al. MAKO CT-based robotic arm-assisted system is a reliable procedure for total knee arthroplasty: a systematic review. Knee Surg Sports Traumatol Arthrosc. 2020;29:3585–3598.
- van der List JP, Chawla H, Joskowicz L, et al. Current state of computer navigation and robotics in unicompartmental and total knee arthroplasty: a systematic review with meta-analysis. Knee Surg Sports Traumatol Arthrosc. 2016;24(11):3482–3495.
- Ren Y, Cao S, Wu J, et al. Efficacy and reliability of active robotic-assisted total knee arthroplasty compared with conventional total knee arthroplasty: a systematic review and meta-analysis. Postgrad Med J. 2019;95(1121):125–133.
- Bollars P, Boeckxstaens A, Mievis J, et al. Preliminary experience with an image-free handheld robot for total knee arthroplasty: 77 cases compared with a matched control group. Eur J Orthop Surg Traumatol. 2020;30(4):723–729.
- King C, Edgington J, Perrone M, et al. The effects of robot-assisted total knee arthroplasty on readmission and postoperative pain: are the added costs worth it? Orthop Proc. 2019;101-B(SUPP_5)124–127.
- Khlopas A, Sodhi N, Sultan AA, et al. Robotic arm-assisted total knee arthroplasty. J Arthroplasty. 2018;33(7):2002–2006.
- Waddell BS, Carroll K, Jerabek S. Technology in arthroplasty: are we improving value? Curr Rev Musculoskelet Med. 2017;10(3):378–387.
- Patel AA, Singh K, Nunley RM, et al. Administrative databases in orthopaedic research: pearls and pitfalls of big data. J Am Acad Orthop Surg. 2016;24(3):172–179.
- Bohl DD, Singh K, Grauer JN. Nationwide databases in orthopaedic surgery research. J Am Acad Orthop Surg. 2016;24(10):673–682.