
Abstract
In this study, a Bayesian Network (BN) was developed for the prediction of the hazard potential and biological effects with the focus on metal- and metal-oxide nanomaterials to support human health risk assessment. The developed BN captures the (inter) relationships between the exposure route, the nanomaterials physicochemical properties and the ultimate biological effects in a holistic manner and was based on international expert consultation and the scientific literature (e.g., in vitro/in vivo data). The BN was validated with independent data extracted from published studies and the accuracy of the prediction of the nanomaterials hazard potential was 72% and for the biological effect 71%, respectively. The application of the BN is shown with scenario studies for TiO2, SiO2, Ag, CeO2, ZnO nanomaterials. It is demonstrated that the BN may be used by different stakeholders at several stages in the risk assessment to predict certain properties of a nanomaterials of which little information is available or to prioritize nanomaterials for further screening.
Introduction
Nanomaterials are widely used in almost all sectors in our society, and hence, human and environmental exposure to these materials is likely. The risk assessment (RA) of nanomaterials (NMs) faces difficulties as it requires an extensive datasets on physiochemical parameters, hazard identification and exposure assessment (Stone et al., Citation2014a). For this reason, only a few attempts to perform a RA of NMs are available in the scientific literature (i.e., (nano)silica, (nano)titanium, CNTs and silver NMs) (Dekkers et al., Citation2011, Citation2013; Heringa et al., Citation2016; Wijnhoven et al., Citation2009). Interestingly, US-EPA published a conditional registration of a nanosilver containing product (EPA, Citation2011). The great challenge for the RA of NMs is to keep pace with the high speed of innovations in research and development that result in an ever increasing diversity of NMs. Therefore, a system that identifies those NMs that should get priority in the RA would be very helpful.
Several approaches have been proposed to classify NMs and to estimate their risks that include stochastic multicriteria acceptability analysis (SMAA-TRI) (Tervonen et al., Citation2007), weight of evidence (WOE) (Hristozov et al., Citation2014; Linkov et al., Citation2011), grouping (Arts et al., Citation2014, Citation2016), quantitative nanostructure–activity relationship (QSAR) (Singh & Gupta, Citation2014; Winkler et al., Citation2014) and Bayesian networks (Linkov et al., Citation2015; Low-Kam et al., Citation2015; Money et al., Citation2014). Combinations of these methods were proposed to integrate and collate heterogeneous information to estimate the risk of NMs under scarcity of data (Hristozov et al., Citation2012; Linkov et al., Citation2015).
Bayesian network (BN) has been proposed as a potential tool in risk assessment of NMs (Keisler & Linkov Citation2014; Linkov et al., Citation2014, Citation2015; Low-Kam et al., Citation2015; Money et al., Citation2014; Murphy et al., Citation2016; Winkler et al., Citation2014), in forecasting environmental risks of NMs (Money et al., Citation2012) and in characterizing relationships between physicochemical properties of NMs and their in vitro toxicity (Low-Kam et al., Citation2015). The potential use of the BN approach for nanoparticles risk assessment was detailed in (Morgan, Citation2005; Wiesner & Bottero, Citation2011).
BN is a graphical model that presents probabilistic relationships among a set of variables to represent knowledge, reasoning under uncertainty, and drawing conclusions based on available information (Cheng et al., Citation2002). BN approaches offer several features that are useful in hazard ranking of NMs. Firstly, a BN is based on probabilistic relationships that provides insight and an understanding even with partial and limited information (Beaudequin et al., Citation2015). This is particularly important in the case of NM hazard ranking were the relationships between NMs physicochemical properties and their effects on human health have not been firmly established. Secondly, BN allows to include expert knowledge and their experience in the model. This is considerably useful when the data are limited, but expert knowledge is available. Thirdly, BN facilitates reasoning and drawing conclusions by using efficient algorithms, even when information is missing or the knowledge of an expert is limited (Lauritzen, Citation1995). The use of algorithms facilitates the sensitivity analysis to address the uncertainties that are caused by the different parameters and to reveal variables that are major drivers for the outcome (CoupÉ et al., Citation2000). Finally, BN satisfies the requirement for quantitative approaches that can be used to generate forecasts and associated levels of uncertainty and can be easily up-dated as new information becomes available. The uncertainty is explicitly represented in a BN model, as each node or variable is represented as a probability distribution (Wiesner & Bottero, Citation2011).
BNs have been extensively used in different areas of research such as in the chemical mode of action classification for aquatic toxicology (Carriger et al., Citation2016) and ecological risk assessment (Lee & Lee, Citation2006; Pollino et al., Citation2007); to classify images in medical image analysis (Arias et al., Citation2016); to predict food fraud (Marvin et al., Citation2016; Bouzembrak & Marvin, Citation2016); to detect surgical site infections and safety assessment of natural gas stations (Sohn et al., Citation2016; Zarei et al., Citation2016).
In this paper, we explore the potential of BNs to predict hazard levels of NMs to support risk assessors in their attempts to prioritize NMs for a full human health risk assessment. By means of expert consultation and literature data, a BN was constructed and validated with data derived from studies recently published. The applicability of the BN to forecast the potential hazard level and potential biological effects of NMs is demonstrated for several metal and metaloxide NMs.
Materials and methods
In this study, the construction of the BN consists of the following: (i) expert elicitation, (ii) collection of the data, (iii) BN construction and, (iv) validation of the constructed BN (Langseth & Portinale, Citation2007) (). Generally, a BN graphical structure is constructed manually with expert knowledge or semiautomatically from data. In our study, both approaches were combined. An initial BN graphical structure was constructed based on an extensive expert consultation. This initial BN structure was subsequently revised and optimized using the semiautomatic mode of the Hugin software and data of NMs collected from literature.
Figure 1. The method steps.

Expert elicitation
In this step, the relevant variables of the BN (i.e., nodes), their value range (i.e., states), and the main relationships (e.g., linkages) among them were defined by means of expert elicitation. Two expert elicitation rounds were executed. In the first round, six experts in the field of (in vivo, in vitro) nanotoxicology from the Netherlands participated. An online questionnaire was used for the survey and included 15 questions. In this questionnaire, national experts selected the most important NM variables, including exposure routes, potential biological effects and physicochemical properties that can affect human health. Based on the feedback received, a second expert elicitation round was conducted using an online questionnaire. The experts were selected from ongoing EU Framework 7 projects and are all highly experienced in the area of risk assessment of NMs. In total, 29 experts were invited to participate. The questionnaire of this second round contained 36 questions. The purpose of this questionnaire was to confirm/validate the answers from the first round and to establish the interactions between nodes and to determine their states. The full list of questions can be seen in Supplement 1 (Questionnaire).
Literature data collection
Toxicity data of metal and metaloxide NMs were collected from studies reported in the scientific literature in the period of 2009–2015. It was ensured that data was available for all nodes identified in the expert elicitation. In total, 32 scientific articles were used (Supplement 1 Table A1).
A Microsoft Excel dataset related to the developed BN was created, where each node in the model is related to one column in the file and each row in the database represents one case. In one row, data on a specific NM (e.g., reported physicochemical properties) and the results reported of this material in an in vitro or in vivo experiment (e.g., biological effect) were collected and referred to as a case. Each row contained the results of one NM with unique properties and only one experiment. For example, if the same experiment was performed for two slightly different NMs (e.g., only particle size differs), two rows were constructed. Hence, many cases could be extracted from one article.
The database created consists of 20 columns (i.e., nodes) and 559 rows (i.e., cases). It contains eight nodes indicating biological effects, namely neurological effects, cardio-pulmonary effects, immunological effects, inflammation, genotoxicity, reaches central nervous system, fibrosis and cytotoxicity (). Since outcomes of a toxicity study are generally more specific than these generic biological effects nodes, a grouping was conducted based on literature and expert knowledge ().
Table 1. Grouping of endpoints for the determination of the different biological effects.
The selected 32 articles were assessed for the presence of tested endpoints related to the biological effects described in the BN (). To determine the state of the biological effect node (none/low/medium/high), classification criteria presented in were used.
Table 2. Criteria for the classification of the biological effects.
To be classified as having a biological effect, the result related to the tested endpoint had to be significantly different from the control (as reported by the article). If the tested endpoint showed no significant difference compared to the control, the value of the related effect was recorded as “None.” If the tested endpoints were significantly different from the control, the related effects were classified as low/medium/high. This scale reports the probability of the NM exerting this effect (strength of the evidence) and not the severity of the effect. When there was a significant difference in the tested endpoint, although not dose-related, the related effect was classified as “Low”. For the effect to be classified as “Medium” or “High”, the results of the tested endpoint should show a dose–response relation and be positive for more than one/few of the tests indicating this effect or in at least several animals (when the results of an in vivo study are presented per animal) (). For the in vitro cytotoxicity effects, the medium and high classification was based on the decrease in cell viability and the presence of an LD50, which indicates a dose–response effect. To be classified as “Medium,” <75% decrease in cell viability must have been determined. To be classified as “High,” 75–100% decrease in cell viability must have been determined.
In addition to the eight biological effects nodes, an overall effect node was created (i.e., NM hazard). This node depicts the potential of a NM to exert a biological effect and is determined based on the following expression:
(1)
where HRi is NM hazard score of case i and BEik is the biological effect level score of case i and biological effect k. For example, BEik = 0 when the biological effect is equal to none or missing data. The HRi score was classified using the same score table () of the biological effects, except for the “High” classification effect. NM hazard node was defined as “High” when HRi ≥ 3.
BN construction
A BN is a graphical model that represents probabilistic relationship among a set of nodes. A BN is a directed acyclic graph, where the nodes represent the variables U = {Ai, …, An } and the directed links between them indicate the relationship among the nodes. Each node is composed of a set of states. A node Ai is the parent of the child node Aj, if there is a link from Ai to Aj. BN specifies a unique joint probability distribution of all nodes P(U) = P(A1, …, An), given by the product of all conditional probability tables specified in BN:
(2)
where pa(Ai) are parents of node Ai and P(Ai|pa(Ai)) specifies a conditional probability distribution. The calculations are based on Bayesian theory, where the probability of event A at the condition of event B is expressed as:
(3)
In which P(A) is the prior probability of A, P(B|A) is the probability of B under the condition of a known event A and P(B) is prior probability of B. An example of BN with six nodes is shown in . The corresponding decomposition of joint distribution of nodes is given by
Figure 2. A typical Bayesian network showing the probabilistic relationship between a set of nodes.
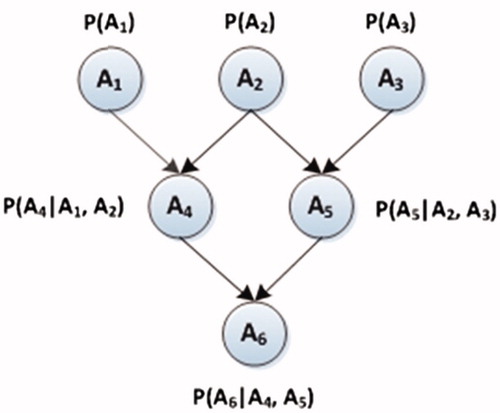
To calculate the joint distribution, unconditional distributions of P(A1), P(A2), P(A3) and conditional distributions of P(A4|A1, A2), P(A5|A2, A3), PA6|A4, A5) should be specified.
In this case, an initial BN structure was generated from the information that was collected through the expert elicitation. Subsequently, the BN was optimized using literature data for each node and the learning algorithm of the Hugin 8.3 software (http://www.hugin.com/) (Aalborg, Denmark). Generally, when sufficient data are available, machine learning techniques can be used to estimate the conditional probability tables (CPTs) of a BN and to define the optimal configuration of the interactions between nodes (Alameddine et al., Citation2011; Denœux Citation2010, Citation2011). In this study, the expectation–maximization (EM) learning algorithm was used to build the BN and to estimate the probabilities within each CPT of the BN (Heckerman, Citation2008; Marcot et al., Citation2006; Nyberg et al., Citation2006). In total, 468 different cases were collected from the papers and used for the learning process (learning data are available in Supplement 2).
Validation of the BN
The validation of the BN was conducted with an out-of-sample test against 91 cases extracted from the selected set of scientific papers as described earlier. These cases were not used for the development of the BN (validation data are available in Supplement 2).
The validation was performed for each case, where the biological effect or the NM hazard level was forecasted using the reported NM physicochemical parameters (e.g., shape, nanoparticle, dissolution, surface area, surface charge, surface coatings, surface reactivity, aggregation, particle size) of the cases as input values. Note that, as expected, missing data existed within the out-of-sample dataset used for validation. We assumed that the prediction made by the BN based on these input values was correct when the biological effect or NM hazard level (with the highest probability) given by the BN matched the level depicted in the validation case (see section Sensitivity analysis).
Sensitivity analysis
The aim of this sensitivity analysis is to measure the effect of the NM physiochemical properties into NM hazard node and the different biological effect nodes (e.g., genotoxicity, cytotoxicity, neurological effects, etc.). In the literature, the entropy function has been used to analyze the sensitivity of BN models (Cover & Thomas, Citation2006; Kjærulff & Madsen, Citation2013). It consists of calculating the function H(X) of a node X:
(4)
Where P(X) is the probability distribution of X.
Results
Expert elicitation
By means of two rounds of expert consultation, it was determined (i) which node is relevant, (ii) the value range (e.g., states) of the node, (iii) the relationships between the nodes. The first round (with 6 experts from the Netherlands) was used to shape the questionnaire of the second international round. In total, 29 international experts were invited to participate in the second round and 15 completed questionnaires were returned (i.e., 52%). The selection of the most relevant physicochemical properties was based on the results of the two online questionnaires.
As an example we show the results for nanomaterial properties. In the first questionnaire, national experts validate the most important NM variables that can influence the human hazard potential, the exposure routes and the potential toxic effects. In addition, the interactions between the model variables were determined. The national experts consulted in the first round generally agreed on the NM characteristics (i.e., BN variable) that are relevant for human health and the ones that should be excluded. Based upon this expert elicitation, we included: degree of aggregation (N =5), surface reactivity (N = 5), solubility (N = 5) and particle size distribution (N = 5) (). Based on these results, the international questionnaire was updated and no questions were included about the NM degradation rates, and NM sediments rates. The results of the international survey are shown in . It can be seen that a total of eight NM characteristics were identified by six or more international experts as influencing human health. These are shape, solubility, surface area, surface charge, surface coatings, surface reactivity, particle size distribution and degree of aggregation. Only one expert mentioned purity of NM. No expert used the “other option” to include NM characteristics not mentioned in the survey.
Figure 3. NM characteristics mentioned by national experts.
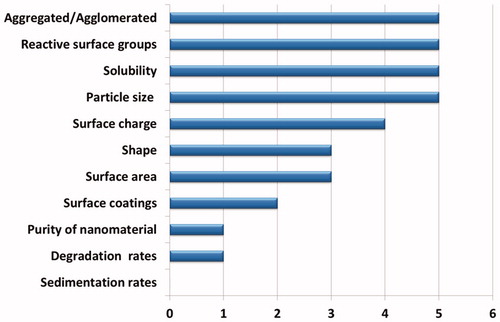
Figure 4. NM characteristics mentioned by international experts.
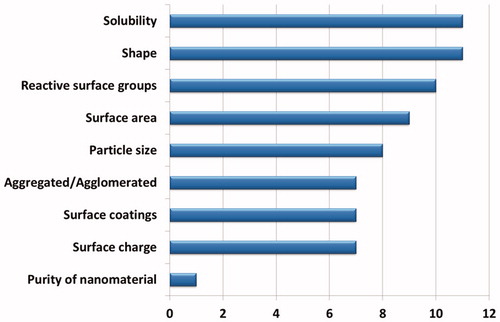
Only those physicochemical properties that were nominated by seven or more experts (N ≥ 7) in the second round were used for the BN model. These were: dissolution (N = 11), shape (N =11), surface reactivity (N = 10), surface area (N = 9), particle size (N = 8), surface charge (N = 7), surface coatings (N = 7) and degree of aggregation (N = 7).
Similar approach as used for NM properties was applied for both biological effects and exposure routes. For the biological effects indicated as important by the experts in the second round, we used the properties that were mentioned by 4 or more experts and these are immunological effects (N = 11), inflammation (N= 9), cardiopulmonary effects (N = 9), genotoxicity (N = 8), cytotoxicity (N= 8), fibrosis (N= 7), cell transformation (N= 4) and neurological effects (N= 4) (See Supplement 2). For cell transformation, no literature data could be retrieved and therefor is not included in the final BN model as a node.
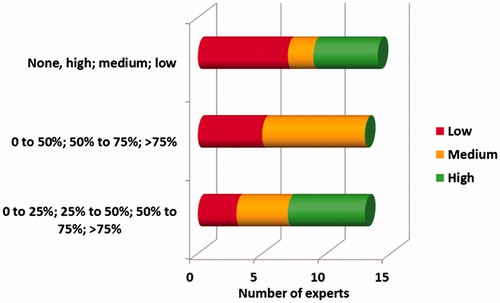
Each node in the BN model contains states which can represent values or intervals for physical quantities, linguistic terms, etc. The different states of the proposed nodes in round 1 were validated by international experts in the second survey. As an example, we show in the result for the dissolution node. Three options for the discretization were presented and it is clear that the majority of the experts prefer the third option being (0 to 25%; 25% to 50%; 50% to 75%; >75%). In addition, the experts could propose an alternative discretization, but none used this option. The full questionnaire results can be seen in Supplement 2.
Figure 5. Distribution of answers to the question related to the states of node “Dissolution distribution”.
Development of the BN and validation
The BN that was developed from expert elicitation and machine learning is shown in and includes the probabilities of the states of each node. The node NM hazard, depicting the strength of evidence for a hazard potential, gives the following probabilities for the states: “None” (41.67%), “Medium” (18.16%), “Low” (10.90%) and “High” (29.27%).
Figure 6. The BN structure containing state probabilities of each node, where the green ellipses are physicochemical properties of NM, orange ellipses are biological effects, yellow ellipses are additional nodes for administration routes and study type and finally ellipse is the NM hazard node. CNS: (Reaches) central nervous system.
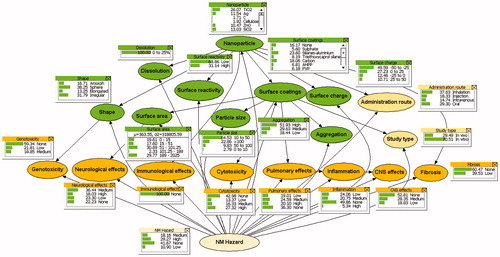
The most commonly used NMs in the studies included in the model are as follows: TiO2 (26.07%), SiO2 (13.03%), Ag (11.54%), ZnO (10.47%) and CeO2 (5.98%). Other (metal) NMs appear (Co3O4, Cr2O3, CuO, Ni2O3, Fe3O4, ZrO2, etc.) less frequently (all 2% or less). The NM properties contributing most to the hazard potential of these NM are in decreasing order: nanoparticle, surface coating, surface area, aggregation and particle size (data not shown).
To validate the developed BN, 91 cases were randomly selected from the initial dataset. These were not used for the BN construction. As illustration, we present the first 20 cases in , showing the input parameters of the cases being; study type, NM physicochemical properties and administration route. The NM hazard level that was derived for that specific case from the biological effect data is also shown. The latter was not used as input for the validation but represents the property of the case to be predicted by the BN.
Table 3. Validation results of the BN; input values (20 cases).
Based only on the given physiochemical properties, study type and administration route, the probability of the states (none/low/medium/high) of NM hazard, were calculated by the BN (). The state with the highest probability was then compared to the actual state as derived from literature (, column NM hazard).
For example, the input parameters of the first validation case (, N = 1) are: study is an “In vivo” study, nanoparticle is “Ag,” the shape is “Sphere,” particle size is “10 to 50,” exposure route is “Inhalation” and all other parameters are unknown such as dissolution, surface area, surface charge, surface reactivity and aggregation (i.e., missing information of this particular case). Based on these input parameters, the BN gave the highest probability for the NM hazard state “High,” which is similar to the state derived from the literature. Comparison of the last two columns in shows that the level of NM hazard is predicted correctly in 17 out of the 20 cases. Considering all 91 cases, 72% were predicted correctly (not shown). It should be noted that even though information of many nodes of a case is missing, the BN still can, in most instances, predict NM hazard level correctly.
Similar results were also found for the prediction of the biological effect. shows these results for the 20 cases presented in . As can be seen in , the BN predicted the biological effect and its level correctly for 15 out of the 20 cases. When all 92 cases are considered, 71% were predicted correctly (data not shown).
Table 4. BN results; biological effects prediction.
Sensitivity analysis
The sensitivity of our BN was assessed using the described entropy function (EquationEquation 4(4) ). The result of the effect (i.e., entropy) of NM physiochemical properties on the NM hazard node and biological effects are presented in . Nanoparticle (0.39) surface coatings (0.22) and surface area (0.15) are identified as having more influence on the NM hazard node than the other properties. The same properties are also the most important for the biological effects and the highest values are observed for cytotoxicity and inflammation ().
Table 5. Sensitivity analysis showing the effect (entropy) of NM physiochemical properties on the NM hazard node and the nodes of biological effects.
Demonstration of the application of the BN; comparison between several NMs
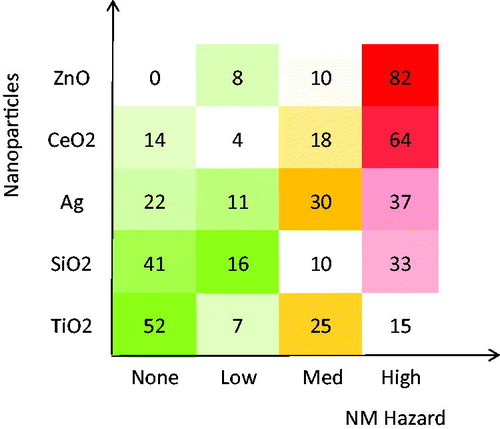
To show potential applicability of the BN, we compared the hazard potential of 5 NMs (i.e., TiO2, SiO2, Ag, CeO2, ZnO) based on the node “nanoparticle” only. The results are presented in . As can be seen in NM hazard category “High”, ZnO has the highest hazard potential (e.g., 82%) and TiO2 the lowest (e.g., 15%).
Figure 7. The probability (%) of the hazard potential of NMs as predicted by the BN.
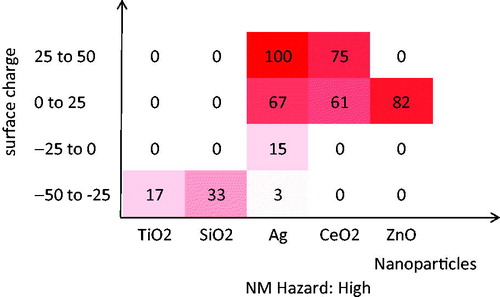
The BN also allows the assessment of the effect of the various NM properties contributing to the observed biological effect or potential hazard level. As an illustration, we show the relationships between the surface charge of the NMs and their predicted hazard potential. To this end, ‘high’ level was selected in the NM hazard node and the probabilities in the NM surface charge node were recorded. The results are shown in . It appears that for all NMs (except for SiO2), the highest probabilities are observed for surface charges above 0, suggesting that for these NMs, the positive charged surface contributes to their hazard potential.
Figure 8. Effect of surface charge on the prediction of the high category level of hazard potential of NMs TiO2, SiO2, Ag, CeO2, ZnO. The figures give the probabilities in percentages.
The impact (entropy) of physicochemical property nodes and biological effect nodes on the hazard nodes was calculated for five NMs (i.e., TiO2, SiO2, Ag, CeO2, ZnO) using the constructed BN (). The results show that the NMs differ regarding the most important physicochemical properties but less variation was observed for the biological effect. For all 5 NMs, cytotoxicity has the highest entropy indicating that for these NMs this is the most important biological effect determining its hazard. As shown in for the NM Ag, the surface coatings (0.53), the surface charge (0.37) and the surface area (0.28) are the main physiochemical properties having the highest effect on the NM Hazard node in the model. The most influential biological effects in NM hazard node for Ag are cytotoxicity (0.85), inflammation (0.53) and CNS effects (0.49). For TiO2, we found that particle size (0.28), shape (0.26) and the surface coatings (0.26) are the most important physiochemical properties having a high impact on the NM hazard node ().
Table 6. The main NM physiochemical properties and the biological effects of 5 NMs (i.e., TiO2, SiO2, Ag, CeO2, ZnO) affecting NM hazard node.
Discussion
In this work, we have uniquely developed a BN for NM human hazard ranking that was constructed by expert consultation and an additional literature survey. The potential of BNs have been shown in various studies (Hristozov et al., Citation2012; Linkov et al., Citation2015; Low-Kam et al., Citation2015; Money et al., Citation2014) and is often related to the strength of BNs in data scarce environments. The validation of the BN as developed here showed a high accuracy of the predictions of the model, and interestingly, it could “correctly” rank NMs with minimal input data (i.e., only elementary composition).
This BN can be used by different stakeholders. Firstly, our model can be applied in RA (at the industrial health, safety and environment management and regulatory level) to prioritize NMs for further testing. The minimal data needs of our BN can be of particular interest for small and medium-sized enterprises (SME), with limited resources for toxicological testing of NM. Secondly, BNs like this can be used to for simulation purposes to predict biological effects of (new) NMs and hence, support industrial safe-by-design approaches. Lastly, it can provide estimates of physicochemical properties of a given NM in the BN on which no data has been provided, which is relevant for fundamental studies, the production of inherently safer materials. This may help designers of NMs to direct future developments.
NM properties driving biological effects have been discussed for a long time (OECD, Citation2014). Expert consultation prioritized the NM dissolution, shape, reactive surface groups, surface area and size distribution as the most important key descriptors, as observed earlier (Bouwmeester et al., Citation2011; Izak-Nau et al., Citation2015). The outcome of our BN model is in line with these findings and showed that the following properties, in decreasing order of importance, were found to be the most important descriptors of the potential hazard of NMs: elemental composition, surface coating, surface area, aggregation and particle size.
It is clear that prioritization of the most relevant variables is complex since each descriptor is inherently linked to other descriptors and together they determine the final reactive properties of a NM. For instance, the size determines the (relative) surface area, combined with the chemical composition it affects the dissolution potential of a NM. Also, the redox status is heavily influenced by the chemical composition. The type of chemical groups that can be introduced to the NM surface is to some extent dependent on the chemical composition of the core NM, and largely affects both the intrinsic and extrinsic NM properties. For instance, capping agents and surface groups affect the dissolution potential and charge, which subsequently affects the aggregation potential (Nel et al., Citation2013). Indeed, many NM descriptors are correlated, but most of them can be individually manipulated at the NM design stage. It is because of this that, several frameworks for decision making concerning risk assessment of NMs include the intrinsic and extrinsic descriptors a tiered assessment approach (Arts et al., Citation2014, Citation2016).
High dissolution properties, and therefore high ionic concentrations, are known to generally lead to high toxicity (Nel et al., Citation2013). For this reason, dissolution properties are included in early stages of tiered risk assessment approaches (Arts et al., Citation2014, Citation2016). Our BN model correctly identified a ZnO and Ag NM that are known to readily shed ions as having a high hazard risk. However, in our BN model, dissolution does not contribute to the biological effect. This might be due to the dissolution states used in this study, which were proposed by the experts in the expert elicitation (i.e., 1–25%, 25–50%, 50–75%, >75%). All data collected falls into the first category (i.e., dissolution 1–25%; ). Furthermore, in the studies form literature that were analyzed in our study, only in 50% of the cases data on solubility was provided (Supplement 2), which may be caused by the current challenges to determine solubility of a NM in biological matrices (Tantra et al., Citation2016). It is evident that more states in the lower dissolution ranges combined with more data (i.e., more cases) will result in a higher contribution of dissolution node to the hazard noted of this BN.
In various steps of the BN development, expert judgment was included. Firstly, the collection of data from scientific papers that feeds the BN. For this, we developed a transparent and consistent procedure as described in the material and method section, which includes (i) selection of appropriate papers, (ii) classifying the biological effects (toxicological end points) according to the presented criteria ( & ). No systematic procedure was followed to select the papers except that we aimed to obtain data for all nodes in the model and that the papers used in this study were considered of being of high quality (expert judgment). The flexibility of BN makes it easy to add new data (e.g., cases) as they appear in the future. To be able to classify the biological effects effectively, a toxicological background of the expert is necessary. In our study, in several stages of the data extraction and classification process, the correctness of the classification was evaluated to ensure a proper classification.
The second part that included expert judgment was the development of the BN. Two rounds of expert elicitation have been used to shape the current BN, including the nodes and states. With advancing knowledge, additional nodes might be added to the BN, which is facilitated by the intrinsic principle of a BN (Sessa & D'Urso, Citation2014). To enable a scoring on the hazard potential, the results in the effect nodes are combined into the NM hazard node. In the current model, the different effects are treated equally, no weighing or prioritization of the effect nodes has been used, nor have we incorporated a consideration of the relevance of the endpoints in relation to human disease endpoints. Certainly, this is a point for improvement and can be determined by expert elicitation. The current study aimed to show the potential of this approach and the authors are aware that further improvements are possible especially because of the flexibility that BN offers.
The strength of a BN, as applied in this study, lies in the fact that all these relationships are taken into account and are used to estimate the hazard potential or biological effects. However, the predictive power of the model will be influenced by the amount and quality of the data from which it is parameterized (Banko & Brill, Citation2001). The current model is built on 468 cases. Literature was selectively searched to deliver data for all nodes. However, it appeared impossible to retrieve similar data quantity for all nodes, especially for the biological effect nodes, as have been observed before (Stone et al., Citation2014b). The nodes with the highest amount of data were elemental composition, shape and particle size and the lowest were immunological effects, genotoxicity and fibrosis. The ability to deal with missing data is the strength of BN and improvement of the model (e.g., new relationships) and performance may be realized with more and complementary data (Friedman & Yakhini, Citation1996). The applicability and validity of the constructed BN model was shown with the prediction of the hazard potential in new cases, which was 72%.
The BN may be used for scenario studies by manufacturers to apply safe-by-design approaches (i.e., investigate the effect of changing shape, or size on the potential biological effects) or may be used in human health risk assessment to predict certain properties of a NM of which little information is available or to prioritize NMs for further screening. For example, when comparing the predicted hazard potential of five NMs, ZnO was shown to have the highest probability for a high hazard potential, whereas TiO2 had the lowest. Most likely these can be attributed to the difference is dissolution potential of these NMs. ZnO NM are known to dissolve under realistic biological conditions (Kim et al., Citation2014). In the second example, increasing surface charge was also shown to contribute to the hazard potential of these NMs, which increased with increasing positive charge. It is generally accepted that zeta potential of NMs plays an important factor in toxicokinetics and bioavailability where positively charged NMs passage cellular barriers more quickly, but the link to toxicity is not always apparent.
BN allows combination of material and bio-physical interaction properties in a quantitative manner and can be applied as a stand-alone concept. The unique feature of BN to fill data gaps of NMs of which little data is available (e.g., read across) can also be utilized to strengthen other approaches such as the grouping concept (Arts et al., Citation2015; Oomen et al., Citation2015). Therefore, the main role BN can have in risk assessment is to rapidly identify those NMs that have the highest human hazard risk ranks and focus these NMs. Thus, it contributes the RA of NMs to keep pace with the high speed of innovation in research and development. The BN presented in this study was designed to rank NMs based on their hazard potential and may be improved in several ways. Firstly, adding more cases from the literature, including other types of NMs such as organic NMs, will increase its performance and applicability. Especially, nodes that have little data input (such as dissolution, immunological effects, genotoxicity and fibrosis) should be enriched. Secondly, the present model does not include a weighting between the various biological effects that contribute/are linked to the final hazard level. All effects are taken as equal and no synergistic contributions are considered. Expert consultation on this issue may improve this point. Thirdly, a quality assessment of the data (literature) included in the model may help to discriminate between the contributions of the various studies. A similar quality assessment approach may be followed as developed for the Nanomaterial Registry database (https://www.nanomaterialregistry.org), which contains nanomaterial information from publicly available nanomaterial resources. The quality of the data inserted into the database is evaluated in the three following categories: (i) physicochemical characteristics of a NM, (ii) biological interactions of a nanomaterial, (iii) environmental interactions of a nanomaterial (Ostraat et al., Citation2013).
In the future, the model may be extended with exposure data enabling prediction of the health risks of NMs. The model performance can be improved by incorporating new data from other NMs databases. For example, the EU database working group (WG) of the EU Nanosafety Cluster aims to achieve data interoperability and a common language (one or more ontologies) for European databases for project results and data. Similarly, in the United States, the Nanomaterial Registry of the National Institutes of Health (NIH) is a digital nanotechnology data and information infrastructure designed to support data sharing, and collaboration. Such additions may be possible since the nodes of the BN are similar to the ontology used in the referred databases.
Conclusions
In this study, a BN was developed to predict biological effects and hazard potential of metal and metaloxide NMs in human using expert knowledge and available NMs data in literature. The BN consisted of physicochemical characteristics of NMs (eight different nodes), biological effects (eight different nodes) and exposure routes. The constructed BN showed high prediction performance for the hazard potential as well as for the biological effect and hence is suitable to rank NMs for these properties. Furthermore, it also allows a detailed evaluation of the contribution of the various NM properties to the observed effect.
Supplementary_Materials.zip
Download Zip (3.4 MB)Acknowledgements
This study was conducted in the framework of NanoNextNL (www.nanonextnl.nl), a micro and nanotechnology consortium of the government of The Netherlands and 130 partners. Addition funding was made available by the The Netherlands Ministry of Economic Affairs.
Disclosure statement
The authors report no conflicts of interest. The authors alone are responsible for the content and writing of this article.
Additional information
Funding
Related Research Data
References
- Alameddine I, Cha Y, Reckhow KH. 2011. An evaluation of automated structure learning with Bayesian networks: an application to estuarine chlorophyll dynamics. Environ Modell Softw 26:163–72.
- Arias J, Martínez-Gómez J, Gámez JA, Seco de Herrera AG, Müller H. 2016. Medical image modality classification using discrete Bayesian networks. Comput Vis Image Underst 151:61–71.
- Arts JHE, Hadi M, Irfan M-A, Keene AM, Kreiling R, Lyon D, et al. 2015. A decision-making framework for the grouping and testing of nanomaterials (DF4nanoGrouping). Regul Toxicol Pharmacol 71:S1–S27.
- Arts JHE, Hadi M, Keene AM, Kreiling R, Lyon D, Maier M, et al. 2014. A critical appraisal of existing concepts for the grouping of nanomaterials. Regul Toxicol Pharmacol 70:492–506.
- Arts JHE, Irfan M-A, Keene AM, Kreiling R, Lyon D, Maier M, et al. 2016. Case studies putting the decision-making framework for the grouping and testing of nanomaterials (DF4nanoGrouping) into practice. Regul Toxicol Pharmacol 76:234–61.
- Ashcroft T, Simpson JM, Timbrell V. 1988. Simple method of estimating severity of pulmonary fibrosis on a numerical scale. J Clin Pathol 41:467–70.
- Banko M, Brill E. 2001. Scaling to very very large corpora for natural language disambiguation. Proceedings of the 39th Annual Meeting on Association for Computational Linguistics. Toulouse, France: Association for Computational Linguistics.
- Beaudequin D, Harden F, Roiko A, Stratton H, Lemckert C, Mengersen K. 2015. Beyond QMRA: modelling microbial health risk as a complex system using Bayesian networks. Environ Int 80:8–18.
- Bouwmeester H, Lynch I, Marvin HJ, Dawson KA, Berges M, Braguer D, et al. 2011. Minimal analytical characterization of engineered nanomaterials needed for hazard assessment in biological matrices. Nanotoxicology 5:1–11.
- Bouzembrak Y, Marvin HJP. 2016. Prediction of food fraud type using data from rapid alert system for food and feed (RASFF) and Bayesian network modelling. Food Control 61:180–7.
- Carriger JF, Martin TM, Barron MG. 2016. A Bayesian network model for predicting aquatic toxicity mode of action using two dimensional theoretical molecular descriptors. Aquat. Toxicol 180:11–24.
- Cheng J, Greiner R, Kelly J, Bell D, Liu W. 2002. Learning Bayesian networks from data: an information-theory based approach. Artif Intel 137:43–90.
- Chuang HC, Juan HT, Chang CN, Yan YH, Yuan TH, Wang JS, et al. 2014. Cardiopulmonary toxicity of pulmonary exposure to occupationally relevant zinc oxide nanoparticles. Nanotoxicology 8:593–604.
- CoupÉ VMH, Van Der Gaag LC, Habbema JDF. 2000. Sensitivity analysis: an aid for belief-network quantification. Knowl Eng Rev 15:215–32.
- Cover TM, Thomas JA. (2006). Elements of information theory (Wiley series in telecommunications and signal processing). USA: Wiley-Interscience.
- Dekkers S, Bouwmeester H, Bos PM, Peters RJ, Rietveld AG, Oomen AG. 2013. Knowledge gaps in risk assessment of nanosilica in food: evaluation of the dissolution and toxicity of different forms of silica. Nanotoxicology 7:367–77.
- Dekkers S, Krystek P, Peters RJ, Lankveld DP, Bokkers BG, van Hoeven-Arentzen PH, et al. 2011. Presence and risks of nanosilica in food products. Nanotoxicology 5:393–405.
- Denœux T. 2010. Maximum likelihood from evidential data: an extension of the EM algorithm. Adv Intell Soft Comp 77:181–8.
- Denœux T. 2011. Maximum likelihood estimation from fuzzy data using the EM algorithm. Fuzzy Set Syst 183:72–91.
- EPA. 2011. Conditional Registration of HeiQ AGS-20 as a Materials Preservative in Textiles. Environmental Protection Agency, Office of Pesticide Programs, EPA-HQ-OPP-2009-1012-0064.
- Friedman N, Yakhini Z. 1996. On the sample complexity of learning Bayesian networks. Proceedings of the Twelfth international conference on Uncertainty in artificial intelligence. Portland, OR: Morgan Kaufmann Publishers Inc.
- Gordon T, Nadziejko C, Schlesinger R, Chi Chen L. 1998. Pulmonary and cardiovascular effects of acute exposure to concentrated ambient particulate matter in rats. Toxicol Lett 96–97:285–8.
- Heckerman D. 2008. A Tutorial on Learning with Bayesian Networks. In: Holmes DE, Jain LC, eds. Innovations in Bayesian Networks: Theory and Applications. Berlin, Heidelberg: Springer Berlin Heidelberg, 33–82.
- Heringa MB, Geraets L, van Eijkeren JCH, Vandebriel RJ, de Jong WH, Oomen AG. 2016. Risk assessment of titanium dioxide nanoparticles via oral exposure, including toxicokinetic considerations. Nanotoxicology 10:1515–25.
- Hiramatsu K, Aoyama H, Zen Y, Aishima S, Kitagawa S, Nakanuma Y. 2006. Proposal of a new staging and grading system of the liver for primary biliary cirrhosis. Histopathology 49:466–78.
- Hristozov DR, Gottardo S, Critto A, Marcomini A. 2012. Risk assessment of engineered nanomaterials: a review of available data and approaches from a regulatory perspective. Nanotoxicology 6:880–98.
- Hristozov DR, Zabeo A, Foran C, Isigonis P, Critto A, Marcomini A, Linkov I. 2014. A weight of evidence approach for hazard screening of engineered nanomaterials. Nanotoxicology 8:72–87.
- Izak-Nau E, Huk A, Reidy B, Uggerud H, Vadset M, Eiden S, et al. 2015. Impact of storage conditions and storage time on silver nanoparticles' physicochemical properties and implications for their biological effects. RSC Adv 5:84172–85.
- Keisler J, Linkov I. 2014. Environment models and decisions. Environ Syst Decis 34:369–72.
- Kim KM, Choi MH, Lee JK, Jeong J, Kim YR, Kim MK, et al. 2014. Physicochemical properties of surface charge-modified ZnO nanoparticles with different particle sizes. Int J Nanomed 9:41–56.
- Kjærulff UB, Madsen AL. (2013). Sensitivity analysis. In: Bayesian networks and influence diagrams: A guide to construction and analysis. New York, NY: Springer New York. p. 303–25.
- Langseth H, Portinale L. 2007. Bayesian networks in reliability. Reliab Eng Syst Safe 92:92–108.
- Lauritzen SL. 1995. The EM algorithm for graphical association models with missing data. Comput Stat Data Anal 19:191–201.
- Lee CJ, Lee KJ. 2006. Application of Bayesian network to the probabilistic risk assessment of nuclear waste disposal. Reliab Eng Syst Safe 91:515–32.
- Linkov I, Anklam E, Collier ZA, DiMase D, Renn O. 2014. Risk-based standards: integrating top–down and bottom–up approaches. Environ Syst Decis 34:134–7.
- Linkov I, Massey O, Keisler J, Rusyn I, Hartung T. 2015. From “ "weight of evidence" to quantitative data integration using multicriteria decision analysis and Bayesian methods”. Altex 32:3–8.
- Linkov I, Welle P, Loney D, Tkachuk A, Canis L, Kim JB, Bridges T. 2011. Use of multicriteria decision analysis to support weight of evidence evaluation. Risk Analy 31:1211–25.
- Low-Kam C, Telesca D, Ji Z, Zhang H, Xia T, Zink JI, Nel AE. 2015. A Bayesian regression tree approach to identify the effect of nanoparticles' properties on toxicity profiles. Ann Appl Stat 9:383–401.
- Marcot BG, Steventon JD, Sutherland GD, McCann RK. 2006. Guidelines for developing and updating Bayesian belief networks applied to ecological modeling and conservation. Can J Forest Res 36:3063–74.
- Marvin HJP, Bouzembrak Y, Janssen EM, van der Fels-Klerx HJ, van Asselt ED, Kleter GA. 2016. A holistic approach to food safety risks: food fraud as an example. Food Res Int. 89:463–70.
- Money ES, Barton LE, Dawson J, Reckhow KH, Wiesner MR. 2014. Validation and sensitivity of the FINE Bayesian network for forecasting aquatic exposure to nano-silver. Sci Total Environ 473–474:685–91.
- Money ES, Reckhow KH, Wiesner MR. 2012. The use of Bayesian networks for nanoparticle risk forecasting: model formulation and baseline evaluation. Sci Total Environ 426:436–45.
- Morgan K. 2005. Development of a preliminary framework for informing the risk analysis and risk management of nanoparticles. Risk Anal 25:1621–35.
- Murphy F, Sheehan B, Mullins M, Bouwmeester H, Marvin HJP, Bouzembrak Y, et al. 2016. A tractable method for measuring nanomaterial risk using Bayesian networks. Nanoscale Res Lett 11:503.
- Nel A, Xia T, Meng H, Wang X, Lin S, Ji Z, Zhang H. 2013. Nanomaterial toxicity testing in the 21st century: use of a predictive toxicological approach and high-throughput screening. Acc Chem Res 46:607–21.
- Ng C-T, Li JJ, Bay B-H, Yung L-YL. 2010. Current studies into the genotoxic effects of nanomaterials. J Nucl Acids 2010:1–12.
- Nyberg JB, Marcot BG, Sulyma R. 2006. Using Bayesian belief networks in adaptive management. Can J For Res 36:3104–16.
- OECD. 2007. OECD guidline for the testing of chemicals: Developmental Neurotoxicity Study. Test no. 426, pp. 1–26.
- OECD. 2014. Report of the OECD expert meeting on the physical chemical properties of manufactured nanomaterials and test guidelines. OECD Environment, Health, and Safety Publications. Series on the safety of manufactured nanomaterials. 41:15.
- Oomen A, Bleeker E, Bos P, van Broekhuizen F, Gottardo S, Groenewold M, et al. 2015. Grouping and read-across approaches for risk assessment of nanomaterials. Int J Environ Res Public Health 12:13415.
- Ostraat ML, Thornburg JW, Malloy QGJ. 2013. Measurement strategies of airborne nanomaterials. Environ Eng Sci 30:126–32.
- Pollino CA, Woodberry O, Nicholson A, Korb K, Hart BT. 2007. Parameterisation and evaluation of a Bayesian network for use in an ecological risk assessment. Environ Model Softw 22:1140–52.
- Sessa S, D'Urso MG. 2014. Employment of Bayesian networks for risk assessment of excavation process in dense urban areas. Safety, Reliability, Risk and Life-Cycle Performance of Structures and Infrastructures. The Netherlands: CRC Press, 3163–3169.
- Singh KP, Gupta S. 2014. Nano-QSAR modeling for predicting biological activity of diverse nanomaterials. RSC Adv 4:13215–30.
- Sohn S, Larson DW, Habermann EB, Naessens JM, Alabbad JY, Liu H. 2016. Detection of clinically important colorectal surgical site infection using Bayesian network. J Surg Res 11:9–20.
- Stone V, Pozzi-Mucelli S, Tran L, Aschberger K, Sabella S, Vogel U, et al. 2014a. ITS-NANO – prioritising nanosafety research to develop a stakeholder driven intelligent testing strategy. Part Fibre Toxicol 11:9.
- Stone V, Pozzi-Mucelli S, Tran L, Aschberger K, Sabella S, Vogel U, et al. 2014b. ITS-NANO - Prioritising nanosafety research to develop a stakeholder driven intelligent testing strategy. Part Fibre Toxicol 11:1–12.
- Tantra R, Bouwmeester H, Bolea E, Rey-Castro C, David CA, Dogne JM, et al. 2016. Suitability of analytical methods to measure solubility for the purpose of nanoregulation. Nanotoxicology 10:173–84.
- Tervonen T, Lahdelma R, Almeida Dias J, Figueira J, Salminen P. 2007. SMAA-TRI. In: Linkov I, Kiker GA, Wenning RJ, eds. Environmental Security in Harbors and Coastal Areas: Management Using Comparative Risk Assessment and Multi-Criteria Decision Analysis. Dordrecht: Springer, the Netherlands, 217–231.
- WHO. 2012. Guidance for immunotoxicity risk assessment for chemicals. Harmonization Project Document No. 10:1–312.
- Wiesner MR, Bottero JY. 2011. A risk forecasting process for nanostructured materials, and nanomanufacturing. C R Phys 12:659–68.
- Wijnhoven SWP, Peijnenburg WJGM, Herberts CA, Hagens WI, Oomen AG, Heugens EHW, et al. 2009. Nano-silver – a review of available data and knowledge gaps in human and environmental risk assessment. Nanotoxicology 3:109–38.
- Winkler DA, Burden FR, Yan B, Weissleder R, Tassa C, Shaw S, Epa VC. 2014. Modelling and predicting the biological effects of nanomaterials. SAR QSAR Environ Res 25:161–72.
- Zarei E, Azadeh A, Khakzad N, Mohammadfam I. 2016. Dynamic safety assessment of natural gas stations using Bayesian network. J Hazard Mater 321:830–40.