
Abstract
This study investigated the role of nanoparticle size and surface chemistry on biocorona composition and its effect on uptake, toxicity and cellular responses in human umbilical vein endothelial cells (HUVEC), employing 40 and 80 nm gold nanoparticles (AuNP) with branched polyethyleneimine (BPEI), lipoic acid (LA) and polyethylene glycol (PEG) coatings. Proteomic analysis identified 59 hard corona proteins among the various AuNP, revealing largely surface chemistry-dependent signature adsorbomes exhibiting human serum albumin (HSA) abundance. Size distribution analysis revealed the relative instability and aggregation inducing potential of bare and corona-bound BPEI-AuNP, over LA- and PEG-AuNP. Circular dichroism analysis showed surface chemistry-dependent conformational changes of proteins binding to AuNP. Time-dependent uptake of bare, plasma corona (PC) and HSA corona-bound AuNP (HSA-AuNP) showed significant reduction in uptake with PC formation. Cell viability studies demonstrated dose-dependent toxicity of BPEI-AuNP. Transcriptional profiling studies revealed 126 genes, from 13 biological pathways, to be differentially regulated by 40 nm bare and PC-bound BPEI-AuNP (PC-BPEI-AuNP). Furthermore, PC formation relieved the toxicity of cationic BPEI-AuNP by modulating expression of genes involved in DNA damage and repair, heat shock response, mitochondrial energy metabolism, oxidative stress and antioxidant response, and ER stress and unfolded protein response cascades, which were aberrantly expressed in bare BPEI-AuNP-treated cells. NP surface chemistry is shown to play the dominant role over size in determining the biocorona composition, which in turn modulates cell uptake, and biological responses, consequently defining the potential safety and efficacy of nanoformulations.
Introduction
Drug delivery employing nanocarriers has revolutionized the field of cancer medicine by substantially improving the solubility, bioavailability and therapeutic indices of their payloads. Numerous nanoformulations are currently under advanced-stage clinical trials or are being used in clinical settings (Pearson et al., Citation2014; Riehemann et al., Citation2009; Seigneuric et al., Citation2010; Sengupta & Kulkarni, Citation2013; van der Meel et al., Citation2013; Zuo et al., Citation2007). Although formidable progress has been achieved, challenges related to nanoparticle (NP) instability, unfavorable pharmacokinetics, premature clearance and lack of selective tumor accumulation, have hindered their clinical translation (Davis, Citation2009; Hubbell & Langer, Citation2013; van der Meel et al., Citation2013). The interface between nanomaterials and the physiological environment has been the greatest barrier for effective nano-biomedical applications (Pearson et al., Citation2014; Tenzer et al., Citation2013). Extensive research suggests that NP upon entry into the physiological setting, instantaneously adsorb proteins and other biomolecules, to form a robust layer described as the biocorona (Lynch et al., Citation2007; Nel et al., Citation2009; Pearson et al., Citation2014; Vroman et al., Citation1980). This alters their native “synthetic identity” including size, shape, surface charge and stability, and confers them with a new “biological identity”, affecting their cellular internalization, cellular responses and eventually, biodistribution profiles (Aggarwal et al., Citation2009; Monopoli et al., Citation2012; Walkey & Chan, Citation2012). This challenges the assumption that NP “synthetic identity” defines their biological activity in the body. Hence, biocorona with its constituents formed at the nano-bio interface determines how cells or tissues recognize them, which dictates their ultimate biological impact and fate in vivo (Karmali et al., Citation2011). A predominance of opsonins in the corona promotes immune system recognition leading to rapid clearance of NP from the circulation, whereas, dysopsonins reduces complement activation, evades phagocytosis, prolongs circulation times and reduces toxicity (Lynch et al., Citation2007; Pearson et al., Citation2014; Ritz et al., Citation2015). Protein adsorption over NP occurs mainly due to: (i) an increase in the collective entropy of proteins on the NP surface and (ii) nonspecific interactions between the NP surface and proteins (Lundqvist et al., Citation2008; Monopoli et al., Citation2011; Podila et al., Citation2012; Walkey et al., Citation2012). In short, formation of a biocorona depends largely on the physicochemical characteristics of NP, and the environment NP is introduced to. Various parameters including size, shape, curvature, and surface chemistry can affect the composition, thickness and conformation of a biocorona (Lundqvist et al., Citation2008; Mahmoudi et al., Citation2011; Monopoli et al., Citation2011; Rahman et al., Citation2013; Walczyk et al., Citation2010). The role of NP physicochemical properties in modulating corona formation has been recognized, but the understanding of its effect on intracellular uptake, associated toxicity and gene expression is limited, which are crucial factors determining the success of nanoformulations intended for drug delivery.
Of the myriad of NP, AuNPs exhibit unique physical, chemical, and opto-electronic properties that provide a highly multifunctional platform suitable for a multitude of applications including bioimaging, targeted drug delivery, drug sensitization and photothermal therapy (Dreaden et al., Citation2012; Loo et al., Citation2004; Sasidharan & Monteiro-Riviere, Citation2015; Xia & Xia, Citation2014). Several studies investigated the role of either size, surface chemistry or the presence of a protein corona on cell uptake of AuNP (Cheng et al., Citation2015; Choi et al., Citation2017; Freese et al., Citation2012; Klingberg et al., Citation2015; Klingberg et al., Citation2015; Li & Monteiro-Riviere, Citation2016; Mirsadeghi et al., Citation2015; Monteiro-Riviere et al., Citation2013; Sasidharan et al., Citation2015, Citation2016). However, there is lack of information on the definite links between the NP physicochemical properties, signature biocorona adsorbomes, cell uptake patterns, toxicity and gene expression profiles. Hence, the goal of the present study was to evaluate (i) the role of AuNP physicochemical properties on corona composition, (ii) effect of biocorona on the cellular uptake profiles and (iii) define and compare possible cytotoxicity and related mechanistic pathways impacted by bare and corona-bound AuNP, with 40 nm and 80 nm AuNP with three surface coatings – cationic BPEI, anionic LA, and neutral PEG – in primary HUVEC. Considering the fact that most nanomedicines are proposed for intravenous (IV) administration, endothelial cells form the primary barrier between the circulating NP and target tissues, and thus, HUVEC which mimics the blood vessel lining cells was selected to study AuNP cell uptake, cytotoxicity and gene expression profiles.
Methods
Nanoparticles
Biopure™ 40 and 80 nm BPEI-, LA- and PEG-AuNP (1 mg/ml in Milli-Q water) were obtained from nanoComposix (San Diego, CA). Particle size, polydispersity index, zeta potential and spectral properties were characterized using dynamic light scattering (DLS), transmission electron microscopy (TEM) and UV-Vis spectroscopy; 40 and 80 nm core AuNP were synthesized by the reduction of hydrogen tetrachloroaurate (III) in a basic solution of potassium carbonate. The synthesized AuNP were then concentrated and washed using tangential flow filtration (TFF). LA functionalized surfaces were fabricated by the addition of reduced LA at a mass ratio of 0.2 mg of LA per mg of Au. PEG functionalization was performed by the addition of 5 kDa thiol-methoxy-terminated PEG (Laysan Bio Inc., Arab, AL) at a mass ratio of 0.5 mg of PEG per mg of Au. BPEI surfaces were obtained by using EDC-coupling chemistry to link the carboxyl group of the LA to free amines on the BPEI. After each surface functionalization, AuNPs were washed using TFF and sterile filtered. The BPEI-capped AuNP were centrifuged additionally after TFF to remove any unbound BPEI. Upon arrival, all NP were stored at 4 °C in the dark.
Biocorona formation, protein separation and identification
250 μg/ml of 40 nm and 80 nm BPEI-, LA- and PEG-AuNP were incubated in 55% v/v human blood plasma or 44 mg/ml HSA at 37 °C under constant agitation at 250 rpm, for corona formation. After incubation, the unbound and weakly associated soft corona proteins were removed by repeated washes with phosphate-buffered saline (PBS) at 20,000×g for 30 min at 20 °C. After the washes, the PC-bound AuNP pellets were resuspended in lysis buffer for gel electrophoresis or resuspended in Endothelial Growth Medium-2 (EGM-2) to a final concentration of 25 μg/ml prior to exposure to cells for the uptake experiments. Gel electrophoresis (Supplementary Figure S1) and mass spectrometry including data processing were performed as previously described (Nesvizhskii et al., Citation2003).
Size distribution and circular dichroism (CD) analysis
All 40 and 80 nm bare, PC-bound AuNP and HSA-bound AuNP were resuspended in 2 ml of EGM-2 at a final concentration of 25 μg/ml and incubated at 37 °C, without shaking, to mimic cell culture conditions. In these experiments, “bare” implies the absence of a bound PC; however, BPEI, LA and PEG surface coatings are present. Samples were taken at 0, 0.25, 0.5, 1, 3, 6, 12 and 24 h for DLS measurements. For CD analysis, AuNP were added in small aliquots of stock gold solutions to 1 mg/ml HSA and the spectra were recorded from 190 to 260 nm (Supplementary Figure S5).
Quantification of cell uptake using inductively coupled plasma mass spectrometry (ICP-MS)
HUVEC (Lonza, Walkersville, MD) were seeded at 2.5 × 10⁵ cells in 6-well plates, and treated with 25 μg/ml of 40 and 80 nm bare, PC-bound AuNP and HSA-bound AuNP for 0.25, 0.5, 1, 3, 6, 12 and 24 h (n = 3). An etching step was incorporated into the protocol to remove membrane-bound AuNP and NP sticking to the wells, as reported (Cho et al., Citation2009). Samples were dried, digested using aqua regia and intracellular Au concentrations were quantified using ICP-MS.
Visualization of internalized AuNP
For hyperspectral imaging (HSI), HUVEC were seeded on coverslips placed in 12-well plates and treated with 25 μg/ml AuNP for 1, 6 and 12 h. Cells were fixed and mounted onto glass slides and viewed using an enhanced dark field transmission optical microscope equipped with a HSI spectrophotometer. For TEM imaging, HUVEC were treated with 25 μg/ml bare and PC bound AuNP for 6 h and processed to eventually obtain thin sections which were placed on 200 mesh copper grids and viewed unstained on a TEM operating at 80 kV.
Cell culture and assessment of viability and AuNP toxicity mechanisms
Pooled HUVEC were purchased and cultured in EGM-2 supplemented with growth factors, cytokines, and supplements and maintained in a humidified environment with 5% CO2 at 37 °C. For viability studies, 1 × 10⁴ HUVEC were seeded in 96-black well clear flat bottom plates and exposed to 0, 12.5, 25, 37.5, 50, 62.5, 75, 87.5 and 100 μg/ml of 40 and 80 nm BPEI-, LA- and PEG-AuNP for 24 h (n = 6). Viability was assessed by alamarBlue® assay after 24 h (Monteiro-Riviere et al., Citation2009; Samberg et al., Citation2010). For the Human Molecular Toxicology PathwayFinder array studies, 5 × 10⁵ HUVEC treated with 25 μg/ml and 75.44 μg/ml 40 nm bare and PC-bound BPEI-AuNP for 24 h were harvested, RNA isolated and purified. RNA quality and concentrations were assessed. One microgram RNA was used for real-time PCR experiments. RNA was transcribed to complementary DNA. Six genes showing 2-fold change were chosen for qPCR validation. Gene level was normalized to GAPDH, and its relative quantification performed as RT2-PCR array. Primer sequences are summarized in Supplementary Table S3.
Statistical analysis
Data are represented as the mean ± standard deviation between replicates in each experiment. Student’s t-test was used to compare between samples where values with p < 0.05 were considered significant from controls and marked with an asterisk. Median lethal concentrations (LC50) and statistical analysis were performed using Origin Pro, Version 8.0. (OriginLab Corp., Northampton, MA).
Detailed experimental methods are provided in the Supplementary Material.
Results
Physicochemical characterization of AuNP
BPEI, LA and PEG functionalized AuNP without PC or HSA corona will be referred to as “bare AuNP” and, BPEI-, LA- and PEG-AuNP covered with either PC or HSA corona will be referred to as “corona bound AuNP” throughout the text. AuNP were stable colloids, with no sedimentation or agglomeration during the entire study period under storage at 4 °C. AuNP were characterized using DLS, zeta potential measurements, TEM and UV-Vis spectrophotometry (). provides the physicochemical characterization data of AuNP. Intensity-weighted average particle hydrodynamic diameter (Z-avg) and surface charge analysis of all AuNP in Milli-Q water, and EGM-2 media at t = 0 min were determined. UV-Vis spectra () showed absorbance maxima of 530 nm for 40 nm AuNP and 550 nm for 80 nm AuNP, depicting their characteristic size-dependent surface plasmon resonance (SPR) wavelengths.
Figure 1. Transmission electron micrographs and corresponding dynamic light scattering data of bare 40 nm (A) BPEI-AuNP, (B) LA-AuNP, (C) PEG-AuNP, and bare 80 nm (D) BPEI-AuNP, (E) LA-AuNP, and (F) PEG-AuNP. (G) UV-Vis spectra showing characteristic surface plasmon resonance absorbance maxima for 40 and 80 nm AuNP at ∼530 and ∼550 nm, respectively. Bare: no corona; BPEI: branched polyethyleneimine; AuNP: gold nanoparticles; LA: lipoic acid; PEG: polyethylene glycol.
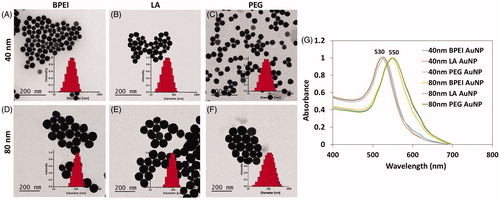
Table 1. Size and zeta potential analysis of 40 and 80 nm bare BPEI, LA and PEG-AuNP in deionized (DI) water and HUVEC media, EGM-2 at t = 0 min.
Interestingly, hydrodynamic diameters of all AuNP increased upon redispersion in EGM-2, HUVEC culture media. The Z-avg of 40 and 80 nm BPEI-AuNP showed a significant increase by ∼279 nm and ∼211 nm, respectively, suggestive of enhanced electrostatic interactions between positively charged NP surface and negatively charged proteins; 40 and 80 nm LA-AuNP showed relatively less increase by ∼19 nm and ∼67 nm, respectively. Forty nanometer PEG-AuNP did not show a significant increase in the Z-avg (<1 nm), whereas 80 nm PEG-AuNP showed an increase in ∼21 nm. This effect was also reflected in the net surface charge, wherein all AuNP, irrespective of surface chemistry, registered a zeta potential in the range of −1 to −9 mV similar to what was observed for the protein solutions.
Characterization of the AuNP adsorbomes
Hard corona protein profiles of AuNP associated with different surface functionalizations were investigated using one-dimensional sodium dodecyl sulfate polyacrylamide gel electrophoresis (SDS-PAGE) and label-free quantitative liquid chromatography mass spectrometry (LFQ-LC-MS). Supplementary Figure S1A and B provides a direct comparison of the soft corona profiles, obtained by retrieving proteins from NP surface after first and second washes, and resilient hard corona proteins, after the third wash. Lanes B40-1 & 2, L40-1 & 2, P40-1 & 2 (Supplementary Figure S1A), and lanes B80-1 & 2, L80-1 & 2 and P80-1 & 2 (Supplementary Figure S1B) represents the weakly associated soft corona protein constituents of 40 and 80 nm AuNP adsorbomes, respectively. More than 80% of soft corona proteins were removed by the second PBS wash, and only the hard corona protein components remained adhered to the AuNP after third wash.
Proteomic analysis by LFQ-LC-MS identified 59 different hard corona protein species among the six different PC-AuNP, wherein 39, 54 and 51 proteins were found on adsorbome of 40 nm BPEI-, LA- and PEG-AuNP, and 36, 54 and 54 on 80 nm BPEI-, LA- and PEG-AuNP, respectively. Total spectral count weighted protein quantitation revealed size dependency in protein binding, wherein 80 nm AuNP exhibited greater protein abundance than 40 nm AuNP (Supplementary Table S1). Of all AuNP, 40 nm PEG-AuNP bound the least number of proteins, and 80 nm LA-AuNP bound the most (Supplementary Table S1). LA-AuNP showed comparatively higher protein binding. Notably, BPEI-AuNP in spite of being cationic and expected to attract more proteins to their surface, bound fewer proteins. shows the top 20 most abundant proteins in the AuNP coronas. Irrespective of size or surface chemistry, HSA was found to be the most abundant protein present in all AuNP samples (). Levels of apolipoprotein A were similar between the AuNP, suggesting that neither size nor surface charge played a determining role for binding of these proteins. Immunoglobulins formed 11–12% of the BPEI corona showing a slight preference to a cationic surface, compared to LA (5–7%) or PEG (6–9%) AuNP. BPEI-AuNP exhibited a distinct adsorbome from LA- and PEG-AuNP, with fibrinogen constituting the second major component of BPEI corona, along with a set of proteins related to the coagulation cascade (plasminogen, platelet glycoprotein Ib beta chain and prothrombin). BPEI corona also showed depletion of high molecular weight proteins (>100 kDa) associated with cell adhesion, as well as cytoskeleton components including talin-1, filamin-A, myosin-9, vinculin and integrins. Interestingly, cytoskeletal proteins (>100 kDa) formed the second major constituent of both LA and PEG coronas, with depletion of coagulation proteins. Forty nanometer PEG-AuNP showed a significant reduction in bound proteins compared to 80 nm PEG-AuNP (Supplementary Table S1).
Table 2. Top 20 most abundant hard corona proteins out of 59, detected in the adsorbomes of 40 and 80 nm BPEI, LA and PEG-AuNP after exposure to 55% pooled human plasma for 1 h.
Size distribution analysis
Assessing the size distribution and dispersity of the AuNP–corona complexes, 40 and 80 nm bare, PC-BPEI-AuNP and HSA-BPEI-AuNP exhibited agglomeration and major variations in hydrodynamic size distribution, evident from multiple peaks in the range of 10 nm to 1 μm suggesting that BPEI-AuNP were highly unstable in media (Supplementary Figures S2–S4). Both 40 and 80 nm bare, PC and HSA corona-bound LA- and PEG-AuNP exhibited good stability and narrow size distributions in suspension. Even though adsorbed plasma decreased the absolute charge of corona bound AuNP (−1 to −9 mV), all NP except 40 and 80 nm BPEI-AuNP solutions remained stable as evident from the hydrodynamic size distributions.
Circular dichroism
CD analysis detected all AuNP to induce varying levels of conformational changes to the ordered, predominantly α-helical (∼67%) secondary structure of HSA. Supplementary Figure S5 shows CD spectra of HSA, in the absence and presence of 40 and 80 nm BPEI-, LA- and PEG-AuNP. The effect of cationic 40 and 80 nm BPEI-AuNP on the α-helix structure of HSA was most apparent from the occurrence of β structure-related peak maxima at 220 nm. Even though 40 and 80 nm LA- and PEG-AuNP showed variations, they closely followed the spectral pattern of helical conformation.
Intracellular uptake
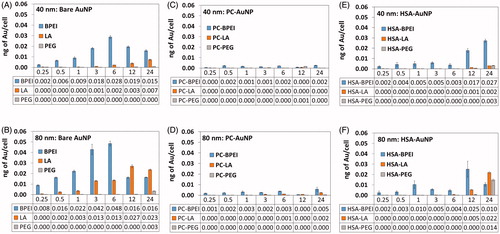
Time-dependent intracellular uptake patterns of AuNP in HUVEC generally revealed size and surface chemistry-dependent uptake patterns, wherein 80 nm AuNP showed a greater amount of intracellular Au compared to 40 nm AuNP, and BPEI-AuNP showed the highest uptake, followed by LA- and PEG-AuNP (). Interestingly, bare BPEI-AuNP showed a time-dependent increase in amount of Au within cells up to 6 h, which then dropped to maintain numbers similar to the 3 h. Remarkably, all PC-AuNP exhibited a significant reduction in cell uptake compared to their bare counterparts (). Compared to PC-AuNP, HSA-AuNP showed enhanced uptake (). Uptake of 40 nm HSA-BPEI-AuNP at 24 h was almost comparable to that of bare 40 nm BPEI-AuNP at 6 h. A surprising observation was that both 40 and 80 nm HSA-PEG-AuNP showed greater uptake than bare PEG-AuNP.
Figure 2. Time-dependent intracellular uptake of (A) 40 nm bare AuNP, (B) 80 nm bare AuNP, (C) 40 nm PC-AuNP, (D) 80 nm PC-AuNP, (E) 40 nm HSA-AuNP, and (F) 80 nm HSA-AuNP at 0.25, 0.5, 1, 3, 6, 12 and 24 h in human umbilical vein endothelial cells. Data represented as mean ± SD (n = 3). Bare: no corona; AuNP: gold nanoparticles; PC: plasma corona; HSA: human serum albumin; BPEI: branched polyethyleneimine; LA: lipoic acid; PEG: polyethylene glycol.
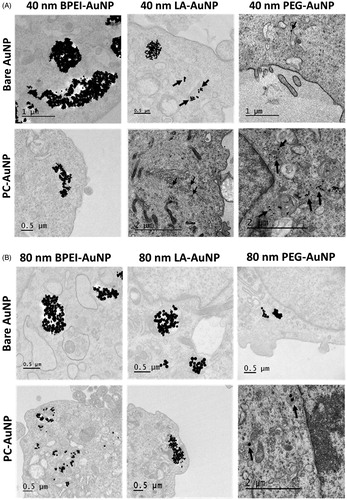
Hyperspectral imaging (HSI) and TEM validated the reduced intracellular uptake of corona bound AuNP, compared to its bare counterpart. Since the intracellular AuNP numbers were too low for LA- and PEG-AuNP, a conclusive comparative study was not possible; therefore, the analysis was conducted with 40 and 80 nm BPEI-AuNP alone. represents the time-dependent uptake of 40 nm bare, PC-BPEI-AuNP and HSA-BPEI-AuNP in HUVEC at 1, 6 and 24 h clearly showing a decrease in number of intracellular PC-BPEI-AuNP compared to bare and HSA-BPEI-AuNP counterparts. Optical, HSI and spectral angle mapping (SAM) images were obtained for all time points. Spectral plots () were obtained from the HSI, where AuNP showed high-intensity peaks, compared to the extracellular and intracellular backgrounds. Although significant corona-dependent peak shifts were not observed in the hyperspectral plots of AuNP, minor variations were present, possibly due to the effect of the surrounding dielectric medium upon protein coating, in the range of ∼5–10 nm. SAM images were mapped on to HSI, by taking reference from the spectral library collected from 40 nm BPEI-AuNP alone (), which accurately mapped AuNP associated with the cells. shows HSI of 40 nm bare BPEI-AuNP, green spots representing discrete BPEI-AuNP and bright yellow/white/red spots depicting aggregated NP. Similarly, depicts representative time-dependent uptake of 80 nm bare, PC-BPEI-AuNP and HSA-BPEI-AuNP in HUVEC. 80 nm bare BPEI-AuNP showed the highest uptake, followed by HSA-BPEI-AuNP and PC-BPEI-AuNP visually confirming an overall reduction of AuNP uptake with the coronas, and mostly with PC-AuNP. shows the TEM micrographs of 40 and 80 nm bare and PC-AuNP-treated HUVEC depicting intracellular location and distribution of AuNP within cytoplasmic vacuoles at 6 h. This time point was selected based on the quantitative uptake results showing the greatest number of intracellular bare BPEI-AuNP (). At this time point, all bare AuNP were found as aggregates within cytoplasmic vacuoles.
Figure 3. Representative optical images (upper panel, where AuNP appear yellow), hyperspectral imaging (HSI) (middle panel, where AuNP appear white), and spectral angle mapping (SAM) images (bottom panel, where the mapped AuNP appear as red spots) of nonlabelled 40 nm (A) bare BPEI-AuNP (B) PC-BPEI-AuNP, and (C) HSA-BPEI-AuNP in human umbilical vein endothelial cells. Corresponding representative spectral plots of 40 nm (D) bare BPEI-AuNP (E) PC-BPEI-AuNP and (F) HSA-BPEI-AuNP. SAM of 40 nm bare, PC-BPEI-AuNP and HSA-BPEI-AuNP were performed with reference to the spectral library obtained from (G) HSI of 40nm BPEI-AuNP (without cells). In (G) green spots represents discrete AuNP and bright yellow/white/red spots represents aggregated NP. Scale bar: 10 μm. Bare: no corona; BPEI: branched polyethyleneimine; AuNP: gold nanoparticles; PC: plasma corona; HSA: human serum albumin.
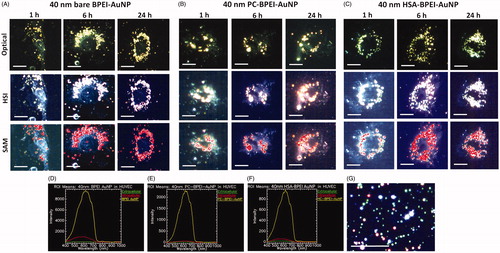
Figure 4. Representative optical images (upper panel, where AuNP appear yellow), hyperspectral imaging (HSI) (middle panel, where AuNP appear white) and spectral angle mapping (SAM) images (bottom panel, where the mapped AuNP appear as red spots) of nonlabelled 80 nm (A) bare BPEI-AuNP (B) PC-BPEI-AuNP and (C) HSA-BPEI-AuNP in human umbilical vein endothelial cells. Corresponding representative spectral plots of 80 nm (D) bare BPEI-AuNP (E) PC-BPEI-AuNP and (F) HSA-BPEI-AuNP. SAM of 80 nm bare, PC-BPEI-AuNP and HSA-BPEI-AuNP were performed with reference to the spectral library obtained from (G) HSI of 80 nm BPEI-AuNP (without cells). In (G), green spots represents discrete AuNP and bright yellow/white/red spots represents aggregated NP. Scale bar: 10 μm. Bare: no corona; BPEI: branched polyethyleneimine; AuNP: gold nanoparticles; PC: plasma corona; HSA: human serum albumin.
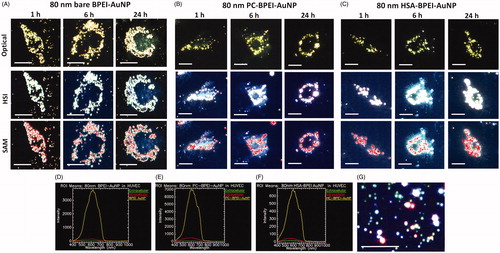
Figure 5. High contrast transmission electron micrographs of (A) 40 and (B) 80 nm bare and PC-AuNP depicting location and aggregation of BPEI, LA and PEG-AuNP within intracytoplasmic vacuoles of human umbilical vein endothelial cells, after 6 h. AuNP within vacuoles are shown by black arrows. Bare: no corona; PC: plasma corona; AuNP: gold nanoparticles; BPEI: branched polyethyleneimine; LA: lipoic acid; PEG: polyethylene glycol.
Cell viability
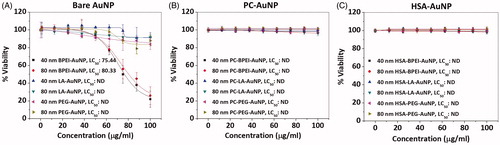
Cell viability was performed to determine the toxicity profiles of bare (without the corona) and corona-bound AuNP in HUVEC for 24 h. Bare 40 and 80 nm BPEI-AuNP exhibited dose-dependent toxicity with LC50 values of 75.44 μg/ml and 80.33 μg/ml for 40 and 80 nm NP, respectively (). All other AuNP remained less toxic up to 100 μg/ml (). Remarkably, both 40 and 80 nm PC-AuNP and HSA-AuNP exhibited ∼100% cell viability up to 100 μg/ml (). Hence, LC50 could not be determined for PC-AuNP and HSA-AuNP in the given dose range.
Figure 6. Cell viability data of human umbilical vein endothelial cells treated with 40 and 80 nm (A) bare AuNP (B) PC-AuNP (C) HSA-AuNP. Data represented as mean ± SD (n = 6). LC50: median lethal concentration, ND: not detected in the given dose range. Bare: no corona; AuNP: gold nanoparticles; PC: plasma corona; HSA: human serum albumin; BPEI: branched polyethyleneimine; LA: lipoic acid; PEG: polyethylene glycol.
Transcriptional profiling studies
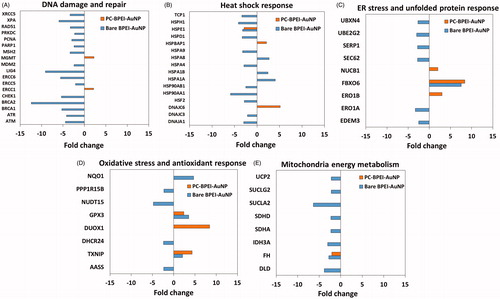
Since 40 nm bare BPEI-AuNP demonstrated the most reduction in cell viability over 24 h (), 40 nm bare and PC-BPEI AuNP was selected as the representative AuNP to explore HUVEC gene expression profiles to determine the underlying mechanisms of toxicity and cellular responses. The Human Molecular Toxicology PathwayFinder RT2 Profiler™ PCR Array, which provides information on the expression of 370 key genes in 13 different biological pathways, was employed for differential gene expression profiling. The 13 pathways involved were apoptosis, necrosis, DNA damage and repair, mitochondrial energy metabolism, fatty acid metabolism, oxidative stress and antioxidant response, heat shock response, ER stress and unfolded protein response, cytochrome P450s and Phase I metabolism, steatosis, cholestasis, phospholipidosis and immunotoxicity. HUVEC were treated with bare and PC-BPEI-AuNP for 24 h, at two concentrations – (i) 25 μg/ml (nontoxic dose) used for uptake studies and (ii) 75.44 μg/ml (toxic dose; LC50). Transcriptional profiling studies revealed 126 genes from 13 biological pathways to be differentially regulated by 40 nm bare and PC-BPEI-AuNP (Supplementary Table S2). At 25 μg/ml, bare BPEI-AuNP showed downregulation of 27 genes, and upregulation of three genes, including eight DNA damage and repair genes (8 out of 30 = 27%) and six heat shock response genes (6 out of 30 = 20%). At 75.44 μg/ml, the numbers increased to 66 downregulated genes and 14 upregulated genes, including 16 DNA damage and repair genes (16 out of 80 = 20%), 14 heat shock response genes (14 out of 80 = 18%) and 8 mitochondrial energy metabolism genes (8 out of 80 = 10%). Other major pathways affected by bare BPEI-AuNP included oxidative stress (7 out of 80 = 9%) and ER stress and unfolded protein response (7 out of 80 = 9%), indicative of potential interference with the antioxidant response and protein synthesis mechanisms, respectively. In contrast, PC-BPEI-AuNP at 25 μg/ml exhibited alteration of only four out of 126 genes, compared to 30 genes by bare BPEI-AuNP. At 75.44 μg/ml, compared to bare BPEI-AuNP altering the expression of 80 genes, PC-BPEI-AuNP considerably reduced the numbers to 49 genes. shows the comparative effect of toxic dose of 75.44 μg/ml 40 nm bare BPEI-AuNP and PC-BPEI-AuNP on genes involved in DNA damage and repair, heat shock response, ER stress and unfolded protein response, oxidative stress and antioxidant response and mitochondria energy, indicating that corona formation reduced the toxicity of bare BPEI-AuNP. However, 75.44 μg/ml PC-BPEI-AuNP showed changes in genes involved in phospholipidosis (10 out of 49 = 20%), apoptosis (7 out of 49 = 14%), immunotoxicity (6 out of 49 = 12%) and cholestasis (5 out of 49 = 10%) pathways. To verify gene expression from the PCR array, six genes were chosen for qPCR validation, which were differently expressed in the 40 nm bare and PC-BPEI-AuNP-treated HUVEC. Transcriptional profiles were consistent with those in Supplementary Table S2 (Supplementary Table S3).
Figure 7. Representative genes involved in (A) DNA damage and repair, (B) heat shock response, (C) ER stress and unfolded protein response, (D) oxidative stress and antioxidant response and (E) mitochondria energy metabolism pathways upon treatment with 75.44 μg/ml (toxic dose) 40 nm bare BPEI-AuNP and PC-BPEI-AuNP for 24 h. Data shown having fold change < −2 and >2 at p < 0.05. Bare: no corona; BPEI: branched polyethyleneimine; AuNP: gold nanoparticles; PC: plasma corona.
Discussion
Comprehensive characterization of the NP biomolecular corona may be the key to predicting nanoparticle risk, impacting cellular uptake and biodistribution profiles. Proteins involved in the physiological as well as toxicological relevant processes in blood, such as complement activation and coagulation have been identified in coronas of various NP (Docter et al., Citation2015; Walkey et al., Citation2012). Human plasma comprising 55% of the blood volume was used for biocorona studies, since it is more representative of the physiological fluid than serum, which lacks clotting factors and fibrinogen (Mirshafiee et al., Citation2016). Consistent with our data, existing literature on corona proteins over AuNP have identified albumin, apolipoprotein, immunoglobulins, complement and fibrinogen as the most abundantly bound species (Karmali & Simberg, Citation2011; Lacerda et al., Citation2010; Nel et al., Citation2009). However, these studies do not provide conclusive information regarding surface charge-dependent affinity of specific plasma proteins toward AuNP. Proteomic analysis by LFQ-LC-MS revealed primarily surface coating dependent differences in individual protein profiles. Irrespective of size, or surface chemistry, HSA was found to be the most abundant protein present in all AuNP samples. Cationic BPEI-AuNP revealed an adsorbome distinct from anionic LA- and neutral PEG-AuNP, exhibiting fibrinogen abundance in their corona, next to HSA. Fibrinogen comprised of α, β and γ chains, exhibits an elongated rod-like conformation with unique molecular dimensions (6 × 6 × 45 nm) and is responsible for regulating hemostasis and inflammatory response (Mosesson, Citation2005; Sasidharan & Monteiro-Riviere, Citation2015). Deng and coworkers had demonstrated that fibrinogen bound with high affinity to AuNP with positively and negatively charged surface coatings (Deng et al., Citation2011, Citation2013). The present study revealed the specific fibrinogen abundance in BPEI-AuNP coronas to be ∼4X times greater than LA-AuNP and ∼5X times greater than PEG-AuNP coronas, implying an affinity of fibrinogen for cationic surfaces (Supplementary Table S1). Interestingly, both LA- and PEG-AuNP revealed similar protein corona signatures despite differences in surface charge, suggesting other forces may be dominant (Xia et al., Citation2010). However, despite its strong cationic nature, BPEI-AuNP revealed comparatively lower protein abundance, which could be possibly explained by fibrinogen abundance and its anchorage in BPEI-AuNP corona. One could speculate that fibrinogen might have bound to the AuNP in a vertical orientation (perpendicular to AuNP surface), rather than horizontally (parallel to AuNP surface), causing it to stick out from the BPEI-AuNP surface, and thereby reducing subsequent protein binding through steric hindrance. Another important observation was that despite the well-established fact that PEG coatings evade protein adsorption, 40 nm PEG-AuNP showed a significant reduction in bound proteins compared to 80 nm PEG-AuNP. It could be assumed that 5 kDa PEG coating over 40 nm PEG-AuNP was effective enough to reduce protein binding, whereas, the same was not effective for 80 nm PEG-AuNP.
CD analysis performed to detect conformational changes to the primary corona component, HSA, revealed all bare AuNP to induce varying levels of changes to the protein secondary structure. Interestingly, the effect of BPEI-AuNP was more evident possibly resulting from positive charge repulsion induced on the protein by a cationic environment (herein bare BPEI-AuNP), resulting in the formation of extended, folded or unfolded tracts that easily interact, giving rise to β structures by intermolecular hydrogen bonding and also contribute to aggregation (Bramanti & Benedetti, Citation1996). Considering the size distribution data, bare and corona-bound BPEI-AuNP were found to be highly unstable and formed aggregates in culture media, and this adsorption-induced conformational change of adsorbed proteins could also be a probable aggregation mechanism of BPEI-AuNP.
Intracellular uptake is a crucial determinant for optimal results in targeted delivery, as well as toxicity, where biocorona has a major impact, and the distinct adsorbomes could predict uptake patterns. Considering the fact that it is practically impossible to perform in vitro uptake studies of bare NP due to the exhaustive list of proteins and other biomolecules in culture media, in the present study, the formation of a biocorona over the AuNP, from media components, is firmly acknowledged. It should also be noted that studies claiming to perform uptake studies in serum-free conditions to maintain the theoretical “bare NP” condition possibly overlook the above fact. The inevitable corona formation has ruled out the theoretical hypothesis that surface charge of bare NP determines cell uptake, by mostly presenting a net negative charge to the cells, where eventually the corona components promote or modulate NP internalization. However, the thickness and extent of coverage of the biocorona over the NP also plays a crucial factor. In the present study, size and surface chemistry-dependent uptake was generally observed for both bare- and corona-bound AuNP, wherein 80 nm AuNP showed higher uptake over 40 nm AuNP, and BPEI-AuNP showed highest uptake followed by LA and PEG-AuNP. One could speculate that despite the net negative charge (from biocorona formation from media components, PC or HSA corona), the observed surface chemistry dependent uptake of AuNP could be attributed to the above stated thickness and coverage of the biocorona layer over the AuNP. The PC-AuNP and HSA-AuNP were washed thrice to specifically retain the high-affinity hard corona layer alone. Unlike the dynamic, thick soft corona cloud comprising a multitude of low-affinity proteins, the hard corona is considered to be a thin layer of proteins. Hence, the BPEI-, LA- and PEG ligands would have gained access to interact with cells thereby influencing cell uptake.
Interestingly, in the case of bare 40 and 80 nm BPEI-AuNP, time-dependent increase in the amount of Au per cell increased up to 6 h, which then dropped and maintained an amount very similar to 3-h time point. This pattern is in line with reported literature suggesting exocytosis triggered by saturation of intracellular Au load to achieve equilibrium (Stayton et al., Citation2009). However, LA- and PEG-AuNP exhibited a time-dependent uptake of AuNP up to 24 h, without any numerical indications of exocytosis, possibly due to the intracellular Au load not reaching saturation threshold. Assessing the overall uptake of corona bound AuNP, HSA-AuNP showed greater uptake than PC-AuNP. These results indicated that a simple, HSA corona significantly increased the uptake of AuNP more than a complex, plasma corona. HSA is considered a dysopsonin in vivo, which prevents opsonization, and thought to reduce reticuloendothelial cell phagocytosis, which is not relevant in this in vitro system; and in fact resulted in greater uptake of HSA-AuNP compared to multi-component PC-AuNP. Although, the formation of a single-protein component corona does not occur in the systemic circulation, the objective was to obtain an understanding on the impact of the most abundant corona component, here HSA, in determining the uptake of AuNP by endothelial cells. Notably, in spite of being the most prominent hard corona protein in all PC-AuNP, HSA did not contribute to enhanced uptake of PC-AuNP, as in the case of HSA-AuNP. It could be speculated that abundance of a single protein within the biocorona alone does not determine cell uptake, but rather is orchestrated by the interplay between corona constituents, conformation in a complex versus simple corona, and their surface location, which was not investigated. HSI validated the intracellular uptake patterns observed in ICP-MS studies: 80 nm AuNP> 40 nm AuNP; Bare AuNP > HSA-AuNP > PC-AuNP.
Transcriptional profiling studies were conducted to investigate the toxicity mechanisms of BPEI-AuNP. Even though bare BPEI-AuNP at lower concentrations did not exert any visible toxicity to cells, BPEI-AuNP was still capable of disrupting DNA damage and repair, and heat shock response pathways. However, at 75.44 μg/ml with 50% reduction in cell viability, there was an additional impact on mitochondrial energy metabolism, oxidative stress and antioxidant response, and ER stress and unfolded protein response. This suggests the critical role of deregulated genes of these five pathways collectively culminating in apoptosis/necrosis inducing dose-dependent toxicity of bare BPEI-AuNP. In contrast, PC-BPEI AuNP at 25 μg/ml hardly affected any vital genes, clearly showing that at lower concentrations, corona formation masked the toxicity of bare BPEI-AuNP completely. Even at 75.44 μg/ml, compared to bare BPEI-AuNP, PC-BPEI-AuNP relieved the catastrophic impact of bare BPEI-AuNP on the above pathways, confirming the effect of corona in alleviating the toxicity of bare BPEI-AuNP (). However, at higher concentration, PC-BPEI-AuNP-affected genes involved in phospholipidosis, apoptosis, immunotoxicity and cholestasis pathways. This is a significantly different response from bare BPEI-AuNP expression profiles. Minor toxicity related to fatty acid metabolism and/or immunotoxicity could not be completely ruled out in the case of PC-BPEI-AuNP. However, the same did not produce any deleterious effect, necessarily to the extent of exerting cytotoxicity or loss of cell viability, per se.
These results point toward the necessity of strategic engineering of NP surface chemistry to minimize corona formation, if not prevent it, improve uptake and mitigate toxicity. Since NP uptake is considered critical for determining the success of nanomedicines, attempts should focus on identifying nontoxic, surface functionalizations/coatings, which retains the stability of NP, and aids in cell internalization. The cationic BPEI coating promoted cell uptake, but it adsorbed agglomeration inducing fibrinogen and proved to be toxic. While the PEG coating demonstrated reduced protein binding and better stability, the effect translated to low cell uptake. Even though, LA-AuNP showed the highest protein binding, it remained stable, was less toxic and showed an uptake profile higher than the PEG-AuNP, demonstrating an overall acceptable profile, compared to BPEI- and PEG-AuNP.
Conclusions
AuNP surface chemistry played a dominant role over size in determining biocorona composition and subsequent biological responses of AuNP exposed to endothelial cells. Interestingly, despite the net negative charge of corona-bound AuNP, surface chemistry-dependent cell uptake was observed. Nevertheless, the presence of corona reduced overall uptake of AuNP. Bare BPEI-AuNP exhibited dose-dependent toxicity, where subsequent transcriptional profiling studies revealed PC formation to alleviate the toxicity of cationic AuNP. These comparative in vitro studies of bare, and corona-bound AuNP underlines and highlights the impracticality and inaccuracy of conducting in vitro toxicity screens of “bare NP” intended for IV administration. By implementing a comprehensive toxicological evaluation using bare- and corona-bound NP, the adverse aspects of NPs could be better anticipated in advance, and potentially modulated through rational design, thereby overcoming hindrances to clinical translation. Research should re-focus on strategically engineering NP surface chemistry to minimize corona formation, improve uptake and mitigate toxicity to tailor effective nanotherapeutics.
Supplementary_Material_INAN_A_1314036.pdf
Download PDF (2.5 MB)Acknowledgements
Authors thank Dr. Abhilash Sasidharan for preparation of AuNP plasma coronas, Dr. Kyoungju Choi for help with qRT-PCR analysis, Mr. Ravi Thakkar for TEM support, Ms. Susan Whittaker for CD analysis, and Dr. Nadezhda Galeva (University of Kansas) for LFQ-LC-MS experiments. This research was supported by the Nanotechnology Innovation Center of Kansas State research grant and Kansas Bioscience Authority.
Disclosure statement
The authors report no conflicts of interest. The authors alone are responsible for the content and writing of this article.
Additional information
Funding
Related Research Data
References
- Aggarwal P, Hall JB, McLeland CB, Dobrovolskaia MA, McNeil SE. 2009. Nanoparticle interaction with plasma proteins as it relates to particle biodistribution, biocompatibility and therapeutic efficacy. Adv Drug Deliv Rev 61:428–37.
- Bramanti E, Benedetti E. 1996. Determination of the secondary structure of isomeric forms of human serum albumin by a particular frequency deconvolution procedure applied to Fourier transform IR analysis. Biopolymers 38:639–53.
- Cheng X, Tian X, Wu A, Li J, Tian J, Chong Y, et al. 2015. Protein corona influences cellular uptake of gold nanoparticles by phagocytic and nonphagocytic cells in a size-dependent manner. ACS Appl Mater Interfaces 7:20568–75.
- Cho EC, Xie J, Wurm PA, Xia Y. 2009. Understanding the role of surface charges in cellular adsorption versus internalization by selectively removing gold nanoparticles on the cell surface with a I2/KI etchant. Nano Lett 9:1080–4.
- Choi K, Riviere JE, Monteiro-Riviere NA. 2017. Protein corona modulation of hepatocyte uptake and molecular mechanisms of gold nanoparticle toxicity. Nanotoxicology 11:64–75.
- Davis ME. 2009. The first targeted delivery of siRNA in humans via a self-assembling, cyclodextrin polymer-based nanoparticle: from concept to clinic. Mol Pharm 6:659–68.
- Deng ZJ, Liang M, Monteiro M, Toth I, Minchin RF. 2011. Nanoparticle-induced unfolding of fibrinogen promotes Mac-1 receptor activation and inflammation. Nat Nanotechnol 6:39–44.
- Deng ZJ, Liang M, Toth I, Monteiro M, Minchin RF. 2013. Plasma protein binding of positively and negatively charged polymer-coated gold nanoparticles elicits different biological responses. Nanotoxicology 7:314–22.
- Docter D, Westmeier D, Markiewicz M, Stolte S, Knauer SK, Stauber RH. 2015. The nanoparticle biomolecule corona: lessons learned – challenge accepted? Chem Soc Rev 44:6094–121.
- Dreaden EC, Austin LA, Mackey MA, El-Sayed MA. 2012. Size matters: gold nanoparticles in targeted cancer drug delivery. Ther Deliv 3:457–78.
- Freese C, Gibson MI, Klok HA, Unger RE, Kirkpatrick CJ. 2012. Size- and coating-dependent uptake of polymer-coated gold nanoparticles in primary human dermal microvascular endothelial cells. Biomacromolecules 13:1533–43.
- Hubbell JA, Langer R. 2013. Translating materials design to the clinic. Nat Mater 12:963–6.
- Karmali PP, Simberg D. 2011. Interactions of nanoparticles with plasma proteins: implication on clearance and toxicity of drug delivery systems. Expert Opin Drug Deliv 8:343–57.
- Klingberg H, Oddershede LB, Loeschner K, Larsen EH, Loft S, Moller P. 2015. Uptake of gold nanoparticles in primary human endothelial cells. Toxicol Res 4:655–66.
- Klingberg H, Loft S, Oddershede LB, Moller P. 2015. The influence of flow, shear stress and adhesion molecule targeting on gold nanoparticle uptake in human endothelial cells. Nanoscale 7:11409–19.
- Lacerda SH, Park JJ, Meuse C, Pristinski D, Becker ML, Karim A, Douglas JF. 2010. Interaction of gold nanoparticles with common human blood proteins. ACS Nano 4:365–79.
- Li Y, Monteiro-Riviere NA. 2016. Mechanisms of cell uptake, inflammatory potential and protein corona effects with gold nanoparticles. Nanomedicine 11:3185–203.
- Loo C, Lin A, Hirsch L, Lee MH, Barton J, Halas N, et al. 2004. Nanoshell-enabled photonics-based imaging and therapy of cancer. Technol Cancer Res Treat 3:33–40.
- Lundqvist M, Stigler J, Elia G, Lynch I, Cedervall T, Dawson KA. 2008. Nanoparticle size and surface properties determine the protein corona with possible implications for biological impacts. Proc Natl Acad Sci USA 105:14265–70.
- Lynch I, Cedervall T, Lundqvist M, Cabaleiro-Lago C, Linse S, Dawson KA. 2007. The nanoparticle-protein complex as a biological entity; a complex fluids and surface science challenge for the 21st century. Adv Colloid Interface Sci 134-135:167–74.
- Mahmoudi M, Lynch I, Ejtehadi MR, Monopoli MP, Bombelli FB, Laurent S. 2011. Protein-nanoparticle interactions: opportunities and challenges. Chem Rev 111:5610–37.
- Mirsadeghi S, Dinarvand R, Ghahremani MH, Hormozi-Nezhad MR, Mahmoudi Z, Hajipour MJ, et al. 2015. Protein corona composition of gold nanoparticles/nanorods affects amyloid beta fibrillation process. Nanoscale 7:5004–13.
- Mirshafiee V, Kim R, Mahmoudi M, Kraft ML. 2016. The importance of selecting a proper biological milieu for protein corona analysis in vitro: human plasma versus human serum. Int J Biochem Cell Biol 75:188–95.
- Monopoli MP, Aberg C, Salvati A, Dawson KA. 2012. Biomolecular coronas provide the biological identity of nanosized materials. Nat Nanotechnol 7:779–86.
- Monopoli MP, Walczyk D, Campbell A, Elia G, Lynch I, Bombelli FB, Dawson KA. 2011. Physical-chemical aspects of protein corona: relevance to in vitro and in vivo biological impacts of nanoparticles. J Am Chem Soc 133:2525–34.
- Monteiro-Riviere NA, Inman AO, Zhang LW. 2009. Limitations and relative utility of screening assays to assess engineered nanoparticle toxicity in a human cell line. Toxicol Appl Pharmacol 234:222–35.
- Monteiro-Riviere NA, Samberg ME, Oldenburg SJ, Riviere JE. 2013. Protein binding modulates the cellular uptake of silver nanoparticles into human cells: implications for in vitro to in vivo extrapolations? Toxicol Lett 220:286–93.
- Mosesson MW. 2005. Fibrinogen and fibrin structure and functions. J Thromb Haemost 3:1894–904.
- Nel AE, Madler L, Velegol D, Xia T, Hoek EM, Somasundaran P, et al. 2009. Understanding biophysicochemical interactions at the nano-bio interface. Nat Mater 8:543–57.
- Nesvizhskii AI, Keller A, Kolker E, Aebersold R. 2003. A statistical model for identifying proteins by tandem mass spectrometry. Anal Chem 75:4646–58.
- Pearson RM, Hsu HJ, Bugno J, Hong S. 2014. Understanding nano-bio interactions to improve nanocarriers for drug delivery. MRS Bull 39:227–37.
- Pearson RM, Juettner VV, Hong S. 2014. Biomolecular corona on nanoparticles: a survey of recent literature and its implications in targeted drug delivery. Front Chem 2:108.
- Podila R, Chen R, Ke PC, Brown JM, Rao AM. 2012. Effects of surface functional groups on the formation of nanoparticle-protein corona. Appl Phys Lett 101:263701.
- Rahman M, Laurent S, Tawil N, Yahia LH, Mahmoudi M. 2013. Nanoparticle and protein corona. In: Rahman M, Laurent S, Tawil N, Yahia LH, Mahmoudi M, eds. Protein-nanoparticle interactions: the bio-nano interface. Berlin, Heidelberg: Springer Berlin Heidelberg, 21–44.
- Riehemann K, Schneider SW, Luger TA, Godin B, Ferrari M, Fuchs H. 2009. Nanomedicine-challenge and perspectives. Angew Chem Int Ed Engl 48:872–97.
- Ritz S, Schottler S, Kotman N, Baier G, Musyanovych A, Kuharev J, et al. 2015. Protein corona of nanoparticles: distinct proteins regulate the cellular uptake. Biomacromolecules 16:1311–21.
- Samberg ME, Oldenburg SJ, Monteiro-Riviere NA. 2010. Evaluation of silver nanoparticle toxicity in skin in vivo and keratinocytes in vitro. Environ Health Perspect 118:407–13.
- Sasidharan A, Chandran P, Monteiro-Riviere NA. 2016. Biocorona bound gold nanoparticles augment their hematocompatibility irrespective of size or surface charge. ACS Biomater Sci Eng 2:1608–18.
- Sasidharan A, Monteiro-Riviere NA. 2015. Biomedical applications of gold nanomaterials: opportunities and challenges. Wiley Interdiscip Rev Nanomed Nanobiotechnol 7:779.
- Sasidharan A, Riviere JE, Monteiro-Riviere NA. 2015. Gold and silver nanoparticle interactions with human proteins: impact and implications in biocorona formation. J Mater Chem B 3:2075–82.
- Seigneuric R, Markey L, Nuyten DS, Dubernet C, Evelo CT, Finot E, Garrido C. 2010. From nanotechnology to nanomedicine: applications to cancer research. Curr Mol Med 10:640–52.
- Sengupta S, Kulkarni A. 2013. Design principles for clinical efficacy of cancer nanomedicine: a look into the basics. ACS Nano 7:2878–82.
- Stayton I, Winiarz J, Shannon K, Ma Y. 2009. Study of uptake and loss of silica nanoparticles in living human lung epithelial cells at single cell level. Anal Bioanal Chem 394:1595–608.
- Tenzer S, Docter D, Kuharev J, Musyanovych A, Fetz V, Hecht R, et al. 2013. Rapid formation of plasma protein corona critically affects nanoparticle pathophysiology. Nat Nanotechnol 8:772–81.
- van der Meel R, Vehmeijer LJ, Kok RJ, Storm G, van Gaal EV. 2013. Ligand-targeted particulate nanomedicines undergoing clinical evaluation: current status. Adv Drug Deliv Rev 65:1284–98.
- Vroman L, Adams AL, Fischer GC, Munoz PC. 1980. Interaction of high molecular weight kininogen, factor XII, and fibrinogen in plasma at interfaces. Blood 55:156–9.
- Walczyk D, Bombelli FB, Monopoli MP, Lynch I, Dawson KA. 2010. What the cell “sees” in bionanoscience. J Am Chem Soc 132:5761–8.
- Walkey CD, Chan WC. 2012. Understanding and controlling the interaction of nanomaterials with proteins in a physiological environment. Chem Soc Rev 41:2780–99.
- Walkey CD, Olsen JB, Guo H, Emili A, Chan WC. 2012. Nanoparticle size and surface chemistry determine serum protein adsorption and macrophage uptake. J Am Chem Soc 134:2139–47.
- Xia X, Xia Y. 2014. Gold nanocages as multifunctional materials for nanomedicine. Front Phys 9:378–84.
- Xia XR, Monteiro-Riviere NA, Riviere JE. 2010. An index for characterization of nanomaterials in biological systems. Nat Nanotechnol 5:671–5.
- Zuo L, Wei W, Morris M, Wei J, Gorbounov M, Wei C. 2007. New technology and clinical applications of nanomedicine. Med Clin North Am 91:845–62.