
Abstract
The unique behavior of engineered nanomaterials (ENM) in aqueous media and dynamic changes in particle settling, agglomeration and dissolution rates is a challenge to the consistency, reliability and interpretation of standard aquatic hazard bioassay results. While the toxicological endpoints (e.g., survival, growth, reproduction, etc.) in ecotoxicity bioassays are largely applicable to ENMs, the standard methods as written for dissolved substances are confounded by the dynamic settling, agglomeration and dissolution of particulate ENMs during the bioassay. A testing framework was designed to serve as a starting point to identify approaches for the consistent conduct of aquatic hazard tests that account for the behavior of ENMs in test media and suitable data collection to support representative exposure metrology. The framework was demonstrated by conducting three case studies testing ENMs with functionally distinct characteristics and behaviors. Pretests with a temporal sampling of particle concentration, agglomeration and dissolution were conducted on each ENM in test media. Results indicated that a silver nanoparticle (AgNP) powder was not dispersible, a nano-TiO2 powder was dispersible but unstable, and a polyvinylpyrrolidinone-coated AgNP was relatively stable in test media. Based on these functional results, Ceriodaphnia dubia bioassays were conducted to compare different exposure summary methods (nominal, arithmetic average, geometric average, time-weighted average) for calculating and expressing toxicity endpoints. Results indicated that while arithmetic means were effective for expressing the toxicity of more stable materials, time-weighted averaged concentrations were appropriate for the unstable nano-TiO2.
Introduction
The rapid development of nanotechnology has led to a broadening array of engineered nanomaterials (ENM) and nano-enabled products (NEPs). These ENMs are particles, objects, fibers and nanostructured surfaces with at least one dimension between 1 and 100 nm (ASTM, Citation2006), exploited for their unique physical/chemical behaviors and increased functional surface area (Bell et al., Citation2014). ENMs are fundamentally different from the soluble chemicals that are historically tested using existing hazard bioassay methods and considered in risk assessment and management practices (Godwin et al., Citation2015). The composition of ENMs is theoretically unlimited, including nanohybrids of two or more elements (Saleh et al., Citation2014). Their properties, characteristics and behaviors present significant challenges at all levels of environmental health and safety, including regulation, risk management, exposure and hazard assessment; these challenges exist in part because current standards for dissolved chemicals are not directly applicable or prescribed for testing particles or colloids (Petersen et al., Citation2015). Formal, internationally recognized ENM-specific guidance has yet to be developed, resulting in inconsistent testing, interpretation and decisions regarding the material physical–chemical information to be provided in dossiers submitted to regulatory agencies (Collier et al., Citation2015; Hund-Rinke et al., Citation2016; Petersen et al., Citation2015; Potthoff et al., Citation2015).
Fate and hazard data for ENMs are being generated at an exponential rate (e.g., silver nanoparticles, AgNPs). Despite greater data availability, the number of permutations (e.g., size, coating, production method, surface properties, etc.) within a single ENM composition type limits the direct application of currently available, material-specific information for general risk assessment. This is further exacerbated by changes to primary ENM properties, fate and hazard due to aging and transformation in media (Kennedy et al., Citation2012; Lowry et al., Citation2012), and transformation of particles from product matrices during environmental release triggers (weathering, abrasion) and processes (Collier et al., Citation2015). Given the variations in form, function and application, the ability to generalize the hazard, exposure and risk of an ENM (or NEP) is so far limited. To address a large number of ENM permutations, efforts are underway to categorize ENM by their behavior, fate and hazard (e.g., Godwin et al., Citation2015; Organisation of Economic Cooperation and Development (OECD), Citation2016). However, it remains unclear if and when scientifically defensible consensus will be resolved. Further, it is unclear if categorization of ingredient ENMs that are constituents of NEPs are representative of, or relevant to, materials that may be released from NEPs and potentially transformed (e.g., composition, solubility, biopersistence, aspect ratio, chemical activity) in environmental matrices (Arts et al., Citation2015). Interim hazard assessment methods are needed since NEPs are rapidly entering commercial and other markets; investigators need to supply the best available knowledge on ENM toxicological exposure and hazard to facilitate current risk assessment decisions (Godwin et al., Citation2015; Hansen et al., Citation2014). A clear and consistent testing framework process for generating hazard data for ENMs is needed, in addition to a more adaptive and diverse set of analyses and techniques for ENM risk assessment (Holden et al., Citation2016; Hund-Rinke et al., Citation2015; Jahnel, Citation2015; Potthoff et al., Citation2015).
To meet the aforementioned needs, we previously published a tiered-testing strategy for characterizing the release potential, exposure and hazard of ENMs and NEPs (Collier et al., Citation2015). The development of that strategy and the content of this paper was based on the literature describing the novel behaviors of ENMs (relative to soluble chemicals) and the difficulties in testing them (Petersen et al., Citation2015). The tiered strategy was inspired, in part, by testing approaches used in sediment dredging evaluations (USEPA/USACE, 1998), which also test complex homo- and hetero-agglomerated particle and water mixtures that potentially contain chemical substances that can be released while settling in the water column (Kennedy et al., Citation2015a). Due to complexities in contaminant interactions and bioavailability, assessment of dredged materials necessitates the application of bioassay methods to evaluate the toxicity of suspended (and potentially settling) particles and particle-associated contaminants on a case-specific basis. The tiered-testing strategy presented in Collier et al. (Citation2015) provides support for screening and categorizing NEPs (Tier 1), determining potential for ENMs to be released from NEPs (Tier 2), fate in media (Tier 3), hazard (toxicity) potential (Tier 4) and case-specific investigations (Tier 5).
This study focused on expanding the details of Tier 4 of Collier et al. (Citation2015) strategy. We demonstrated hazard testing procedures with focus on critical issues for standardized ecotoxicity testing of ENMs discussed by others (Diamond et al., Citation2009; Handy et al., Citation2012; Holden et al., Citation2016; Hund-Rinke et al., Citation2015; Klaine et al., Citation2008; Petersen et al., Citation2015; Potthoff et al., Citation2015). Key testing issues derive from the particulate and fibrous nature of ENMs, and their tendency to agglomerate and settle out of suspension in bioassay media, resulting in significant exposure variation and thus complicated dosimetry. Some ENMs (e.g., AgNPs, CuO, ZnO) dissolve in assay media (Griffitt et al., Citation2008; Kennedy et al., Citation2015b) resulting in variable mixtures of particles and dissolved substances. These behaviors present significant challenges for quantifying exposure based on traditional total mass dose metrics, and complicate the use of alternative exposure metrics (e.g. surface area, particle or agglomerate number) that may be used to quantify ENM exposure (Hull et al., Citation2012; Kennedy et al., Citation2015b). The absence of specific guidance for aquatic ecotoxicity testing of ENMs complicates risk management and assessment for ENM and greatly reduces the value of test results for predicting hazard and risk (Petersen et al., Citation2015). Recently, Potthoff et al. (Citation2015) described an approach to addressing testing issues using a conceptual, complex series of flow charts generally applicable to air, soil and water. Our approach addresses the issues cited above with a greater focus on aquatic ecotoxicology hazard methods, including the addition of detailed description, and application, of exposure and dosimetry assessment methods applied to case-study materials having very different behaviors in test media. Importantly, this work also follows on, and derives from, a larger testing framework; the need for and selection of ecotoxicity tests evaluated here is based on the identification of ENM release pathways and fates in earlier Tiers of the Tiered Framework (Collier et al., Citation2015).
The specific study objectives were to provide a starting point and process for identifying and employing relevant standard aquatic hazard bioassays and approaches for more accurately assessing and quantifying exposure to ENMs while demonstrating the process using case studies. The scope of the hazard testing strategy is focused on incrementally improving hazard testing method selection and consistency of standard testing methods used in regulatory testing. These standardized tests are designed to be consistent and repeatable, and as a result, typically do not incorporate environmental variability. The need for environmental realism in ENM safety testing is currently being deliberated and is addressed in Tier 5 of the strategy (Collier et al., Citation2015) and in separate exposure assessments considered in risk decisions (Godwin et al., Citation2015). Thus, we caveat that additional extensive analysis and consideration is required in risk analysis (Holden et al., Citation2016). The case studies presented herein tested three functionally distinct ENMs that provided a range of behaviors in test media and thus highlighted the adaptability of the Tier 4 hazard evaluation. The case studies tested ENMs that were: (1) not dispersible; (2) dispersible but not stable in environmental media and (3) stable in media. We reported basic ENM fate information in biological media, and toxicity of the ENMs to the standard freshwater organism Ceriodaphnia dubia.
Materials and methods
Selection of test materials for case studies
Three case studies (), each using an ENM with distinct functional dispersibility and stability behaviors, were conducted to demonstrate the testing framework that was developed from previous experience and the literature (). Case study 1 demonstrated testing of a non-dispersible ENM (nominally 50–80 nm spherical crystalline AgNP powder; NanoDynamics; Grade S2-80; lot1881). Case study 2 demonstrated testing of a dispersible but unstable ENM (hydrophilic Fumed TiO2 powder; Aeroxide TiO2 P25; Evonik Degussa GmbH, Essen, Germany). Case study 3 demonstrated testing of a dispersible and stable silver ENM coated with polyvinylpyrrolidinone, or PVP (PVP-AgNP; research grade NIST Reference Material 8017). A “dispersibility threshold” was conservatively defined as retention of at least 1% of the originally dispersed mass in suspension after 1 h of settling. The 1% threshold was selected based on technical discussions on the development of an OECD test guideline on dispersion and was assessed based on total measurable concentration by ICP-MS (includes particulate and dissolved fractions). The 1 h settling time was based on elutriate preparation methods (USEPA/USACE, Citation1998). The ENMs were considered relatively stable in bioassay test media when mass concentration remained within ±20% of initial values for 24 h, as discussed in OECD ecotoxicity guidelines (Petersen et al., Citation2015).
Figure 1. Hazard evaluation flow chart. Note that time durations and the definition of stability need to be determined by the assessor on a case-specific basis. Example durations are based on typical daily water renewals used in bioassay test methods. “Dispersible” is functionally and conservatively defined as ≥1% of the original concentration. “Stable” is functionally defined as ±20% of the initial concentration (Petersen et al., Citation2015; OECD, Citation2012; Coleman et al., Citation2015, Citation2017a, Citation2017b).
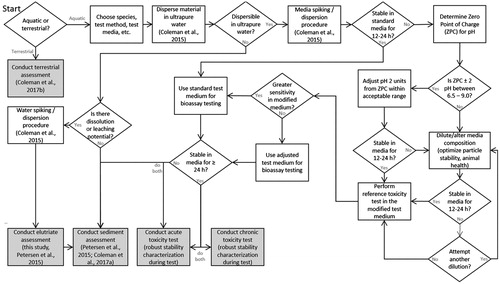
Table 1. Nanoparticle characterization, toxicity test decisions and results for the three case studies. Primary particle size and hydrodynamic diameter (HD) were determined in the stock by ImagePro measurements of transmission electron microscopy images and by dynamic light scattering (DLS), respectively. Data are presented as means (± 1 standard deviation), ranges (min–max) and the number of particles counted (N) are provided. Toxicity endpoints are expressed with 95% confidence ranges in parentheses. Additional data are reported in the Supplementary Material. IS: ionic strength; NA: not available; MHRW: moderately hard reconstituted water.
Description of the exposure and hazard framework
The ENM case studies conducted employed the framework for selecting among available standard aquatic ecotoxicity test method types (see Supplementary Material, Table S1), including assessment of their relevance and applicability based on ENM fate and behavior in environmental media (). First, it was determined if the ENM was dispersible in ultrapure water; water column exposures may be of lower importance for ENMs that will not disperse in ultrapure water by available methods (Coleman et al., Citation2015), with sediment testing potentially more relevant. These issues are common to “difficult to test substances” (e.g. oils) and guidance documents (ECETOC, Citation1996; OECD, Citation2000; U.S. EPA, Citation1996) and the literature (Petersen et al., Citation2015) suggest that it is less relevant to assess “difficult to test substances” in water-only bioassays. However, this issue is particularly complex for ENMs since the goal of the ENM-specific hazard test is to assess the effects of the particulate phase, in addition to potentially released soluble constituents. ENMs that agglomerate and settle to the bottom of test vessels can potentially entrain test organisms (Arndt et al., Citation2013; Petersen et al., Citation2015). ENM settling may also result in a predominance of smaller suspended particles and released ions or other constituent substances in the water column (Hull et al., Citation2009, Kennedy et al., Citation2015b), suggesting a need to test three different fractions of the exposure; the entire ENM exposure, the suspended fraction and the settled fraction (Potthoff et al., Citation2015). The focus of this study was on basic water-column assays, which use test organisms that are highly sensitive to ENMs (Coll et al., Citation2016; Garner et al., Citation2015). Elutriate methods (USEPA/USACE, Citation1998) were used to understand the hazard contribution from the soluble or dispersible fractions of the low or non-dispersible ENMs. Elutriate methods are comparable to water accommodated fraction (ECETOC, Citation1996; OECD, Citation2000) methods.
Water-column bioassays are highly relevant for ENMs that are readily dispersible. Pretests, further described below, were performed to understand change in dispersion state in absence of organisms, including determination of stability (settling, agglomeration, dissolution kinetics) in the specific test media to the bioassay method (Hendren et al., Citation2015); in this case, the medium was moderately hard reconstituted water (MHRW). While test organisms may alter the fate of ENMs (Petersen et al., Citation2015), the intent of the pretests was to initially understand intrinsic particle behavior. However, suspension characteristics were also robustly monitored during the bioassay to understand exposure. For simplicity in pretests, total detectable concentrations were measured by fairly rapid methods (photospectrometry, ICP-MS) and results were used to inform bioassay duration, particle characterization and monitoring frequency. If pretests indicated the dispersed ENM was relatively unstable in test media, then test media adjustments (pH, ionic strength) were employed to determine impacts on stability ( and below). Some guidance (e.g., OECD) describes that variation in substance concentration greater than ±20% should be addressed using modified experimental procedures or monitoring strategies. This threshold in exposure variation is often exceeded for ENMs due to agglomeration, dissolution and settling (Petersen et al., Citation2015). In these cases, adequate monitoring of ENM concentration during the bioassay was employed to more accurately quantify exposure for calculation of toxicological effect endpoints. In cases where the period of dispersion stability and exposure in the water column was short (e.g., <12 h; (ECETOC, Citation1996)) relative to bioassay durations, acute toxicity tests (48 h durations) were considered relevant and were conducted. For more stable materials (e.g., ≤ 20% loss within 24 h; (Petersen et al., Citation2015)), both acute and chronic toxicity test methods were considered relevant and conducted.
Material dispersion and stability in ultrapure water
The powder materials (TiO2, AgNP-powder) were dispersed in ultrapure water (Milli-Q Plus, 18.2 mΩ/cm, Billerica, MA) using available methods (Coleman et al., Citation2015; Taurozzi et al., Citation2011, Citation2013) to determine dispersibility (). Stocks of the AgNP and TiO2 powders were prepared in ultrapure water first by bath sonication (Fisher Scientific model FS-60, 130 W, Pittsburgh, PA), followed by probe sonication (Branson Sonifier, 450; 50 W, 15 min, 40% duty cycle) if bath sonication was unsuccessful, abiding by recommendations to employ lower sonication energy methods where possible (Taurozzi et al., Citation2011).
Test media modifications
Pretests were conducted to determine the stability of the tested ENMs in the standard bioassay medium and to inform decisions on how to conduct the bioassay (). Test media properties such as pH (El Badawy et al., Citation2010) and ionic strength (Harmon et al., Citation2014; Tejamaya et al., Citation2012) impact stability. Therefore, while standardized tests typically allow flexibility in selecting from multiple test media types ranging from very soft water to very hard water (e.g., OECD, Citation2012; USEPA, Citation2002a), such flexibility is problematic for acquiring consistent (repeatable) results from ENM hazard testing (Petersen et al., Citation2015). In the present study, MHRW (US EPA, Citation2002a) was selected, with pretests used to determine if an optimization between ENM stability and organism health could be achieved by 50% serial dilutions of that medium (), to acquire lower ionic strength standard media, such as soft reconstituted water (SRW) and very soft reconstituted water (VSRW) (USEPA, Citation2002a).
The pH modifications (KOH, HNO3) were performed first to adjust media ±2 units from the point of zero charge (PZC). If the pH modification failed to increase stability, ionic strength dilutions were employed. Various authors (Romer et al., Citation2011; Tejamaya et al., Citation2012) recommended that OECD test media be diluted up to 10-fold to increase ENM stability during bioassays. Similarly, Ma et al. (Citation2012) diluted EPA-MHRW fourfold and 100-fold in TiO2 tests with Daphnia magna and Japanese Medaka, respectively, and pretested both species in the modified media to confirm organism health. Decisions to reduce the ionic strength of testing media for particle stability must also consider the environmental relevance and test organism health (Harmon et al., Citation2014) and comparison to historical databases for a test method (Petersen et al., Citation2015). If stability was improved in the modified media, that media is acceptable for use in bioassays. Otherwise, standard, unmodified MHRW should be used.
Hazard test method
Many standard organisms and test methods are available for hazard testing (Hund-Rinke et al., Citation2016; Supplementary Material, Table S1). The type and duration of the test method may be made on a case-specific basis, determined by ENM behavior. An expanded discussion of the test method and organism selection is provided in the Supplementary Material. For the simplicity of demonstrating the testing framework, the standard toxicological organism C. dubia was used for the case studies. C. dubia is often among the most sensitive organisms to various ENMs (Coll et al., Citation2016; Garner et al., Citation2015). The acute C. dubia USEPA test method (2002a) was used to assess survival after 48 h exposure. The chronic C. dubia USEPA test method (Citation2002b) was used to assess survival and reproduction after three broods. Acute and chronic tests were conducted at 25 ± 1 °C in temperature and humidity controlled rooms (Darwin Chambers, St. Louis, MO).
Case study 1: non-dispersible material
A dispersion pretest, performed according to Coleman et al. (Citation2015), determined that the AgNP powder was not dispersible in ultrapure water by bath or probe sonication. Since AgNPs may release toxic ions into test media (Kennedy et al., Citation2015b), two comparative bioassays were conducted; one that included the settled particles and another that adapted elutriate methods (USEPA/USACE, Citation1998). Since this material was not dispersible in ultrapure water, adjustments to MHRW to enhance stability were not relevant, and hazard assays were conducted using unmodified MHRW to determine the toxicity of potentially released soluble and particulate fractions. Bioassays were conducted to compare two methods; one where an attempt was made to perform a serial dilution with particles present; one where only the top 200 ml of the supernatant after 1 h particle settling was used. The AgNP powder for both assays was probe sonicated in MHRW (20 mg/l) according to Coleman et al. (Citation2015). Serial dilutions were created from the stock for the particle testing in nominal concentrations of 10–0.08 mg/l while bath sonicating until adding organisms.
Since the measurable Ag in the supernatant was dissolved and particles did not remain in the water column for chronic durations, an acute C. dubia toxicity test of the supernatant was conducted to compare the hazard of the water fraction to the known toxicity of dissolved silver. Further, it was previously suggested that dissolved silver and nanosilver may be more toxic in acute bioassay methods which do not involve food additions relative to chronic methods in which added food may interact with silver (Allen et al., Citation2010; Hoheisel et al., Citation2012).
Case study 2: dispersible but unstable material
A dispersion pretest conducted according to Coleman et al. (Citation2015) determined that the TiO2 powder was dispersible in ultrapure water but settled in MHRW. Test media adjustments of pH and ionic strength were employed (). The stability of TiO2 was assessed after both probe and bath sonication using previously described methods (Coleman et al., Citation2015; Ma et al., Citation2012). Initial tests were conducted after probe sonication to determine the influence of conductivity and pH. This was followed by time course assessments at a single pH and conductivity for both probe and bath sonicated treatments (as in ). TiO2 stocks (500 mg/l) were prepared in a 1 l Erlenmeyer flask with 500 ml ultrapure water by magnetically stirring for 15 min, followed by 15 min bath sonication to fully wet the particles. Probe sonication was performed for 15 min at 80% pulsed operation mode in an ice bath. After 1 h settling, 350 ml stock was removed and utilized. Since TiO2 was unstable in MHRW, testing was conducted in MHRW adjusted for pH and conductivity. Both pH 7.8 and 8.7 were tested (NaOH adjustments of 1 and 2 pH units, respectively, from the PZC of 6.7); conductivity dilutions used ultrapure water to create 0, 1, 25 and 100% MHRW at pH 8.7. Test concentrations of 5, 25 and 50 mg/l were created by spiking TiO2 stock into 360 ml adjusted media in 500 ml glass Erlenmeyer flasks, followed by brief probe sonication (2 min). Following sonication, test media was poured into 20 ml glass scintillation vials for triplicated time point sampling (0, 0.5, 1, 4, 24 and 48 h).
Acute C. dubia exposures were conducted on both probe and bath sonicated TiO2 for comparison. Probe sonicated treatments were prepared as described above. The stock was spiked into 360 ml of 100 μS/cm test media (pH 7.8) in 500 ml Erlenmeyer flasks (2, 7, 23, 75, 250, 500 mg/l). Bath sonication treatments were prepared by adding 250 mg of TiO2 powder to 500 ml of ultra-pure water, magnetically stirring for 15 min to wet the powder, then bath sonicating for 2 h. Both probe and bath treatments were poured into 20 ml glass quadruplicated (n = 4) scintillation vials containing MHRW diluted to 100 μS/cm for bioassays. For particle exposure assessment, triplicated samples (n = 3) were collected at 2, 4, 24 and 48 h for ICP-MS, DLS and photo spectroscopy.
Since the TiO2 in modified MHRW media was relatively unstable (<12 h; ECETOC Citation1996), we hypothesized that the initial exposure to the suspended TiO2 was more important for determining the effect on survival than the settled material and that any additional mortality observed after the TiO2 settled was a delayed effect resulting from the initial exposure to the suspended material. To test this, C. dubia neonates were exposed to bath sonicated TiO2 (75 mg/l, nominal) for 2, 4, 24 or 48 h, followed by transfer to clean 100 μS/cm water for 48 h observation.
Case study 3: dispersible and stable material
A dispersion pretest () determined that the PVP-AgNPs were both dispersible and stable in MHRW. The PVP-AgNPs were combined with ultrapure water according to MacCuspie et al. (Citation2013); briefly, 20 ml ultrapure water was added to the particle cake. Particles were dispersed by vigorous hand swirling for 5 min. The 20 ml stock was allowed to equilibrate for 1 h, followed by removal of the top 15 ml for use in experiments. The stock was characterized (DLS, ICP-MS), then spiked into 200 ml of MHRW (pH 7.8) at 0.5, 1 and 5 mg/l in 300 ml Erlenmeyer flasks. Each concentration required minimal mixing for 30 s. Once mixed, test concentrations were poured into 20 ml glass scintillation vials (n = 3 per time point) and sampled at 0, 2, 4, 24 and 48 h for ICP-MS (total and dissolved), DLS and photo spectroscopy. Since this material was stable in MHRW, media adjustments were unnecessary. Since the PVP-AgNPs were determined to be stable in the biological test media for greater than the 48 h acute toxicity test duration, both acute (48 h) and chronic C. dubia toxicity tests were conducted.
Characterization and analytical determinations
Primary particle size and morphology were determined by scanning electron microscopy (Nova NanoSEM 630, FEI Co, Hillsboro, OR) operated at 5–15 kV with spot sizes 3.0–5.0. Imaging was performed in high vacuum mode using secondary electron (TLD) and backscattered electron (vCD) detectors. Primary particle size was measured using ImagePro software (v7, Media Cybernetics Inc., Bethesda, MD), as in Poda et al. (Citation2011). Suspension concentrations were determined by ICP-MS or Graphite Furnace Atomic Absorption Spectroscopy for volume limited samples (ICP-MS, Elan DRC-II, GF-AAS, Pinnacle 900Z, PerkinElmer, Waltham, MA) and UV-vis photospectrometer (Cary 5000 UV-Vis-NIR, Agilent Technologies, Cary, NC). The surface area of the dry powders was determined by Brunauer?Emmett?Teller (BET) analysis (NOVAtouch LX-4, Quantachrome Instruments, Boynton Beach, FL), as previously described (Kennedy et al., Citation2008). Ti was determined by ICP-MS following hydrofluoric acid digestion to minimize analyte loss to precipitation or container wall adherence. The instruments were calibrated using NIST-traceable commercially available standards (CPI International, Santa Rosa, CA), with calibrations verified within 10% by second source standards. Changes in suspension agglomeration were measured by hydrodynamic diameter (HD) using dynamic light scattering (DLS; 635 nm laser; 90 Plus/BI-MAS, Brookhaven Instruments, Holtsville, NY) by intensity weighting. Zeta potential was determined from electrophoretic mobility measurements and PZC determined using a BI-ZTU auto-titrator (90 Plus/BI-MAS, Brookhaven Instruments, Holtsville, NY). Dissolved concentrations were determined by 60 min of ultracentrifugation (Beckman Coulter, Inc., 355603, Brea, CA) at 100,000× g, as previously described (Poda et al., Citation2011) and validated (Kennedy et al., Citation2015b).
Toxicological effect endpoint calculations
Endpoint calculations used averaged, measured concentrations for particles that were relatively stable, which was operationally defined as ±20% of the original concentration (OECD, Citation2000; Petersen et al., Citation2015). For unstable substances, geometric means or time-weighted averages were employed (OECD, Citation2012). When concentration stability (total or dissolved) could not be maintained, time-weighted averaged concentrations were determined from temporally measured values throughout the bioassay duration (OECD, Citation2012; Petersen et al., Citation2015). Lethal median concentrations (LC50) and inhibition concentrations (IC) were calculated by the trimmed Spearman − Karber method and linear interpolation methods, respectively, using ToxCalc 5.0 (Tidepool Scientific Software, McKinleyville, CA). The LC and IC endpoints were reported with 95% confidence limits in parentheses, with non-overlapping intervals used to qualitatively define differences in sensitivity.
Results and discussion
Material characterization
Basic characterization (size, surface area, charge) is provided in and SEM images are provided in the Supplementary Material (Figure S1). The measured primary particle diameters from SEM images were within 35% of nominal for the three test ENMs. As expected, HD was larger than primary particle size. This may be explained by agglomeration of particles in aqueous suspension, bias toward larger particles in the size distribution (Domingos et al., Citation2009), coating thickness (i.e., PVP-AgNP) or sintering of the powder materials.
Case study 1: non-dispersible particle
Results of the pretest indicated that AgNP powder was not dispersible in ultra-pure water and not stable after probe sonication. Therefore, no further pretest stability assays were conducted (). There were notable differences in concentration consistency between serial dilutions of elutriate (1 h settled supernatant) and whole, non-dispersible powder treatments. Serial dilution of the elutriate method resulted in monotonic total and dissolved Ag concentrations, allowing a consistent and predictable exposure for the bioassays (Supplementary Material, Figure S2). When supernatant was not isolated, serial dilution of the settled AgNPs resulted in non-monotonic concentrations, potentially due to unequal mixing. It is possible that presence of settled particles will result in additional ion release during the bioassay exposure. Such changes during an exposure can significantly impact the accuracy of toxicological effect endpoint calculations if not accounted for and highlights problems dealing with ENM exposure and dosimetry. If non-dispersible ENM powders are tested, interpretation of these data suggests it is prudent to individually spike the material into each exposure concentration since accurate serial dilution of poorly dispersed powders was inconsistent, as demonstrated in this study.
Using the geometric mean of measured Ag at test initiation and termination, the acute toxicity of the elutriate method was 1.8 and 0.3 μg/l, as total measurable and dissolved Ag, respectively (). The dissolved Ag fraction toxicity is comparable to the Ag ion LC50 (0.3 μg Ag/l as AgNO3) we previously reported (Kennedy et al., Citation2015b), suggesting dissolved Ag drove the acute toxicity of the AgNP powder elutriate. The LC50 from the whole particle test (0.6, 95% confidence limits: 0.4–0.9 μg Ag/l) was also comparable to dissolved Ag toxicity. While sediment toxicity testing is relevant due to the lack of dispersibility and rapid settling of this material (), the focus of the present study was to demonstrate only water column testing methods. We previously reported the sediment-associated bioavailability of this material (Coleman et al., Citation2013).
Case study 2: dispersible/unstable particle
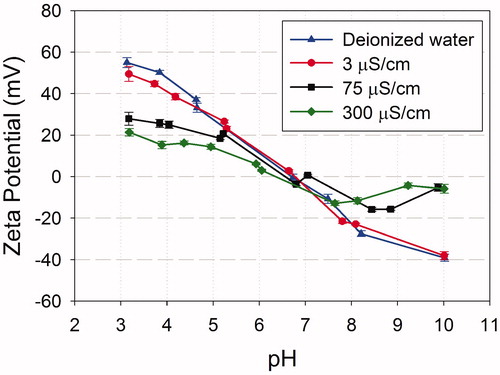
Results of the pretest indicated that the TiO2 probe sonicated powder was initially dispersible in ultrapure water, but was unstable in MHRW (; Supplementary Material, Figure S3). Photospectrometry () and DLS () indicated rapid agglomeration and particle settling, which increased rates observed with higher TiO2 particle concentration. Adjustments 2 pH units (8.7) from the PZC () still resulted in rapid agglomeration, accelerated by increased particle concentration (). Dilution of MHRW to a lower conductivity (3 μS/cm) reduced agglomeration rates (); however, the dispersions were still unstable (>20% loss of material) at a more biologically acceptable conductivity of 100 μS/cm (). Since small improvements in stability at lower conductivities of 100 μS/cm (comparable to standard VSRW; USEPA, Citation2002a) this water was used for bioassays to accommodate organism health (Harmon et al., Citation2014).
Figure 2. Pre-test results for Case Study 2 using TiO2. Photospectrometry (λ = 300) was used in initial pretests to quickly generate particle settling curves and indicated that (A) settling rates and (B) agglomeration rates (by dynamic light scattering) in moderately hard reconstituted water (300 μS/cm) were highly concentration dependent. (C) Agglomeration rates were not substantially altered by adjusting pH from 7.8 to 8.7. In diluted 100 μS/cm water (pH8.7), pretests by (D) photospectrometry (λ = 300) and by (E) measured concentrations standardized by the initially measured concentration at time zero (B; see Supplementary Figure S3A actual concentrations) also indicated concentration dependent settling. (F) Agglomeration was reduced but not eliminated compared to ultrapure water even at low conductivity (3 μS/cm) not suitable for C. dubia testing. Dashed horizontal lines in each plot indicate an operational definition of stability (±20% of the initial value).
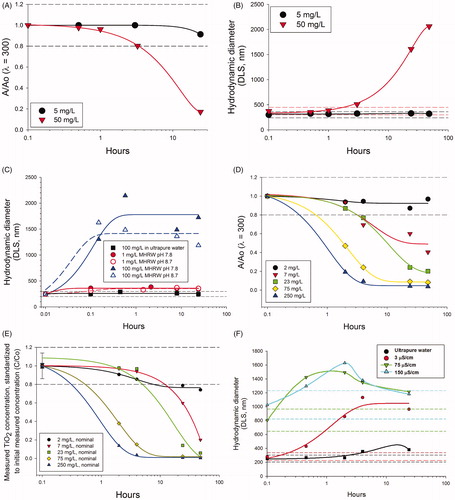
Figure 3. Determination of the impact of adjusting pH on the zeta potential (mV) of nano TiO2.
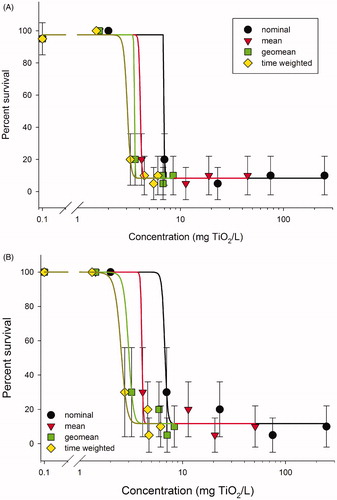
Due to rapid particle agglomeration and settling in the pretests (), acute C. dubia exposures were conducted separately for both bath and probe sonicated dispersions. Both the probe and bath sonicated treatments resulted in similar trends in stability during the bioassays; TiO2 stability decreased in exposures over time and increased further with increased concentration (Supplementary Material, Figure S3). The LC50 values based on time-weighted averages of the probe (2540 μg/l) and bath (2410 μg/l) sonicated TiO2 were similar (; Supplementary Material, Table S2), suggesting the two different preparation methods did not have a dramatic impact on the acute ecotoxicity of TiO2. Summarizing the exposure data using arithmetic means, geometric means versus time-weighted averages resulted in moderate differences in LC50 values (2410–3740 μg/l; Supplementary Material, Table S2). This was because the median effect occurred at lower, more stable concentrations (rather than the higher, dynamically changing concentrations). However, the time-weighted averaged concentrations provided an explanation for why complete mortality was not observed in the higher nominal concentrations (). The exposures decreased more rapidly at higher concentrations (greater interaction frequency and agglomeration) such that the time-weighted exposures that C. dubia actually experienced were reduced to similar levels as the lower concentrations (as indicated by the narrowing of the distribution between points along the x-axis of ).
Figure 4. Ceriodaphnia dubia dose response curves for (A) probe sonicated and (B) bath sonicated TiO2. Time-weighted averaged data provided an improved estimate of the actual organism exposure to the settling TiO2 particles during the bioassay. The rapid agglomeration and subsequent settling of the TiO2 in the highest four concentrations reduced organism exposure to the suspended TiO2, and concentration expressed as nominal or mean measured over-represented the actual organism exposure to TiO2.
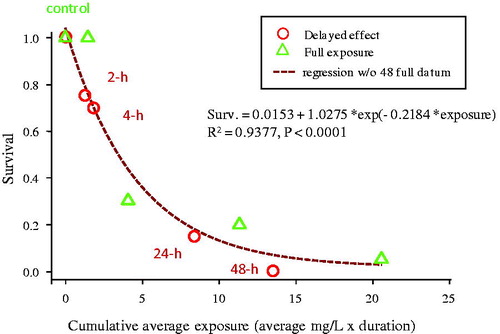
In a subsequent experiment C. dubia was exposed to 75 mg/l (nominal) TiO2, resulting in measured suspended concentrations of 38.1, 22.9, 5.8, 0.6 and 0.4 mg/l after 0, 1, 4, 24 and 48 h, respectively. Similar survival () was observed for the C. dubia exposed to TiO2 for only short duration (2, 4, 24 h) followed by transfer to clean water to the survival of C. dubia that were continuously exposed to the settling TiO2 for a full 48 h (regression of all data, R2 = 0.94, p < 0.0001). This suggests that the short duration of time that the TiO2 was suspended in the water column had a greater influence on the observed effects on survival than the TiO2 that was settled in the beaker during the continuous exposure. This, in combination with the time-weighted averaged dose response curves (), indicates that the duration of exposure to suspended particles was the determinant of acute TiO2 toxicity, and underscores the importance of quantifying exposure for unstable materials. C. dubia appears to be more sensitive to the non-photo induced toxicity of TiO2 relative to D. magna (Ma et al., Citation2012). However, it should be noted that the increased photoinduced toxicity of TiO2 (Ma et al., Citation2012) was not considered here. Since the focus of the present study was on water-column testing, sediment toxicity testing on the settled particle fraction was not undertaken (). Sediment testing is relevant for assessing risk for TiO2 given its rapid settling behavior and was previously assessed (Li et al., Citation2014).
Figure 5. Delayed effects of TiO2 exposure on C. dubia after being exposed continuously or for various time periods, followed by transfer to clean 100 μS/cm water. Circles represent organisms exposed for the indicated durations and then transferred to clean test media. Triangles represent organisms continuously exposed over the 48 h test duration. The non-linear regression (dashed line) is fit to all data from both exposure regimes.
Case study 3: dispersible/stable particle
Results of the pretest indicated that the PVP-AgNP was the most stable ENM in MHRW tested (). Both total concentration () and HD () were within ±20% of initial values in each of the three concentrations tested for at least 48 h. However, dissolved Ag concentrations did not remain within ±20% of initial values during the 48 h test period (). While dissolved Ag in highest concentration tested (5 mg Ag/l) gradually but steadily decreased by 32% after 48 h, a kinetic increase of 60 and 130% was observed during the first 24 h for 0.5 and 1 mg Ag/l, respectively (). This difference may relate to the dissolved concentration rapidly approaching saturation at higher test concentration, with decreases related to surface sorption to the higher concentrations of particles (Liu & Hurt, Citation2010); the two lower concentrations allowed observation of some ion release kinetics as concentrations remained below saturation.
Figure 6. Functional test results for Case Study 3 using PVP-AgNPs. (A) Total measurable silver concentration and (B) hydrodynamic diameter by dynamic light scattering were relatively stable (± 20%) for at least 48 h. (C) However, dissolved concentrations changed by more than ±20% during the 48 h period. (D) The lower concentrations of particles tested in the bioassays resulted in consistent increases in dissolved Ag concentrations; percentages in the legend represent the dilution series with the 100% being the highest concentration. The lowest two PVP-AgNP treatments do not appear in the graph because the dissolved concentrations were below analytical detection limits (<0.5 μg Ag/l μg/l). Dashed lines indicate ±20% of the initial value.
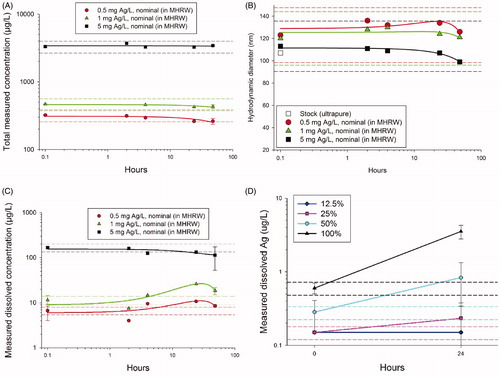
Since the PVP-AgNPs were relatively stable (± 20% total concentration), the difference between the LC50 values calculated from arithmetic (10.2 [8.5–12.0] μg Ag/l) and geometric (9.9 [8.3–11.8] μg Ag/l) means was negligible. Dissolved concentrations increased from less than reporting limits (<0.5 μg Ag/l) to 1.4–3.3 μg Ag/l (). Toxicological effect endpoints for dissolved Ag were calculated based on arithmetic means (0.47 [0.46–0.49] μg Ag/l), geometric means (0.41 [0.41–0.42] μg Ag/l) and concentrations at test termination (0.61 [0.58–0.64] μg Ag/l). While the method for calculating toxicity endpoints for dissolved concentrations did not result in substantial differences in LC50 values, the data may be used to demonstrate best practice for calculating toxicological endpoints with changing concentration. According to Difficult to Test Substances Guidance (OECD, Citation2000), nominal or arithmetic means should be used to determine endpoints when concentrations are within ±20% of the initial concentration or when testing is conducted under flow-through conditions. Since this was not the case, OECD (Citation2000) recommends the use of the geometric mean. However, due to the known, rapid onset of aquatic toxicity of Ag (Kennedy et al., Citation2015b), the most representative exposure, in this case, is likely the highest (final) dissolved concentration measured. We recommend that the more conservative endpoint be applied for estimating hazard, which is, in this case, the LC50 value determined from geometric means.
In chronic testing, total concentrations were also relatively stable (± 20%), considering all in-water and out-water samples (Supplementary Material, Table S3). Therefore, the arithmetic mean of all in- and out-water samples was used for total Ag endpoint calculations. The chronic C. dubia survival LC50 endpoint of 39.5 (28.2–55.5) μg/l and reproduction IC25 of 25.5 (12.2–34.3) were less sensitive to PVP-AgNPs relative to the acute test LC50 (). Unlike total Ag concentrations, a substantial increase in dissolved Ag was observed between in- and out-water samples (Supplementary Material, Table S3). Therefore, a time-weighted average approach was employed for endpoint calculations expressed as dissolved Ag. As discussed above for total measurable Ag, chronic survival (LC50 = 1.4 (0.8–2.3) μg/l) and reproduction (IC25 = 0.7) were less sensitive than acute survival (). These values are comparable to the chronic toxicity of dissolved Ag (as AgNO3), suggesting the dissolved phase best explains both the acute and chronic toxicity of the PVP-AgNPs. Lesser sensitivity in chronic endpoints has been repeatedly observed for both aqueous Ag and AgNPs (Allen et al., Citation2010; Hoheisel et al., Citation2012; Mackevica et al., Citation2015) and is likely related to reduced bioavailability due to the presence of food in chronic tests.
Conclusion
The framework presented () provides a more prescriptive strategy for selecting aquatic ecotoxicology methods, media, duration and monitoring frequency to estimate ENM exposure during aquatic toxicity bioassays to supplement previous testing recommendations (Collier et al., Citation2015; Hund-Rinke et al., Citation2015; Potthoff et al., Citation2015). It is recognized that the framework must allow flexibility and be supplemented with expertise and case-specific decisions by the investigator due to the diversity of ENM behaviors, bioassay-specific issues, region-specific testing requirements and site-specific conditions of the receiving environments. However, the three case studies demonstrate how the framework can provide a consistent starting point for assessing the aquatic hazard of ENMs. For ENMs that are less stable in aqueous suspension, the accuracy and reliability of toxicological endpoints is improved by increased frequency of monitoring and characterization of organism exposure. The frequency of sampling and monitoring is determined by the investigator based on the kinetic rates determined in the pretest. As described in Collier et al. (Citation2015), additional testing under Tier V of the tiered framework may be useful where unique toxic responses or mechanisms of action need to be investigated to fully assess ENM hazard and risk. A broader benefit of the tiered framework is its potential to foster a consistent approach to ecotoxicity testing ENMs. The resulting, more consistently generated data may accelerate the development of ENM databases to foster comparability and predictive tools that might ultimately reduce testing needs. Finally, decisions concerning the extent of efforts to modify test procedures to, for example, produce stable exposures rather than accept exposure variability will likely be subject to regulatory decisions and guidance yet to be resolved (Beaudrie et al. Citation2013a,Citationb; Petersen et al., Citation2015) but need to be considered in full risk or life cycle assessments (Holden et al., Citation2016, Godwin et al., Citation2015). Thus, we caveat that these environmental exposure considerations and regulatory uncertainties are not addressed in the framework and are outside the scope of this hazard data generation focused manuscript.
Supplementary Materials
Download Zip (2.1 MB)Acknowledgements
We thank three anonymous reviewers for constructive comments which improved clarity. Permission was granted by the Chief of Engineers to publish this information.
Disclosure statement
The authors report no conflict of interest.
Additional information
Funding
Related Research Data
References
- Allen HJ, Impellitteri CA, Macke DA, Heckman JL, Poynton HC, Lazorchak JM, et al. 2010. Effects from filtration, capping agents, and presence/absence of food on the toxicity of silver nanoparticles to Daphnia magna. Environ Toxicol Chem 29:2742–50.
- American Society for Testing and Materials (ASTM). 2006. Standard terminology relating to nanotechnology. E2456-06. In: ASTM Standards on Environmental Sampling, Vol. 14.02; American Society for Testing and Materials: Conshohocken, PA, 2000.
- Arndt DA, Moua M, Chen J, Klaper RD. 2013. Core structure and surface functionalization of carbon nanomaterials alter impacts to daphnid mortality, reproduction, and growth: acute assays do not predict chronic impacts. Environ Sci Technol 47:9444–52.
- Arts JH, Hadi M, Irfan MA, Keene AM, Kreiling R, Lyon D, et al. 2015. A decision-making framework for the grouping and testing of nanomaterials (DF4nanoGrouping). Regul Toxicol Pharmacol 71:S1–S27.
- Beaudrie CE, Satterfield T, Kandlikar M, Harthorn BH. 2013a. Expert views on regulatory preparedness for managing the risks of nanotechnologies. PLoS One 8:e80250.
- Beaudrie CE, Kandlikar M, Satterfield T. 2013b. From cradle-to-grave at the nanoscale: gaps in US regulatory oversight along the nanomaterial life cycle. Environ Sci Technol 47:5524–34.
- Bell IR, Ives JA, Jonas WB. 2014. Nonlinear effects of nanoparticles: biological variability from hormetic doses, small particle sizes, and dynamic adaptive interactions. Dose Response 12:202–32.
- Coleman JG, Kennedy AJ, Bednar AJ, Ranville JF, Laird JG, Harmon AR, et al. 2013. Comparing the effects of nanosilver size and coating variations on bioavailability, internalization, and elimination, using Lumbriculus variegatus. Environ Toxicol Chem 23:2069–77.
- Coleman JG, Kennedy AJ, Harmon AR. 2015. Environmental Consequences of Nanotechnologies: Nanoparticle Dispersion in Aqueous Media: SOP-T-1. ERDC/EL SR-15-2. Vicksburg, MS: U.S. Army Engineer Research and Development Center.
- Coleman JG, Kennedy AJ, Stanley JK, Rabalais L. 2017a. Environmental Consequences of Nanotechnologies: Sediment Spiking Methodologies for Nanomaterial Powders and Aqueous Suspensions for Aquatic Toxicity Bioassays: SOP-T-3. ERDC/EL SR-17-X. Vicksburg (MS): U.S. Army Engineer Research and Development Center.
- Coleman J, Butler A, Harmon A, Kennedy A. 2017b. Environmental Consequences of Nanotechnologies Scientific Operating Procedure SOP-T-4: Soil Spiking Methodologies for Nanomaterials. ERDC/EL SR-17-X. Vicksburg, MS: U.S. Army Engineer Research and Development Center.
- Coll C, Notter D, Gottschalk F, Sun T, Som C, Nowack B. 2016. Probabilistic environmental risk assessment of five nanomaterials (nano-TiO2, nano-Ag, nano-ZnO, CNT, and fullerenes). Nanotoxicology 10:436–44.
- Collier ZA, Kennedy AJ, Poda AR, Cuddy MF, Moser RD, MacCuspie RI, et al. 2015. Tiered guidance for risk-informed environmental health and safety testing of nanotechnologies. J Nano Res 17:155.
- Diamond S, Utterback D, Andersen C, Burgess R, Hirano S, Ho K, et al. 2009. Review of OECD/OPPTS Harmonized and OECD Ecotoxicity Test Guidelines for Their Applicability to Manufactured Nanomaterials. Washington (DC): U.S. Environmental Protection Agency.
- Domingos RF, Baalousha M, Ju-Nam Y, Reid MM, Tufenkji N, Lead JR, et al. 2009. Characterizing manufactured nanoparticles in the environment: multimethod determination of particle sizes. Environ Sci Technol 43:7277–84.
- El Badawy AM, Luxton TP, Silva RG, Scheckel KG, Suidan MT, Tolaymat TM. 2010. Impact of environmental conditions (pH, ionic strength, and electrolyte type) on the surface charge and aggregation of silver nanoparticles suspensions. Environ Sci Technol 44:1260–6.
- European Centre for Ecotoxicology and Toxicology of Chemicals. 1996. Aquatic Toxicity Testing of Sparingly Soluble, Volatile and Unstable Substances. ECETOC Monograph. Brussels, Belgium.
- Garner KL, Suh S, Lenihan HS, Keller AA. 2015. Species sensitivity distributions for engineered nanomaterials. Environ Sci Technol 49:5753–9.
- Godwin H, Nameth C, Avery D, Bergeson LL, Bernard D, Beryt E, et al. 2015. Nanomaterial categorization for assessing risk potential to facilitate regulatory decision-making. ACS Nano 9:3409–17.
- Griffitt RJ, Luo J, Gao J, Bonzongo JC, Barber DS. 2008. Effects of particle composition and species on toxicity of metallic nanomaterials in aquatic organisms. Environ Toxicol Chem 27:1972–8.
- Handy RD, van den Brink N, Chappell M, Mühling M, Behra R, Dušinská M, et al. 2012. Practical considerations for conducting ecotoxicity test methods with manufactured nanomaterials: what have we learnt so far? Ecotoxicology 21:933–72.
- Hansen SF, Jensen KA, Baun A. 2014. NanoRiskCat: a conceptual tool for categorization and communication of exposure potentials and hazards of nanomaterials in consumer products. J Nano Res 16:2195.
- Harmon AR, Kennedy AJ, Poda AR, Bednar AJ, Chappell MA, Steevens JA. 2014. Determination of nanosilver dissolution kinetics and toxicity in an environmentally relevant aqueous medium. Environ Toxicol Chem 33:1783–91.
- Hendren CO, Lowry GV, Unrine JM, Wiesner MR. 2015. A functional assay-based strategy for nanomaterial risk forecasting. Sci Total Environ 536:1029–37.
- Hoheisel SM, Diamond S, Mount D. 2012. Comparison of nanosilver and ionic silver toxicity in Daphnia magna and Pimephales promelas. Environ Toxicol Chem 31:2557–63.
- Holden PA, Gardea-Torresdey J, Klaessig F, Turco RF, Mortimer M, Hund-Rinke K, et al. 2016. Considerations of environmentally relevant test conditions for improved evaluation of ecological hazards of engineered nanomaterials. Environ Sci Technol 50:6124–45.
- Hund-Rinke K, Herrchen M, Schlinch K, Schwirn K, Volker D. 2015. Test strategy for assessing the risks of nanomaterials in the environment considering general regulatory procedures. Environ Sci Eur 27:24.
- Hund-Rinke K, Baun A, Cupi D, Fernandes TF, Handy RD, Kinross JH, et al. 2016. Regulatory ecotoxicity testing of nanomaterials – proposed modifications of OECD test guidelines based on laboratory experience with silver and titanium dioxide nanoparticles. Nanotoxicology. 10:1442–7.
- Hull MS, Kennedy AJ, Steevens JA, Bednar AJ, Weiss CA, Vikesland PJ. 2009. Release of metal impurities from carbon nanomaterials influences aquatic toxicity. Environ Sci Technol 43:4169–74.
- Hull M, Kennedy AJ, Detzel C, Vikesland PJ, Chappell MA. 2012. Moving beyond mass: the unmet need to consider dose metrics in environmental nanotoxicology studies. Environ Sci Technol 46:10881–2.
- Jahnel J. 2015. Conceptual questions and challenges associated with the traditional risk assessment paradigm for nanomaterials. Nanoethics 9:261–76.
- Kennedy AJ, Hull MS, Steevens JA, Dontsova KM, Chappell MA, Gunter JC, Weiss CA. 2008. Factors influencing the partitioning and toxicity of nanotubes in the aquatic environment. Environ Toxicol Chem 27:1932–41.
- Kennedy AJ, Chappell MA, Bednar AJ, Ryan AC, Laird JG, Stanley JK, Steevens JA. 2012. Impact of organic carbon on the stability and toxicity of fresh and stored silver nanoparticles. Environ Sci Technol 46:10772–80.
- Kennedy AJ, Lotufo GR, Steevens JA. 2015a. Review of Dredged Elutriate Application Factors: Relevance to Acute-to-Chronic Protection, Contaminant, and Endpoint Specificity. ERDC/EL TR-15-10. Vicksburg (MS): U.S. Army Engineer Research and Development Center.
- Kennedy AJ, Hull MS, Diamond S, Chappell MA, Bednar AJ, Laird JG, et al. 2015b. Gaining a critical mass: a dose metric conversion case study using silver nanoparticles. Environ Sci Technol 49:12490–9.
- Klaine SJ, Alvarez P, Batley GE, Fernandes TF, Handy RD, Lyon DY, et al. 2008. Nanomaterials in the environment: behavior, fate, bioavailability, and effects. Environ Toxicol Chem 27:1825–51.
- Li S, Wallis LK, Diamond SA, Ma H, Hoff DJ. 2014. Species sensitivity and dependence on exposure conditions impacting the phototoxicity of TiO2 nanoparticles to benthic organisms. Environ Toxicol Chem 33:1563–9.
- Liu J, Hurt RH. 2010. Ion release kinetics and particle persistence in aqueous nano-silver colloids. Environ Sci Technol 44:2169–75.
- Lowry GV, Gregory KB, Apte SC, Lead JR. 2012. Transformations of nanomaterials in the environment. Environ Sci Technol 46:6893–9.
- Ma H, Brennan A, Diamond SA. 2012. Phototoxicity of TiO2 nanoparticles under solar radiation to two aquatic species: Daphnia magna and Japanese medaka. Environ Toxicol Chem 31:1621–9.
- MacCuspie RI, Allen AJ, Martin MN, Hackley VA. 2013. Just add water: reproducible single dispersed silver nanoparticle suspensions on-demand. J Nano Res 15:1–12.
- Mackevica A, Skjolding LM, Gergs A, Palmqvist A, Baun A. 2015. Chronic toxicity of silver nanoparticles to Daphnia magna under different feeding conditions. Aquat Toxicol 161:10–16.
- Organisation of Economic Cooperation and Development (OECD). 2000. Guidance Document on Aquatic Toxicity Testing of Difficult 1106 Substances and Mixtures. Paris: Organisation for Economic Co-operation and Development.
- Organisation of Economic Cooperation and Development (OECD). 2012. Test No. 211: Daphnia magna Reproduction Test. Paris, France: OECD.
- Organisation of Economic Cooperation and Development (OECD). 2016. Categorisation of Manufactured Nanomaterials. Workshop Report. Series on the Safety of Manufactured Nanomaterials, No. 66. Paris, France: Organisation for Economic Co-Operation and Development. Available from: http://www.oecd.org/officialdocuments/publicdisplaydocumentpdf/?cote=env/jm/mono(2016)9&doclanguage=en.
- Petersen EJ, Diamond SA, Kennedy AJ, Goss GG, Ho K, Lead JR, et al. 2015. Adapting OECD aquatic toxicity tests for use with manufactured nanomaterials: key issues and consensus recommendations. Environ Sci Technol 49:9532–47.
- Poda AR, Bednar AJ, Kennedy AJ, Harmon A, Hull M, Mitrano DM, et al. 2011. Characterization of silver nanoparticles using flow-field flow fractionation interfaces to inductively coupled plasma spectroscopy. J Chromatogr A 1218:4219–25.
- Potthoff A, Weil M, Meiβner T, Kühnel D. 2015. Towards sensible toxicity testing for nanomaterials: proposal for the specification of test design. Sci Technol Adv Mater 16:065006.
- Romer I, White TA, Baalousha M, Chipman K, Viant MR, Lead JR. 2011. Aggregation and dispersion of silver nanoparticles in exposure media for aquatic toxicity tests. J Chromatogr A 1218:4226–33.
- Saleh NB, Nabiul Afrooz ARM, Bisesi JH, Aich N, Plaza-Tuttle J, Sabo-Attwood T. 2014. Emergent properties and toxicological considerations for nanohybrid materials in aquatic systems. Nanomaterials 4:372–407.
- Taurozzi JS, Hackley VA, Wiesner MR. 2011. Preparation of a nanoscale TiO2 aqueous dispersion for toxicological or environmental testing Ver. 1.1. Gaithersburg, MD: National Institute of Standards and Technology. Available from: http://dx.doi.org/10.6028/NIST.SP.1200-3
- Taurozzi JS, Hackley VA, Wiesner MR. 2013. A standardised approach for the dispersion of titanium dioxide nanoparticles in biological media. Nanotoxicology 7:389–401.
- Tejamaya M, Romer I, Merrifield RC, Lead JR. 2012. Stability of citrate, PVP, and PEG coated silver nanoparticles in ecotoxicology media. Environ Sci Technol 46:7011–17.
- US Environmental Protection Agency (EPA). 1996. Ecological Effects Test Guidelines: OPPTS 850.1000 Special Considerations for Conducting Aquatic Laboratory Studies. United States Environmental Protection Agency. Prevention, Pesticides and Toxic Substances (7101). EPA 712–C–96–113. Washington, D.C.
- US Environmental Protection Agency (EPA). 2002a. Methods for Measuring the Acute Toxicity of Effluents and Receiving Waters to Freshwater and Marine Organisms, 4th ed. EPA-821-R-02-012, Washington (DC): Office of Water.
- US Environmental Protection Agency. 2002b. Short-Term Methods for Estimating the Chronic Toxicity of Effluents and Receiving Waters to Freshwater Organisms, 4th ed. EPA 821/R-02/013. Washington (DC): Office of Water, U.S. Environmental Protection Agency.
- US Environmental Protection Agency (US EPA)/Army Corps of Engineers (ACE). 1998. Evaluation of Material Proposed for Discharge to Waters of the US Testing Manual (Inland Testing Manual). EPA/823/B-98/004. Washington (DC): US Environmental Protection Agency.