
Abstract
Labeling of aerosol particles with a radioactive, magnetic, or optical tracer has been employed to confirm particle localization in cell compartments, which has provided useful evidence for correlating toxic effects of inhaled particles. However, labeling requires several physicochemical steps to identify functionalities of the inner or outer surfaces of particles, and moreover, these steps can cause changes in size, surface charge, and bioactivity of the particles, resulting in misinterpretations regarding their toxic effects. This study addresses this challenging issue with a goal of introducing an efficient strategy for constantly supplying labeled aerosol particles in a single-pass configuration without any pre- or post-physicochemical batch treatments of aerosol particles. Carbon black (CB, simulating combustion-generated soot) or calcium carbonate (CC, simulating brake-wear fragments) particles were constantly produced via spark ablation or bubble bursting, respectively. These minute particles were incorporated with fluorescein isothiocyanate-poly(ethylene glycol) 2-aminoethyl ether acetic acid solution at the orifice of a collison atomizer to fabricate hybrid droplets. The droplets successively entered a diffusion dryer containing 254-nm UV irradiation; therefore, the droplets were dynamically stiffened by UV to form fluorescent probes on particles during solvent extraction in the dryer. Particle size distributions, morphologies, and surface charges before and after labeling were measured to confirm fluorescence labeling without significant changes in the properties. In vitro assays, including confocal imaging, were conducted to confirm the feasibility of the labeling approach without inducing significant differences in bioactivity compared with untreated CB or CC particles.
Introduction
Human exposure to fine aerosol particles (<1 μm) by inhalation and direct dermal contact can occur in our daily lives, including our work environments. In particular, inhalation exposures to engineered aerosol particles from manufacturing, material processing, or transportation (e.g. combustion and mechanical wear) have received a lot of attention during recent advances in nano-, energy-environmental, biomedical, and information technologies because health effects (e.g. cardiovascular diseases and cancer) of inhaled fine particles are well-known (Nazarenko et al. Citation2012; Myojo et al. Citation2010). Pulmonary deposition of inhalable particles provides a direct route to the blood circulation through the single-cell layered alveolar-capillary barrier of the lungs (Oberdörster and Utell Citation2002; Fröhlich and Salar-Behzadi Citation2014). The deposited particles may diffuse or penetrate the alveolar epithelial membrane where they elevate the production of reactive oxygen species (ROS) leading to oxidative stress and inflammation (Knaapen et al. Citation2004) and may be connected to pulmonary, cardiovascular, and neuronal toxicities (Fröhlich and Salar-Behzadi Citation2014; Oberdörster et al. Citation2004; Kreyling et al. Citation2002). However, many unknown issues regarding the toxic effects of fine aerosol particles need to be resolved using more efficient, technical methods, beginning with the verification of particle localization (i.e. biodistribution) that will reduce critical knowledge gaps regarding the cellular toxicities of the particles (Brandenberger et al. Citation2010).
Recently, a particle exposure system based on an air–liquid interface (ALI, relevant cells were exposed to aerosol particles at ALI) was developed to more realistically simulate in vivo particle inhalation. It was constructed to test the hazardous effects of the particles (Valle, Wu, and Zuo Citation2015; Polk et al. Citation2016). More specifically, it introduced the idea that the cellular toxicity of inhaled particles may be due to the dissolution and release of toxic components from deposited particles (Braakhuis et al. Citation2014; Naatz et al. Citation2017; Byeon et al. Citation2015). A primary challenge encountered by toxicological or biomedical researchers is the ability to rapidly visualize and measure the localization of deposited particles on the cellular interior, exterior, or the lysosomes (Fröhlich and Salar-Behzadi Citation2014; Guttenberg et al. Citation2016). The most common method for direct visualization of particle localization in complex matrices is electron microscopy that requires considerable time and expense as well as additional chemical processing and elemental analyses (Brandenberger et al. Citation2010; Guttenberg et al. Citation2016). Fluorescence-based techniques are less costly and faster than electron microscopy. These techniques have been employed in both in vitro and in vivo assays for assessing cellular uptake and biodistribution of fluorescently-labeled particles because these techniques are convenient to use, possess high sensitivity, and have the potential of multiplexing (Hoffmann et al. Citation2013). In these techniques, fluorescent probes or reporters are attached to test particles or sensor molecules, respectively, that can be excited and detected, even in a complex biomatrix using a commercial fluorescence microscope, confocal microscope, fluorimeter, etc. With fluorescently-labeled particles, advanced techniques, like fluorescence recovery after photobleaching and Forster resonance energy transfer, can be employed to quantify spatial and temporal distributions of fluorescent probes in biological specimens. Suspension-based immunoassays and flow cytometry require fluorescently-labeled colloidal particles for quantitative and qualitative analyses. Fluorescent techniques can also be employed to assess the intracellular uptake and biokinetics of inhaled particles in the lungs by incorporating fluorescent dyes into the particles (Tschernig et al. Citation2013). To perform the measurements, however, the aerosol particles to be tested should be first sampled on filter media and successively dispersed and reacted in solutions for chemical fluorescence labeling. Moreover, these steps can cause changes in size, surface charge, and bioactivity of the particles. This may result in misinterpretations regarding their toxic effects because the site and extent of particle deposition and subsequent translocation/biodistribution after inhalation are influenced by the size and surface properties of the particles (Yang et al. Citation2008). Therefore, direct and continuous approaches without multi-step wet chemical steps (i.e. a more realistic route of exposure) for developing and fabricating appropriately-labeled particles are highly desirable for maintaining the original properties of testing particles.
The present study introduces direct fluorescent labeling in a single-pass continuous manner producing an efficient means for biological assessment of inhalable particles. Carbon black (CB) and calcium carbonate (CC) were selected as simulated aerosol particles because they are known to be representative components of combustion-generated soot (Lindner et al. Citation2017) and brake-wear fragments (Peikertová et al. Citation2013), respectively. CB and CC aerosol particles were produced by spark ablation and bubble bursting, respectively. The CB or CC particle-laden flow was directly connected to a collison atomizer containing a solution of fluorescein isothiocyanate (FITC) and poly(ethylene glycol) 2-aminoethyl ether acetic acid (NH2PEGCOOH) to fabricate hybrid droplets. The droplets were then dynamically stiffened by UV in a diffusion dryer to form FITC-labeled CB or CC particles. Particle size and surface charge variations in the labeled CB and CC particles were evaluated, and bioactivities of the FITC-labeled CB and CC particles were analyzed as well to validate the feasibility of the proposed strategy. FITC labeling of CB and CC particles was proven by observing cellular uptake and localization, which were confirmed by flow cytometry and confocal microscopic analyses, respectively.
Methods
Simulated inhalable engineered particles
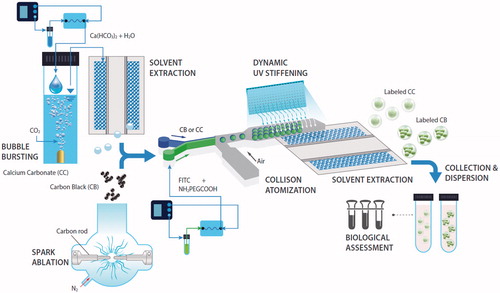
As shown in , CB particles were prepared by spark ablation. In particular, a direct high voltage current (3 kV) was applied between two graphite rods (C-072561, Nilaco, CAS Number: 7782-42-5, Tokyo, Japan) to induce spark ablation in the presence of nitrogen gas flow (3 L min−1). The vaporized graphite from spark ablation was subsequently condensed into CB particles by the gas flow. To prepare CC particles, carbon dioxide gas was supplied at a flow rate of 3 L min−1 to a bubble bursting reactor containing an aqueous solution (100 mL) of 0.2 g Ca(HCO3)2 (RW0168617, Rosewachem, CAS Number: 3983-19-5, Chongqing City, China). Droplets from the reactor were then passed through a diffusion dryer to extract solvent from the droplets, resulting in the formation of CC particles. The resulting particles were diluted (dilution ratio = 5) with nitrogen gas to prevent agglomeration.
Figure 1. Schematic of direct fluorescence labeling of CB and CC particles in a single-pass aerosol configuration. Aerosol-produced CB (spark ablation) and CC (bubble bursting) particles are directly incorporated with FITC-NH2PEGCOOH droplets (collison atomizer) and subsequently injected into a UV irradiation diffusion dryer for dynamic stiffening of FITC-NH2PEGCOOH on particle surfaces. The “labeled particles” are compared with untreated CB and CC particles by cytotoxicity assays and cellular uptake analyses.
Direct FITC labeling of CB or CC particles
The CB or CC particle-laden flow was directly injected into a single-jet collison atomizer (operating at 30 psi, HCT, Icheon, South Korea) containing a labeling solution for fabricating hybrid droplets (i.e. CB or CC inserted into FITC-NH2PEGCOOH droplets). The labeling solution consisted of 3.7 mg of NH2PEGCOOH (Mn 5000; Sigma-Aldrich, CAS Number: 139729-28-5, St. Louis, MO) and 9.4 mg of the FITC isomer I (Sigma-Aldrich, CAS Number 3326-32-7, St. Louis, MO) dissolved in 5 mL of ethanol. These two materials were chosen to provide a covalent labeling of FITC that could prevent fluorescence loss in culture media or inside the cells (Schulz et al. Citation2009). The hybrid droplets were then passed through a diffusion dryer under UV (λ = 254 nm, 760 µW cm−2, 50 mm D × 220 mm L, 1.7 min residence time) irradiation to remove the solvent from the droplets. The wall loss of the droplets during the stiffening was detected as ∼4.1% (number concentration basis). FITC-NH2PEGCOOH was dynamically stiffened by UV on CB or CC particles during solvent extraction. The adsorbed NH2PEGCOOH on CB or CC particles introduced a covalent linkage of amine-reactive FITC under UV irradiation.
Physicochemical characterizations
Size distributions of the testing particles (individual CB and CC and labeled CB and CC) in the gaseous- and liquid phases were measured using a scanning mobility particle sizer (SMPS, 3936, TSI, Shoreview, MN) containing a long differential mobility analyzer and dynamic light scattering (DLS) particle size analyzer (Nano-ZS, Malvern Instruments, Malvern, UK), respectively. Surface charges of the particles were evaluated by measuring zeta potentials of the particles in phosphate buffer saline (PBS, pH 7.4) solution also using the Nano-ZS instrument with DTS software (version 5.0, Malvern Instruments, Malvern, UK). Morphologies of the particles on carbon-coated copper grids (Tedpella, Redding, CA) were analyzed using transmission electron microscope (TEM, CM-100, FEI/Philips, Hillsboro, OR) at an accelerating voltage of 46–180 kV. A field emission scanning electron microscope (S-4800, Hitachi, Tokyo, Japan) was also employed to measure morphologies of FITC-labeled CB and CC particles. FITC labeling on CB and CC particles was confirmed using Fourier transform infrared spectroscopy (FTIR, Nicolet 6700, Thermo Electron, Madison, WI) and UV–Vis spectroscopy (330, Perkin-Elmer, Shelton, CT).
Biological assays
To evaluate bioactivity and cellular localization of CB, labeled CB, CC, and labeled CC particles, human alveolar epithelial (A549) cells were employed. These cells have similar properties to lung tissue, such as the production of surfactant, secretion of cytokines, and biotransformation of xenobiotics (phases I and II). To compare cell proliferations between the tested particles, the 3-(4,5-dimethyl-2-thiazolyl)-2,5-diphenyltetrazolium bromide (MTT) assay was performed. A549 cells were cultured in Dulbecco’s modified Eagle’s medium (DMEM) (HyClone, GE Healthcare Biosciences, Pittsburgh, PA) containing 10% heat-inactivated fetal bovine serum and supplemented with antibiotics (100 units mL−1 penicillin, 100 μg mL−1 streptomycin, and 250 ng mL−1 amphotericin B). They were grown at 37 °C in a 5% CO2-humidified incubation chamber. Viable cells (105 cells well−1) were plated in 96-well microtiter plates (Nunc, Thermo Fisher Scientific, Waltham, MA) and incubated for 24 h to allow cell attachment. The selected particle concentrations (10–100 µg mL−1) were added to plates. After 24 h, the cells were incubated with 0.5 mg mL−1 MTT reagent for 2 h in the dark. Isopropyl alcohol containing 40 mM HCl was then added to the culture medium (3:2, by volume), and the cells were mixed using a pipette until the formazan was completely dissolved. The absorbance of each sample was measured at 570 nm using an ELISA plate reader (Thermo Multiskan Spectrum, Waltham, MA). Cell viability in percentage was calculated as Asample/Acontrol × 100, where Asample is the absorbance of samples and Acontrol is the absorbance of control cells. A lactate dehydrogenase (LDH) leakage assay was performed with tetrazolium salt using the Cytotoxicity Detection Kit PLUS (Roche Diagnostics, Mannheim, Germany) according to the manufacturer’s protocol. LDH is a widely present cytosolic enzyme that converts lactate to pyruvate. This enzyme leaks into the media and its extracellular levels are elevated when cell membrane integrity is compromised. The assay was performed by measuring the amount of formazan salt at 492 nm using the ELISA plate reader. The maximum amount of LDH was determined by incubating the cells with a lysis solution that was provided in the kit. Cell-mediated ROS, which is the marker of intracellular oxidative stress, was detected using 2′,7′-dichlorodihydrofluorescein diacetate (DCFH-DA). A549 cells were incubated with the particles for 24 h. After washing with PBS, the cells were cultured in serum-free DMEM containing 10 μM DCFH-DA for 30 min at 37 °C. The cells were then washed with PBS, harvested by enzymatic release with 0.25% trypsin, washed once again with PBS, and re-suspended in 500 μL PBS. DCFH-DA was hydrolyzed and oxidized to fluorescent 2′,7′-dichlorofluorescein (DCF) in the presence of ROS. DCF formed in the PBS-suspended cells was excited with a 488-nm argon ion laser in a flow cytometry system, and the emission was recorded at 525 nm. Caspase-3 activity in A549 cells during incubation with the particles was measured using a fluorometric caspase-3 assay kit (ab39383, Abcam, Cambridge, UK). The cells incubated with the particles were harvested by applying 0.25% trypsin, washed with cold PBS, and re-suspended on ice for 10 min in lysis buffer (150 mM NaCl, 50 mM Tris-HCl, pH 7.4), 50 mM NaF, 5 mM ethylenediaminetetraacetic acid, 0.5% Triton X-100, and 1 mM Na3VO4 (protease inhibitor). Nuclear and unlyzed cellular debris were removed by centrifugation at 10,000 × g for 1 min. The protein concentration was determined by bicinchoninic acid assay (BCA) method using a BCA protein assay kit (Thermo Fisher Scientific, Waltham, MA) with bovine serum albumin as a standard. Caspase-3 activity was measured by the fluorescent detection of free 7-amino-4-trifluoromethyl coumarin (AFC) after it was cleaved from the peptide substrate [Ac-Asp-Glu-Val-Asp peptide-conjugated AFC (DEVD-AFC)] at an excitation of 400 nm and an emission of 505 nm using a fluorescence multi-well plate reader (Fluoroskan Ascent, ThermoLab, Ansan, Korea). To visualize the intracellular uptake of labeled particles by A549 cells, confocal laser scanning microscopy (CLSM, Leica Microsystems, Wetzlar, Germany) was employed. A suspension of A549 cells (2 × 10⁴ cells mL−1) was grown on round coverslips placed in 12-well plates and incubated for 24 h. The labeled particles were then added to each well and incubated for 10 min. Cells were washed with 2 mL PBS and fixed with 4% paraformaldehyde solution in the dark. The coverslips were rinsed with PBS twice, mounted on glass slides, and sealed with glycerin. Cells were observed using CLSM. The cellular uptake of labeled particles was also studied using a fluorescence-activated cell sorter (BD Biosciences, San Jose, CA). Cells at a concentration of 2 × 10⁴ cells well−1 were seeded in a 12-well plate for 12 h. The cells were then incubated with labeled particles for 2, 4, and 6 h. Cells were washed with PBS, harvested using a sterile spatula, and finally re-suspended in 1.5 mL PBS for flow cytometric analysis.
Results
Physicochemical characterizations
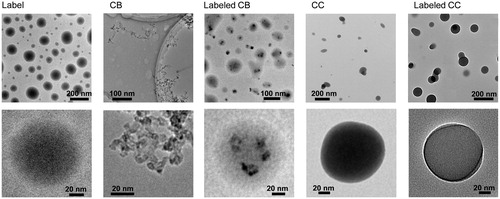
The size distributions of particles (untreated CB, labeled CB, untreated CC, and labeled CC including the individual label) measured by SMPS (<2.2%, temporal change in size) are shown in . Their geometric mean diameter, geometric standard deviation, and total number concentration are summarized in Supplemental Material (Table S1). The sizes of CB and CC particles ranged from 40 to 300 nm, and this range is known as the minimum collection efficiency region for conventional air filtration (Lee and Liu Citation1980). Thus, labeling particles in this size range were considered appropriate for understanding their bioactivity after respiratory deposition. In all cases, Gaussian distributions indicated normality with no additional peaks, even for the labeled particles, implying that the label was evenly distributed throughout CB or CC particles. The original size distributions of CB () and CC () particles were not significantly different after the incorporation of fluorescent probes; slight increases in size distribution were shown because of the uniform deposition of the probes on the CB and CC particles. This may be due to capillary suction of the probes from voids between the primary carbon particles of CB agglomerates (Byeon and Kim Citation2013) and adsorption of probes on CC pores (Byeon Citation2016) and thus resulted in the tight conjugation of the probes on CB and CC surfaces during simultaneous UV stiffening and solvent extraction (). This hypothesis is consistent with the morphologies of labeled CB and CC particles confirmed by TEM measurements () which were used to derive core (CB or CC)-shell (fluorescent label, FITC-NH2PEGCOOH) configurations. Even though the morphologies of CB and CC particles are different, nearly all CB or CC particles remained tightly bound with FITC-NH2PEGCOOH during solvent extraction because of their conjugations. According to image analysis of 400 resulting particles, the yield of conjugation was approximately 94.8%. There is only a slight difference in morphology between the labeled CB and CC particles; the spherical nature of the labeled CC particles is more obvious than that of labeled CB because of a rather spherical shape of the CC backbone. These findings were further confirmed with DLS measurements (Supplemental Material, Figure S1) which did not show any significant changes in size distribution, even after dispersion. Although there are some differences in size distribution between SMPS and DLS measurements because of different detection principles and phases, both measurements verified that the labeling did not significantly affect the original size distributions of CB and CC particles because of the tight conjugation. The conjugation intensity (δ) of fluorescent probes on CB and CC particles was determined via the following equation (Byeon and Park Citation2016):
(1)
where R is the number concentration ratio between untreated particles (CB or CC) and fluorescent probes, and Dρ is the mean diameter of labeled CB or CC particles. The R value was selected by changing (trial-and-error approach) the concentration of FITC-NH2PEGCOOH (in ethanol), and the optimal concentration was found to be 2.62 mg mL−1. Resulting number concentrations for the estimation were noted in Table S1 (Supplemental Material). Intensities were found to be 3.32 × 10⁻⁵ and 3.1 × 10⁻⁵ nm−2 for labeled CB and CC particles, respectively. In addition, zeta potentials were measured to investigate the surface properties of untreated and labeled CB and CC particles (Supplemental Material, Table S2). The incorporation of NH2PEGCOOH for efficient bindings between the CB or CC particles and FITC for direct labeling prevented unwanted significant changes (labeled CB: –7.8 ± 0.6 mV and labeled CC: –13.7 ± 0.9 mV) in the surface charge of the untreated CB (–7.4 ± 0.4 mV) and CC (–13.2 ± 1.1 mV) particles that may not be resulted in a misinterpretation regarding different surface charges.
Figure 2. Particle size distributions of a untreated and labeled CB particles and b untreated and labeled CC particles, including collison atomized-dried FITC-NH2PEGCOOH or “labeling probe.” Size distributions were measured using SMPS, which consisted of a differential mobility analyzer, condensation particle counter, and aerosol charge neutralizer.
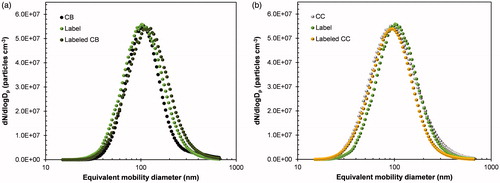
Figure 3. Low- and high-magnification TEM images of untreated CB, labeled CB, untreated CC, and labeled CC particles including individual labeling probes. Specimens are prepared by direct aerosol deposition of particles on carbon-coated copper grids.
The labeling was further evaluated using UV–Vis and FTIR analyses. Figure S2 (Supplemental Material) shows the absorption spectra of untreated and labeled CB and CC particles (dispersed in PBS) in comparison with that of the labeling solution. The labeled CB and CC particles show intense and narrow absorption peaks at approximately 450 nm which coincide with those of the labeling solution, which is consistent with the reported typical absorption peak for green fluorescent FITC (Liu et al. Citation2009). The presence of the typical absorption peak of FITC confirms direct labeling of FITC on the particles in a single-pass aerosol configuration. The fluorescence intensity of labeled CB particles was lower than that of labeled CC particles along with a slight red shift. This may be due to the quenching effect of CB on FITC (Shojaei et al. Citation2016). Nevertheless, a typical greenish yellow color remained and no blackish precipitates could be observed during labeled CB dispersion (Supplemental Material, inset of Figure S2), although the color of CB particles is blackish, implying that the CB particle surfaces were covered and tightly-associated with FITC-NH2PEGCOOH. In FTIR measurements (Supplemental Material, Figure S3) of the dried forms (i.e., powders on ultrahydrophobic polyteterafluoroethylene substrates, Supplemental Material, inset of Figure S2), the CB particles showed bands corresponding to the C = C graphitic stretching mode (ca 1590 cm−1) and C–H bonds of CH3 (ca 1320–1460 cm−1). The CC particles showed the band at 1440 cm−1, which could be attributed to the CO32– groups, indicating that they were crystalline calcite in form. The collison atomized and dried labeling sample showed characteristic bands at approximately 1000, 1450, 1600, 1750, 2100, and 2900 cm−1, which came from the functional groups in FITC and NH2PEGCOOH. The labeled CB particles presented these characteristic bands with decreased intensities, whereas the same bands for the labeled CC particles remained intense and comparable with those for the individual labeling sample. This tendency is consistent for the UV-spectra of labeled particles. Even though the state of the specimens (dispersion or powder) affected the intensities of their characteristic bands for labeled samples, the results still signify that the direct labeling approach may be feasible for assigning stable and measurable fluorescent properties on inhalable aerosol particles.
Biological assays
To assess the toxicity induced by labeling, MTT and LDH assays were employed for studying the cytotoxic effects of different concentrations of labeled particles (0–100 μg mL−1) on A549 cells. In the MTT assay (), increase in the concentration of untreated particles showed decreases in cell viability after 24-h incubation. Cell viabilities of cells with untreated CC particles were lower than those of cells with untreated CB, implying that CB is more biocompatible; this result is consistent with the reported cytotoxicities observed in previous studies (Yan et al. Citation2006; Horie et al. Citation2014). Even though slight differences are confirmed between the CB and CC particles, the labeling did not significantly alter the effect of original particles on the viability of A549 cells. The results of LDH release () because of plasma membrane disruption were consistent with the results of MTT assay further confirming greater LDH release for CC particles and overall higher particle concentrations. Results of the LDH assay also indicated no significant changes after labeling; thus, the labeling may not affect bioactivity analyses of the original particles. Oxidative stress () was assessed using the DCFH-DA assay that measures the intracellular generation of ROS from cellular damage and apoptosis. The ROS values were also proportional to particle concentrations for both untreated and labeled particles, consistently showing an inverse correlation between decreased cell viability and increased ROS levels at all particle concentrations. Caspase-3 activity () was further evaluated to conclude the similarity between untreated and labeled particles. This is because ROS, which is generated by treated particles, may induce the release of mitochondrial proteins into the cytoplasm (Sun et al. Citation2012) that could promote proteolytic caspase-3 activity, leading to particle-induced apoptosis. The particle dose-dependent manner could be verified only in this assay, and this implies that the secured analogies in particle size distribution, surface charge, and base particle composition between the untreated and labeled particles may establish the primary basis for a more efficient biokinetic study and visualization of inhaled particles to reduce knowledge gaps in in vitro and in vivo models of inhalation toxicity.
Figure 4. Bioactivities of untreated CB, labeled CB, untreated CC, and labeled CC particles on A549 cells. (a) Cytotoxicities, (b) LDH activities, (c) intracellular ROS, and (d) caspase-3 activities of A549 cells treated with the different particles. All assays are conducted in a concentration-dependent manner, and activities increased with particle concentration. All experiments were performed in triplicate (n = 3), and the results were reported as average values and standard deviations. The p values of untreated CB, labeled CB, untreated CC, and labeled CC particles are 0.0364, 0.0411, 0.0289, and 0.0371, respectively. The results are shown as p < 0.05 was regarded as statistically significant compared to the untreated control.
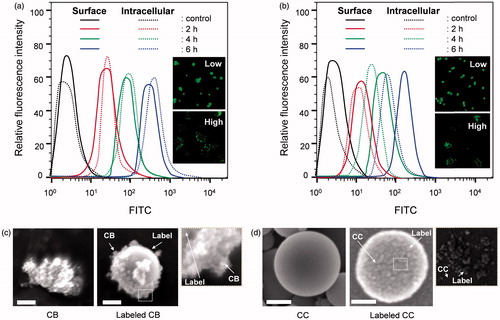
To evaluate the feasibility of direct fluorescent labeling of aerosol particles, the intracellular uptake of labeled particles by A549 cells was assessed by flow cytometry and CLSM, as shown in . Fluorescence intensities for FITC signals were obtained using appropriate filters following 2-, 4-, and 6-h incubations of labeled particles. The uptake of labeled particles was time-dependent because more cells were observed to internalize particles with increasing time. This confirms that the direct labeling method did not disrupt endocytosis for internalization of the particles by A549 cells. Cellular uptake of the labeled particles was further confirmed by CLSM to investigate localization of those particles. The CLSM micrographs clearly prove the presence of particles in the cytoplasm of cells. The high-magnification images (insets of ) show localized and discrete green dots, suggesting no significant leaching of FITC during the process. The green fluorescence was concentrated toward the periphery of the cells, revealing that the nucleus was impermeable to most of the labeled particles because of their size distributions (Supplemental Material, Table S1). This demonstrates that particle labeling did not induce a cell response to affect different particle sizes during cell-particle interactions. Although fluorescence decreased as a function of time, the fluorescence of internalized particles remained until 3rd day inside the cells, and this suggests that the labeling has a resistance to rapid photoleaching because of a tight conjugation of the fluorescence probes on the CB and CC particles.
Figure 5. Flow cytometric analyses of intracellular uptake of (a) labeled CB and (b) CC particles. Insets of both images show low- and high-magnification confocal micrographs of A549 cells with localized labeled particles. FITC labels facilitated the measurement of particle uptake and visualization of localized particles. Apparent morphologies of (c) untreated and labeled CB, and (d) untreated and labeled CC particles are shown as well, and the original shapes of CB and CC particles remain nearly the same after fluorescent labeling. Scale bars (c, d), 50 nm.
Discussion
Visualization of inhaled fine particles in cells via fluorescent labeling can provide useful evidence for verifying toxic effects. However, there is a significant issue for maintaining original properties of inhalable particles because wet chemical reactions, separations, and purifications to fabricate labeled particles could change the properties of particles that may cause misinterpretation of toxic effects. According to the physicochemical characterizations, the single-pass fluorescent labeling did not induce significant changes in size distribution, implying that particle behaviors during inhalation or in cell compartments may keep within bounds of the original particles. A tight conjugation between CB (or CC) particle and FITC-NH2PEGCOOH was proved by TEM, UV–Vis, and FITR analyses, and manipulation of the ratio between FITC and NH2PEGCOOH maintained unchanged the surface charges when fluorescent-labeled.
No significant differences between the labeled and original particles in biological assays (cytotoxicities, LDH activities, intracellular ROS, and caspase-3 activities in A549 cells) support the hypothesis, leading to nearly identical cellular behaviors with the original particles. This finding implies that the proposed dynamic stiffening under UV irradiation may not induce unexpected cellular behaviors when FITC-NH2PEGCOOH is conjugated with inhalable particles. A direct exposure of cell compartments to uncoated surfaces of CB () or CC () particles may also derive the similarity in biological assessment between the original and labeled particles because the shrinkage of labeling components on CB or CC particles in hybrid droplets during simultaneous UV stiffening and solvent extraction produced uncoated surfaces. From flow cytometry and CLSM measurements, the fluorescent labeling was available to identify cellular uptake and to visualize particle localization in cell compartments. The time-dependent uptake profiles confirm that the labeling did not disrupt endocytosis for internalization of the particles by A549 cells, and the visualized green dots in CLSM analysis suggest no significant leaching of FITC during the analysis. This implies that that the direct labeling in the aerosol-state can be utilized in in vitro analysis for bioactivity assessments of inhalable particles without unexpected cellular behaviors. Nevertheless, a more suitable labeling may be further required to minimize excessive application of FITC-NH2PEGCOOH (may induce unexpected responses in vivo from surface property and size changes), which may warrant in vivo investigation for uptake and localization of inhaled particles without significant changes in basic bioactivity. To validate this, partial and dotted aerosol coatings of fluorescent labels on inhalable particle surfaces are currently underway to validate the labeling in in vivo level for use in more realizable and wider applications.
Conclusions
Direct labeling of fluorescent probes on simulated inhalable particles was performed by dynamic stiffening of FITC-NH2PEGCOOH via UV irradiation in a single-pass aerosol configuration for efficient bioactivity analysis and visualization of localized particles. Applying the appropriate ratio between the CB or CC and FITC-NH2PEGCOOH label with the aerosol reaction system produced labeled CB and CC particles without causing significant changes in the original particle properties, such as size distribution, surface charge, and chemical composition. Because there were no changes in properties, there were also no significant differences in bioactivity (cytotoxicity, oxidative stress, and apoptosis) of the untreated and labeled particles, implying that direct labeling did not alter bioactivity of the original particles. Fluorescent probes on the particles enabled a direct assessment of cellular uptake and localization of the particles without multi-step wet chemical processes. Therefore, this methodology has a great potential to supply labeled particles for efficient bioactivity analyses of inhalable particles and could offer useful analysis platforms for extended applications to a broad range of in vivo inhalation models.
INAN_A_1378748_Supplementary_Information.docx
Download MS Word (562.9 KB)Acknowledgements
The authors thank Soo-Yeon Shim for her great assistance during the experiments for this study.
Disclosure statement
The authors report no conflicts of interest.
Additional information
Funding
References
- Braakhuis, H. M., M. V. D. Z. Park, I. Gosens, W. H. De Jong, and F. R. Cassee. 2014. “Physicochemical Characteristics of Nanomaterials that Affect Pulmonary Inflammation.” Particle and Fibre Toxicology 11: 18.
- Brandenberger, C., M. J. D. Clift, D. Vanhecke, C. Mühlfeld, V. Stone, P. Gehr, and B. Rothen-Rutishauser. 2010. “Intracellular Imaging of Nanoparticles: Is it an Elemental Mistake to Believe What You see?” Particle and Fibre Toxicology 7: 15.
- Byeon, J. H. 2016. “Photo-Derived Transformation from Modified Chitosan@Calcium Carbonate Nanohybrids To Nanosponges.” Scientific Reports 6: 28782.
- Byeon, J. H., and Y. W. Kim. 2013. “Continuous Gas-Phase Synthesis of Metal Oxide–Graphene Hybrid Nanoflakes for the Enhancement of Lithium Storage.” RSC Advances 3: 7259–7264.
- Byeon, J. H., and J. H. Park. 2016. “Easy On-Demand Single-Pass Self-Assembly and Modification to Fabricate Gold@Graphene-Based Anti-Inflammatory Nanoplatforms.” Scientific Reports 6: 34890.
- Byeon, J. H., J. H. Park, T. M. Peters, and J. T. Roberts. 2015. “Reducing the Cytotoxicity of Inhalable Engineered Nanoparticles Via in situ Passivation with Biocompatible Materials.” Journal of Hazardous Materials 292: 118–125.
- Fröhlich, E., and S. Salar-Behzadi. 2014. “Toxicological Assessment of Inhaled Nanoparticles: Role of in vivo, ex vivo, in vitro, and in silico Studies.” International Journal of Molecular Sciences 15: 4795–4822.
- Guttenberg, M., L. Bezerra, N. M. Neu-Baker, M. Del Pilar Sosa Idelchik, A. Elder, G. Oberdörster, S. A. Brenner, et al. 2016. “Biodistribution of Inhaled Metal Oxide Nanoparticles Mimicking Occupational Exposure: A Preliminary Investigation Using Enhanced Darkfield Microscopy.” Journal of Biophotonics 9: 987–993.
- Hoffmann, K., T. Behnke, D. Drescher, J. Kneipp, and U. Resch-Genger. 2013. “Near-Infrared-Emitting Nanoparticles for Lifetime-Based Multiplexed Analysis and Imaging of Living Cells.” ACS Nano 7: 6674–6684.
- Horie, M., K. Nishio, H. Kato, S. Endoh, K. Fujita, A. Nakamura, S. Kinugasa, et al. 2014. “Evaluation of Cellular Influences Caused by Calcium Carbonate Nanoparticles.” Chemico-Biological Interactions 210: 64–73.
- Knaapen, A. M., P. J. A. Borm, C. Albrecht, and R. P. F. Schins. 2004. “Inhaled Particles and Lung Cancer. Part A: Mechanisms.” International Journal of Cancer 109: 799–809.
- Kreyling, W. G., M. Semmler, F. Erbe, P. Mayer, S. Takenaka, H. Schulz, G. Oberdörster, et al. 2002. “Translocation of Ultrafine Insoluble Iridium Particles from Lung Epithelium to Extrapulmonary Organs is Size Dependent but Very Low.” Journal of Toxicology and Environmental Health 65: 1513–1530.
- Lee, K. W., and B. Y. H. Liu. 1980. “On the Minimum Efficiency and the Most Penetrating Particle Size for Fibrous Filters.” Journal of the Air Pollution Control Association 30: 377–381.
- Lindner, K., M. Ströbele, S. Schlick, S. Webering, A. Jenckel, J. Kopf, O. Danov, et al. 2017. “Biological Effects of Carbon Black Nanoparticles are Changed by Surface Coating with Polycyclic Aromatic Hydrocarbons.” Particle and Fibre Toxicology 14: 8.
- Liu, B., S. Fletcher, M. Avadisian, P. T. Gunning, and C. C. Gradinaru. 2009. “A Photostable, pH-Invariant Fluorescein Derivative for Single-Molecule Microscopy.” Journal of Fluorescence 19: 915–920.
- Myojo, T., A. Ogami, T. Oyabu, Y. Morimoto, M. Hirohashi, M. Murakami, K. Nishi, et al. 2010. “Risk Assessment of Airborne Fine Particles and Nanoparticles.” Advanced Powder Technology 21: 507–512.
- Naatz, H., S. Lin, R. Li, W. Jiang, Z. Ji, C. H. Chang, J. Köser, et al. 2017. “Safe-by-Design CuO Nanoparticles Via Fe-Doping, Cu-O Bond Length Variation, and Biological Assessment in Cells and Zebrafish Embryos.” ACS Nano 11: 501–515.
- Nazarenko, Y., H. Zhen, T. Han, P. J. Lioy, and G. Mainelis. 2012. “Potential for Inhalation Exposure to engineered nanoparticles from nanotechnology-based cosmetic powders.” Environmental Health Perspectives 120: 885–892.
- Oberdörster, G., Z. Sharp, V. Atudorei, A. Elder, R. Gelein, W. Kreyling, C. Cox, et al. 2004. “Translocation of Inhaled Ultrafine Particles to the Brain.” Inhalation Toxicology 16: 437–445.
- Oberdörster, G., and M. J. Utell. 2002. “Ultrafine Particles in the Urban Air: To the Respiratory Tract-and Beyond?.” Environmental Health Perspectives 110: 440–441.
- Peikertová, P., J. Kukutschová, I. Vávra, V. Matějka, O. Životský, M. Vaculík, P. W. Lee, et al. 2013. “Water Suspended Nanosized Particles Released from Nonairborne Brake Wear Debris.” Wear 306: 89–96.
- Polk, W. W., M. Sharma, C. M. Sayes, J. A. Hotchkiss, and A. J. Clippinger. 2016. “Aerosol Generation and Characterization of Multi-Walled Carbon Nanotubes Exposed to Cells Cultured at the Air-Liquid Interface.” Particle and Fibre Toxicology 13: 20.
- Schulz, A., S. Hornig, T. Liebert, E. Birckner, T. Heinze, and G. J. Mohr. 2009. “Evaluation of Fluorescent Polysaccharide Nanoparticles for pH-Sensing.” Organic & Biomolecular Chemistry 7: 1884.
- Shojaei, T. R., M. A. M. Salleh, K. Sijam, R. A. Rahim, A. Mohsenifar, R. Safarnejad, M. Tabatabaei, et al. 2016. “Fluorometric Immunoassay for Detecting the Plant Virus Citrus Tristeza Using Carbon Nanoparticles Acting as Quenchers and Antibodies Labeled with CdTe Quantum Dots.” Microchimica Acta 183: 2277–2287.
- Sun, T., Y. Yan, Y. Zhao, F. Guo, and C. Jiang. 2012. “Copper Oxide Nanoparticles Induce Autophagic Cell Death in A549 Cells.” PLoS One 7: e43442.
- Tschernig, T., N. T. Veith, R. Schramm, M. W. Laschke, J. Roller, M. Rosenbruch, D. Theegarten, et al. 2013. “Direct Visualisation of Microparticles in the Living Lung.” Experimental and Toxicologic Pathology: Official Journal of the Gesellschaft Fur Toxikologische Pathologie 65: 883.
- Valle, R. P., T. Wu, and Y. Y. Zuo. 2015. “Biophysical Influence of Airborne Carbon Nanomaterials on Natural Pulmonary Surfactant. ”ACS Nano 9: 5413–5421.
- Yan, A., B. W. Lau, B. S. Weissman, I. Külaots, N. Y. C. Yang, A. B. Kane, R. H. Hurt, et al. 2006. “Biocompatible, Hydrophilic, Supramolecular Carbon Nanoparticles for Cell Delivery.” Advanced Materials 18: 2373–2378.
- Yang, W., J. I. Peters, and R. O. Williams. 2008. “Inhaled Nanoparticles – A Current Review.” International Journal of Pharmaceutics 356: 239–247.