
Abstract
Magnetic mesoporous silica nanoparticles (M-MSNs) are a promising class of nanoparticles for drug delivery. However, a deep understanding of the toxicological mechanisms of action of these nanocarriers is essential, especially in the liver. The potential toxicity on HepaRG cells of pristine, pegylated (PEG), and lipid (DMPC) M-MSNs were compared. Based on MTT assay and real-time cell impedance, none of these NPs presented an extensive toxicity on hepatic cells. However, we observed by transmission electron microscopy (TEM) that the DMPC and pristine M-MSNs were greatly internalized. In comparison, PEG M-MSNs showed a slower cellular uptake. Whole gene expression profiling revealed the M-MSNs molecular modes of action in a time- and dose-dependent manner. The lowest dose tested (1.6 µg/cm2) induced no molecular effect and was defined as ‘No Observed Transcriptional Effect level.’ The dose 16 µg/cm2 revealed nascent but transient effects. At the highest dose (80 µg/cm2), adverse effects have clearly arisen and increased over time. The limit of biocompatibility for HepaRG cells could be set at 16 µg/cm2 for these NPs. Thanks to a comparative pathway-driven analysis, we highlighted the sequence of events that leads to the disruption of hepatobiliary system, elicited by the three types of M-MSNs, at the highest dose. The Adverse Outcome Pathway of hepatic cholestasis was implicated. Toxicogenomics applied to cell cultures is an effective tool to characterize and compare the modes of action of many substances. We propose this strategy as an asset for upstream selection of the safest nanocarriers in the framework of regulation for nanobiosafety.
Introduction
Mesoporous silica nanocarriers (MSNs) are one of the most promising nanomaterials for drug delivery in nanomedicine because of their outstanding features, such as easy synthesis, tunable size, tailorable pore volume, and highly versatile surface (Lu et al. Citation2010; Yang, Gai, and Lin Citation2012). Silanol groups present on the surface of MSNs can be functionalized with various ligands, which could be one way of controlling nanoparticle (NP) biodistribution and the design of specific targeted delivery systems (Bouchoucha et al. Citation2016; Li et al. Citation2016). MSNs have been widely studied for their capability to load and release various drugs (Vallet-Regí, Balas, and Arcos Citation2007; Deodhar, Adams, and Trewyn Citation2017). More specifically, by creating a core–shell structure composed of an Fe3O4 core surrounded by a mesoporous silica shell, magnetic properties have been added to MSNs (Rho et al. Citation2014; Nyalosaso et al. Citation2016). These magnetic MSNs (M-MSNs) are of particular interest in nanomedicine as targeting tools for theranostics, combining co-delivery of therapeutic and imaging functions in cancer diagnostics and therapy (Vivero-Escoto et al. Citation2010; Xie, Lee, and Chen Citation2010; Li et al., Citation2012).
The main challenge in developing effective nanocarriers is to achieve a design that combines optimal targeted delivery, biocompatibility of the nanocarrier itself in order to avoid collateral cell toxicity, and a stealth capability to escape the rapid clearance triggered by the immune system after injection into the blood. Indeed, investigation of the in vivo biodistribution of functionalized MSNs has shown that the majority are observed in the liver and spleen (Liu et al. Citation2011; Rascol et al. Citation2017), with most of the Si injected into mice excreted in the urine and feces (94%) (Lu et al. Citation2010).
The most common functionalization is the grafting of poly(ethylene glycol) (PEG) onto the NP surface. PEG is known to be able to minimize the nonspecific binding of biomolecules, especially proteins, by steric hindrance (He et al. Citation2011; Uz, Bulmus, and Alsoy Altinkaya Citation2016) and to increase the life-time in the bloodstream (Perry et al. Citation2012). Ashley et al. reported another class of nanocarriers combining the properties of liposomes and mesoporous silica particles, that is high specificity, enhanced cargo capacity, and long-term stability (Ashley et al. Citation2011). A lipid-bilayer coating composed of 1,2-dimyristoyl-sn-glycero-3-phosphocholine (DMPC) around mesoporous silica NPs was reported to be especially adapted for this use (Savarala et al. Citation2010; Durfee et al. Citation2016).
To assess the biocompatibility of these various nanocarriers, cell-based assays must be used at first-line, in accordance with the 3Rs rule of Russell and Burch (Citation1959). The metabolically competent human HepaRG cell-line represents a pertinent surrogate for primary human hepatocytes to investigate drug toxicity in vitro (Guillouzo Citation1998; Antherieu et al. Citation2012). This cell-line has the capability to differentiate into two types of cells: hepatocyte-like colonies surrounded by clear primitive biliary cells. Recently, omics technologies have entered the field of toxicology, leading to toxicogenomics, a very powerful tool for studying the toxicity of substances using cell-based assays and for deciphering chemical modes of action (Hartung Citation2010; Jennings et al. Citation2013; Pisani et al. Citation2015). In particular, the transcriptomic similarity of HepaRG to primary human hepatocytes is encouraging for the use of this model to study xenobiotic metabolism and hepatotoxicity (Hart et al. Citation2010).
Nevertheless, cellular responses to NP exposure remain largely unexplored with transcriptomics, albeit the use of this technology in the safety assessment of nanomaterials would certainly be an asset for predictive toxicology (Jennings et al. Citation2013; Pisani et al. Citation2015).
In this study, we used HepaRG cells to investigate the in vitro biocompatibility of functionalized M-MSNs. We aimed to differentiate the cellular impact of the additional coatings, PEG and DMPC, compared with pristine M-MSNs. It is necessary to differentiate the drug-loaded nanocarrier, of which toxicity is wanted against the target cells, and the unloaded nanocarrier itself, which should be safe for the rest of the organism. An exclusive targeting is currently difficult to obtain and collateral effects on healthy cells must be avoided. To this end, we have investigated the cell viability and cellular uptake of these three types of nanocarriers using MTT assays, real-time cell impedance, and transmission electron microscopy (TEM). We carried out gene expression profiling of HepaRG cells at 24 and 48 h after exposure to three concentrations of pristine and coated M-MSNs (1.6, 16, and 80 µg/cm2). This strategy allowed the significant hepatic responses triggered by the exposure to these nanocarriers to be highlighted in a time- and dose-dependent manner.
Methods
Synthesis and characterization of M-MSNs
Chemicals
All reagents were obtained commercially and used without any further purification. Hydrated, catalyst-grade, 30–50 mesh iron oxide FeO(OH), oleic acid (90%), oleylamine (99%), ether (≥99.9%), anhydrous ethanol (≥99.8%), anhydrous pentane (≥99%), anhydrous chloroform (≥99%), tetraethoxysilane (TEOS, ≥99.9%), cetyltrimethylammonium bromide (CTAB), and ammonium nitrate (NH4NO3) were purchased from Sigma-Aldrich (Saint-Quentin Fallavier, France). Sodium hydroxide (NaOH) and n-docosane (99%) were purchased from Acros (Thermo Fisher Scientific, Villebon-sur-Yvette, France), and chlorpromazin hydrochloride from Sigma Aldrich.
1,2-Dimyristoyl-sn-glycero-3-phosphocholine (DMPC) was purchased from Avanti Polar Lipids (Paris, France). 1X PBS (2.66 mM KCl, 1.47 mM KH2PO4, 137.93 mM NaCl, 8.05 mM Na2HPO4–7H2O) was provided by Gibco (Thermo Fisher Scientific). Silanized PEG (CH3O–PEG2000–Si(OCH3)3) was purchased from Rapp Polymere (Tuebingen, Germany). 3-(4,5-Dimethylthiazol-2-yl)-2,5-diphenyltetrazolium bromide (MTT) was provided by Promega (Charbonnières les Bains, France). The Epoxy Embedding Medium kit (Epon™) was purchased from Sigma Aldrich.
Synthesis of pristine, PEG-, and DMPC-coated M-MSNs
The complete synthesis procedures of pristine, PEG-, and DMPC-coated M-MSNs were described in detail by Nyalosaso et al. (Citation2016). Pristine M-MSNs were synthesized in a two-step method. This method allows the formation of monodisperse and homogeneous core–shell Fe3O4 MSN NPs with a single magnetic iron oxide core per NP surrounded by a mesoporous silica shell. For PEG M-MSNs, the pegylation of NPs was carried out during the synthesis of the mesoporous silica shell. After the condensation induced by the injection of TEOS during the silica shell procedure, the mixture was slowly cooled to 50 °C with continuous stirring. A solution of 1 mL ethanol supplemented with 100 mg silanized PEG 2000 was slowly added. The resulting mixture was stirred overnight. This mixture was cooled to room temperature before applying the washing steps, as described in Nyalosaso et al. (Citation2016).
Lipid coating of M-MSNs was performed in a two-step method encompassing the preparation of small unilamellar vesicles (SUVs) according to the Bangham method (Bangham, Standish, and Watkins Citation1965), followed by mixing of these SUVs with pristine M-MSNs (with a correspondence of 8/1 surface-area ratio of SUVs/NPs). After sonication and agitation, DMPC-coated M-MSNs were isolated by four centrifugation steps (4000g, 20 min) to remove excess SUVs. All processes were carried out in an endotoxin-free environment.
Characterization of nanoparticles
TEM observations were carried out on a JEOL 1200 EX II electron microscope (JEOL, Japan). NP samples were prepared on copper grids with a thin layer of Formvar and evaporated carbon (Agar scientific, UK). Cryogenic TEM (CryoTEM) observations of the NPs covered by a lipid bilayer were performed using a JEOL 220FS electron microscope (JEOL, Japan) with a 4 k × 4 k slow scan CCD camera (Gatan, Evry, France). Samples were prepared on copper grids with a Lacey R 2/2 carbon film (Eloise, France).
Hydrodynamic diameter and zeta potential were determined using a Zetasizer Nano ZS (Malvern Instruments Ltd., UK). Each measurement was performed at 20 μg/mL NPs after 2 min bath sonication in HBS (20 mM Hepes, 5 mM NaCl) or 1X PBS (ThermoFisher Scientific) at pH 7.4 and 20 °C.
Cell culture and analyses
Cell culture (HepaRG)
Cryopreserved, differentiated HepaRG™ cells were obtained from Biopredic International (Rennes, France). Cells were thawed in William’s E medium (Biopredic International) supplemented with additives (Biopredic International) composed of elements essential for the culture, such as fetal bovine serum and antibiotics, according to the supplier’s procedure. Cells were seeded into flat-bottom multiwell plates at concentrations depending on the plate format (480 000 and 72 000 cells per well for 24- and 96-well plates, respectively). The medium was renewed as recommended. Cells were incubated at 37 °C and 5% CO2 for 7 days in order to constitute a monolayer with active CYP activities.
Cell viability assay (MTT)
Cell viability assays were performed using the MTT assay (TOX1 Kit, Sigma, Saint-Quentin Fallavier, France). For this, 72 000 cells per well were seeded into 96-well plates in William’s E medium supplemented with ADD670 additive (Biopredic International). Cells were exposed to increasing NP concentrations (pristine, PEG-, and DMPC-coated M-MSNs). After 48 h exposure, samples were processed according to the supplier’s procedure. Absorbance was recorded using Multiskan Spectrum (Thermo Fisher Scientific) at 470 nm. Results are expressed as mean percentage of viable cells ± SD (n = 3) compared with control cells.
Due to the presence of the iron core, M-MSNs sediment quickly onto the well bottom and dosimetry are expressed as mass per well surface. Thus, for other techniques, doses were expressed in µg/cm2 to allow direct comparison between techniques that did not use the same well surface in cell culture plates.
Real-time cell impedance measurement (XCELLigence technology)
A background resistance of the E-plates (ACEA Biosciences, Inc., San Diego, CA) was determined with 100 µL culture medium. HepaRG™ cells were seeded at 44 000 cells per well. E-plates were placed into the Real-Time Cell Analyzer (RTCA) station (ACEA Biosciences, Inc., San Diego, CA) and incubated at 37 °C. The adhesion phase of cells was recorded every 1 min during the first 12 h and then every 15 min up to 7 days. After 7 days, cells were exposed (n = 3) to pristine, PEG-, and DMPC-coated M-MSNs at 1.6, 16, and 80 µg/cm2, and impedance data were monitored every 1 min for 24 h (early effects), then every 15 min for 96 h (late effects). The impedance of unexposed control cells was also recorded. Cell index (CI) raw data values were calculated by the RTCA software 2.0 (ACEA Biosciences, Inc., San Diego, CA). Normalized CIs were also calculated by the software, based on the NP exposure time-point.
Human gene expression microarrays (Agilent Human SurePrint V3 8x60K)
HepaRG™ cultures (n = 3) were exposed for 24 or 48 h to three concentrations of NPs, including pristine, PEG-, and DMPC-coated M-MSNs (1.6, 16, and 80 µg/cm2). Unexposed cells were used as the control for each time-point. Total RNAs were extracted using the RNeasy Mini Kit (Qiagen, Courtaboeuf, France). Quantification and qualification of total RNAs were performed using the NanoDrop 2000c spectrophotometer (ThermoFisher Scientific) and the Agilent 2100 Bioanalyzer (Agilent Technologies, Les Ulis, France), respectively. mRNAs were amplified and labeled with Cyanine-3 fluorophore using the One-color Low Input Quick Amp Labeling Kit (Agilent). Hybridization was performed using Human SurePrint V3 8 × 60K microarrays (Agilent). Fluorescence was recorded (Agilent Scanner) and signal data were extracted with Feature Extraction software (Agilent).
Statistical analysis for transcriptomics
Raw fluorescence data files were submitted to GeneSpring GX 13 software (Agilent Technologies) using a widespread and robust method for determining the significant modulation of gene expression (Wright et al. Citation2012; Pisani et al. Citation2015). Eighteen independent analyzes were conducted, namely for each experimental condition (18), three fluorescence data files from exposed cells were compared with three fluorescence data files from unexposed cells. Genes significantly up- or downregulated were determined using a Student’s t-test with a p value set at 0.05 and a Benjamini–Hochberg false discovery rate correction. The fold-change cutoff was set at 2. We, thus, obtained lists of genes that were significantly induced or repressed after exposure to NPs.
Integrative biological analysis
Lists of genes significantly induced or repressed (datasets) obtained after exposure to different types of NPs were uploaded into Ingenuity Pathway Analysis (IPA) software (Qiagen) for biological analysis. These datasets were processed to investigate gene functional annotation and distribution into known cell functions and canonical pathways, according to the IPA knowledge database. The significance of highlighted functions and pathways was calculated using a Fisher's exact test with a p value set at 0.05. For each dataset, associations with known canonical pathways were expressed by ratios (in percentage), meaning the number of genes in a dataset that belong to a canonical pathway divided by the total number of known genes mapping this pathway. A Fisher’s exact test was used to determine a p value representing the significance of these associations.
Cellular uptake and localization by TEM
HepaRG™ cells were seeded on cell-chamber glass coverslips according to the cell culture procedure detailed above. After controlling their adherence and growth for 7 days, cells were exposed to 16 µg/cm2 NPs in William’s E medium for 6 and 24 h. The medium was removed and the cells were washed twice with 0.1 M PBS. Cells were fixed by incubation with 2.5% (v/v) glutaraldehyde in 0.1 M PBS for 1 h at room temperature then stained by incubation with 1% osmium tetroxide. Cells were dehydrated using solutions of increasing concentration of EtOH in water. The polymerization was performed by embedding cells in EPON resin. Ultrathin sections (70 nm) were obtained using an ultramicrotome and placed on the copper grids.
Results
Characterization of pristine and coated M-MSNs
Pristine M-MSNs were observed by TEM, which showed NPs composed of a unique magnetic Fe3O4 core per particle surrounded by a mesoporous silica shell (), with a mean diameter of 117 ± 2 nm (). These M-MSNs were monodisperse with a low polydispersity index (0.17) and stable at physiological pH with a zeta potential of −39.1 ± 1.4 mV. The PEGylation around the M-MSNs did not alter the silica shell structure () and increased the zeta potential of the NPs up to −30.4 ± 2.9 mV (). These PEG M-MSNs were monodisperse and stable at physiological pH with a size of 123 ± 3 nm. The polyethylene glycol grafted at the nanoparticles’ surface was differentiated by heavy staining with OsO4 (Brown and Butler Citation1997). With TEM imaging we measured the PEG layer thickness at 7 ± 1 nm. The lipid-bilayer DMPC coating of M-MSNs induced an increase of the zeta potential up to −10.3 ± 0.4 mV, close to the zeta potential of small unilamellar DMPC vesicles alone (−4.5 ± 0.7 mV). These DMPC M-MSNs were monodisperse and also stable at physiological pH. CryoTEM imaging showed a mean diameter of 132 ± 4 nm, including the DMPC bilayer.
Figure 1. TEM characterization of M-MSNs. (A) As the pristine state, (B) covered with PEG, and (C) cryogenic TEM characterization of lipid bilayer DMPC M-MSNs.
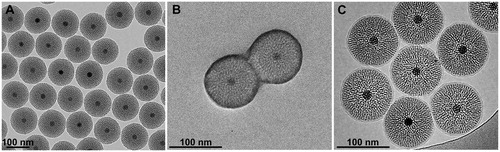
Table 1. Physicochemical characterization of pristine M-MSNs and those covered with PEG or DMPC lipid bilayer.
Cell viability assays
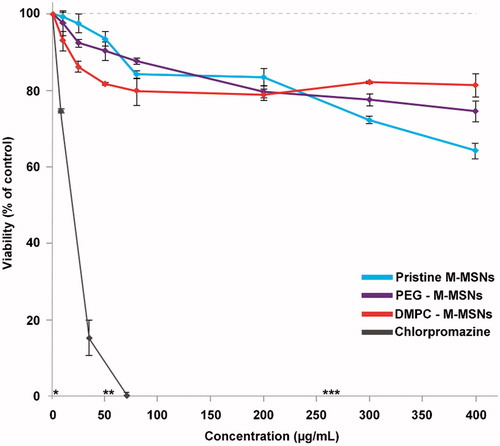
The viability of HepaRG cells exposed to pristine, PEG-, and DMPC-coated M-MSNs was performed by MTT assay after 48 h exposure. As shown in , the presence of NPs did not induce a drastic loss of viability of HepaRG cells. We observed a small dose-dependent decrease of the cell viability for all type of NPs, with a maximum loss of viability observed for pristine M-MSNs around 35% at 400 µg/mL (corresponding to 120 µg/cm2 in a 96-well plate). The viability of PEG M-MSNs was close to that of pristine M-MSNs, with a maximum loss of viability of around 25% at the highest dose. DMPC M-MSNs induced a less than 20% decrease of cell viability and reached a plateau from 60 µg/mL. Chlorpromazine, a hepatotoxic drug, was used as the positive control and induced a drastic cytotoxic effect on HepaRG cells, with an IC50 of 12 µg/mL (34 µM). Based on these results, three concentrations of NPs (1.6, 16, and 80 µg/cm2) were chosen to follow their cellular uptake by TEM, to analyze their physiological impact by cell impedance, and to identify the molecular events triggered by these different NPs by gene expression profiling.
Figure 2. MTT cell viability assay of HepaRG cells exposed for 48 h to increase concentrations of pristine M-MSNs (blue curve), PEG M-MSNs (purple curve), DMPC M-MSNs (red curve), and chlorpromazine as the positive control (grey curve). Concentration equivalences: * = 1.6 µg/cm², ** = 16 µg/cm², and *** = 80 µg/cm². Results are expressed as mean percent viable cells ± SD (n = 3) compared with control cells.
xCELLigence experiments
HepaRG cells were exposed to pristine M-MSNs, PEG M-MSNs, and DMPC M-MSNs at 16 and 80 µg/cm2 for 3 days and viability and morphology modulations were monitored by real-time cell impedance on HepaRG cells (). As a control, all NPs were tested in acellular conditions and no interference on impedance measurements was observed, in accordance with other studies of cell impedance with NPs (Sergent, Paget, and Chevillard Citation2012).
Figure 3. Real-time impedance cell index (CI) monitoring of HepaRG cells (n = 3) exposed to (A) 16 µg/cm² and (B) 80 µg/cm² pristine M-MSNs (blue), PEG M-MSNs (purple), and DMPC M-MSNs (red) for 72 h. The black arrow represents the starting point of exposure. CI was normalized at this point to ensure inter-dose comparison and control cells were defined as baseline.
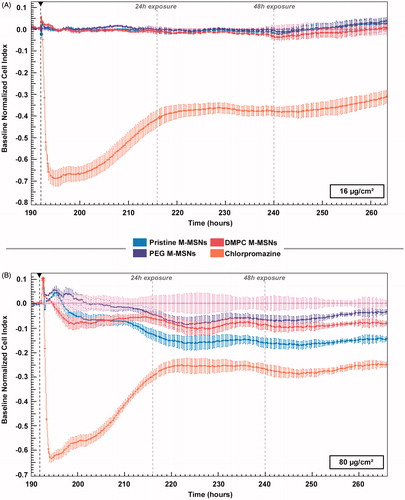
At 16 µg/cm2, the real-time cell impedance did not detect any change in morphology or viability over the experimental time-period for these three types of NPs (). At 80 µg/cm2, we observed a biphasic response for the three types of NPs, including a small decrease in the CI during the first 24 h of exposure followed by a stabilization until the end of the experiment (). Chlorpromazine showed a drastic deleterious effect on CI, and a slow increase until 24 h.
Kinetics of cellular NP uptake and localization
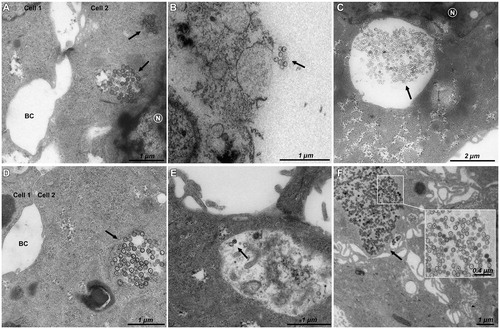
The kinetics of cellular uptake and localization of pristine, PEG-, and DMPC-coated M-MSNs at 16 µg/cm2 were observed by TEM after 6 and 24 h exposure (). The results showed a rapid cellular internalization of pristine () and DMPC () M-MSNs from 6 h of exposure. No cellular uptake was observed for PEG M-MSNs at 6 h exposure (). After 24 h exposure, pristine M-MSNs () and DMPC M-MSNs () were internalized as large groups in vesicles, whereas PEG M-MSNs were internalized in much smaller quantities (). None of these NPs were observed in the nucleus.
Figure 4. TEM imaging of HepaRG cells exposed to 16 µg/cm² for 6 h to (A) pristine M-MSNs, (B) PEG M-MSNs, (C) DMPC M-MSNs, and for 24 h to (D) pristine M-MSNs, (E) PEG M-MSNs, (F) DMPC M-MSNs. N indicates the nucleus, BC indicates bile canaliculi, and arrows indicate NPs.
Transcriptomic analyses
Gene expression changes were evaluated in three biological replicates using Agilent Human V3 SurePrint 8 × 60K Microarrays. shows the number of differentially expressed transcripts detected in response to exposure to 1.6, 16, and 80 µg/cm2 pristine, PEG-, and DMPC-coated M-MSNs for 24 h () and 48 h (). The number of differentially expressed transcripts reflects the magnitude of the cellular effects of NPs.
Figure 5. Time- and dose-dependent effects of exposure to NPs on the number of significantly differentially expressed genes. HepaRG cells were exposed to 1.6, 16, and 80 µg/cm² pristine, PEG-, and DMPC-coated M-MSNs for 24 or 48 h. After extraction and labeling, RNA was hybridized to a human oligo microarray (6 × 60 k Agilent V3 SurePrint). Bars represent the number of differentially expressed transcripts after statistical analysis using Genespring GX13 software (Agilent), with a p value ≤0.05 and a fold-change ≥2.
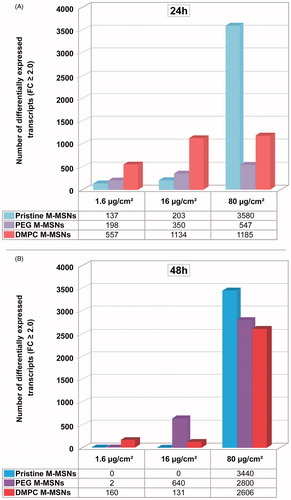
At 24 h exposure, a dose-dependent response to the three types of M-MSNs was observed, ranging from 137 to 3580, 198 to 5447, and 557 to 1185 differentially expressed transcripts for pristine, PEG-, and DMPC-coated M-MSNs, respectively. At this time, DMPC M-MSNs induced the greatest modulation of gene expression at 1.6 and 16 µg/cm2, whereas pristine M-MSNs induced the lowest effect on gene expression at these two doses. However, pristine M-MSNs induced the highest effect at 80 µg/cm2, with 3580 modulated transcripts.
After 48 h exposure, gene expression was not differentiated from control cells with 1.6 and 16 µg/cm2 pristine M-MSNs and DMPC M-MSNs, indicating a transient effect for the first 24 h. The highest dose showing no effect (16 µg/cm2) can be defined here as the ‘No Observed Transcriptional Effect Level’ (NOTEL). However, this transient effect no longer existed at 80 μg/cm2: pristine M-MSNs altered 3440 transcripts at 48 h versus 3580 at 24 h and at this concentration the cellular impact of DMPC M-MSNs was even highly amplified (2800 modulated transcripts at 48 h versus 1185 at 24 h). For PEG M-MSNs, we observed a reversible effect on gene expression only at 1.6 µg/cm2 between 24 and 48 h. A dose of 16 µg/cm2 induced a steady moderate effect between 24 and 48 h but the highest dose, 80 µg/cm2, gave rise to a drastic increase in the number of altered genes between 24 and 48 h exposure. All fold-changes and p values of modulated transcripts by condition (doses and time-points) are listed in ESI, Tables S1–S3.
We identified the most relevant canonical pathways involved, in the hepatic environment, after 24 and 48 h exposure, for all NP doses, using the IPA software. For each dose and time-point, we calculated several ratios indicating the percentage of modulated genes in our dataset belonging to known canonical pathways. The significance of these pathways was tested according to a Fisher’s statistical test (p value <0.05). reports the six most relevant canonical pathways altered by pristine, PEG-, and DMPC-coated M-MSNs (80 µg/cm2, at 24 and 48 h). All modulated genes belonging to these pathways, with their fold-changes and p values, are reported in ESI Table S4 for all time-points and doses. These pathways belong to well-known hepatic functions and xenobiotic responses.
Figure 6. Canonical pathways elicited by each M-MSN (80 µg/cm²). The percentage of modulated transcripts of our datasets belonging to six major altered canonical pathways after (A) 24 h and (B) 48 h exposure to 80 µg/cm² M-MSNs. These pathways were all significant according to a Fisher’s statistical test (p value <0.05), revealed with Ingenuity Pathway Analysis (IPA, QIAGEN).
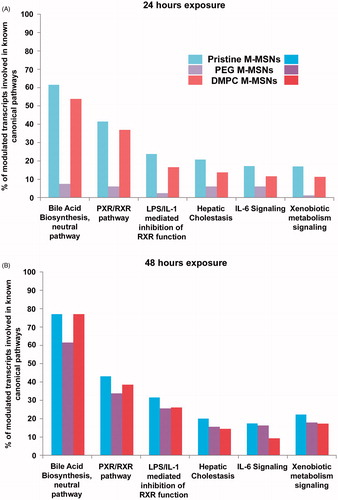
At 24 h exposure (), pristine M-MSNs induced the highest effect on these six pathways, followed by DMPC M-MSNs and then PEG M-MSNs. Few genes were modulated by the presence of PEG M-MSNs at 24 h, with less than 10% of modulated genes involved in these pathways. Despite the difference of differentially expressed genes measured between pristine and DMPC M-MSNs (i.e. 3580 and 1185 modulated transcripts at 24 h, respectively), the ‘bile acid biosynthesis’ pathway was modulated within the same magnitude (61.5% and 53.8%, respectively). In addition, ‘bile acid biosynthesis’ was the most affected pathway at 24 and at 48 h exposure. It should be noted that PEG-coated M-MSNs also modulated this pathway, despite a level of 7.7% at 24 h (ESI Table S4). At 48 h exposure (), the most important finding was that PEG M-MSNs drastically increased the involvement of these pathways, from 7.7% at 24 h to 61.5% at 48 h for ‘bile acid biosynthesis’, and from 6.2% at 24 h to 33.8% at 48 h for ‘PXR/RXR pathway’. This increase was observed for all pathways.
Discussion
In the current study, we investigated the biocompatibility of M-MSNs with two different types of coverage, PEG or lipid-bilayer DMPC, compared to pristine M-MSN. The physicochemical characterization showed that these three types of nanocarriers were monodisperse spheres with a diameter close to 100 nm (), composed of a single magnetic Fe3O4 core surrounded by a mesoporous silica shell (). Both decorations, that is PEG and DMPC, did not alter the silica shell structure (). The PEGylation around the M-MSN surface allowed the creation of a steric hindrance of 7 nm. The lipid bilayer DMPC coating of M-MSNs induced an increase of the zeta potential up to around −10 mV, close to the zeta potential of small unilamellar DMPC vesicles (−4.5 mV) (Nyalosaso et al. Citation2016). Moreover, cryoTEM imaging showed a DMPC bilayer thickness close to 7.5 nm (), as reported in the literature (Durfee et al. Citation2016).
The HepaRG model is a promising alternative to primary hepatocytes. In particular, they are able to express numerous P450 cytochromes, allowing the performance of many normal metabolic liver functions such as the production of phase I and II enzymes and transmembrane transport proteins, unlike other hepatocyte cell lines such as HepG2 (Guillouzo et al. Citation2007; Kanebratt and Andersson Citation2008; Turpeinen et al. Citation2009; Jennen et al. Citation2010).
In the current study, due to the presence of the iron core, M-MSNs sediment quickly onto the cell surface and dosimetry is expressed as mass per well surface (µg/cm2). This enables direct comparison between techniques that do not use the same well surface in cell culture plates (Lison et al. Citation2008). The choice of doses is essential in toxicology and must be as close as possible from the in vivo situation. Three concentrations to be tested were chosen for all types of NPs, that is 1.6, 16, and 80 µg/cm2 (corresponding to 6, 60, and 300 µg/mL, respectively) in accordance with both literature and our viability assays data (Hudson et al. Citation2008; Witasp et al. Citation2009). In particular, this choice was based on the concentration of 40 mg/kg already used for biodistribution studies by injection in mice (Lu et al. Citation2010; Liu et al. Citation2011; Rascol et al., Citation2017). One milligram per mouse of 25 g with 2 mL of blood corresponds approximately to a concentration of 500 µg/mL. This concentration did not alter liver tissues as observed by Rascol et al., despite M-MSNs presence in the liver, attested by the silica content measured by ICP-MS. In the current study, the testing concentration range has been limited to 300 μg/mL so as not to trigger an excessive cell mortality.
Biocompatibility at low doses
HepaRG cells were exposed to a range of nanocarrier concentrations to assess their impact on cell viability. Pristine, PEG, or DMPC M-MSNs induced a slight dose-dependent decrease in cell viability () that did not exceeded 35%, a maximum reached with the highest concentration tested (400 µg/mL, corresponding to 120 µg/cm2) of pristine NPs after 48 h exposure.
For studying kinetics, we used real-time cell impedance technology (RTCA). The CI reflects modifications of both cell morphology and cell viability (Atienzar et al. Citation2013). HepaRG cells were exposed to 16 and 80 µg/cm2 pristine, PEG, and DMPC M-MSNs for 3 days (). At 16 µg/cm2, the real-time cell impedance did not detect any change in morphology or viability for these three types of NPs (). At 80 µg/cm2, we observed a biphasic response for the three types of NPs, including a small decrease of the CI during the first 24 h exposure followed by a stabilization until the end of the experiment (). Chlorpromazine (100 µM), as the positive control, showed a fast deleterious effect on CI because of cell damage, followed by a slow recovery until 24 h, likely due to the drug metabolism and the rearrangement of the cell layer.
Based on these assays, none of these NPs presented a real toxicity at the concentrations tested. This was an encouraging evaluation as NPs are intended for use as drug nanocarriers and should not cause any kind of cellular change or toxicity.
M-MSN uptake
Albeit we did not observed any modifications of impedance at 16 µg/cm2, TEM observations at this dose showed an NP uptake by HepaRG cells. Surprisingly, we observed a rapid internalization of pristine () and DMPC () M-MSNs after 6 h exposure at this dose, while no internalization was observed for PEG M-MSNs (), which stayed around the cell membrane. After 24 h exposure, pristine () and DMPC () M-MSNs were internalized to a greater extent, while a low level of internalization was observed for PEG M-MSNs. DMPC M-MSNs in particular were trapped as large groups. These three types of NPs were observed in large vesicles without any observable modification of their size and structure. According to Danhier et al., negatively and neutrally charged NPs co-localize mostly with lysosomes (Danhier et al. Citation2012). With negative zeta potentials at physiological pH (between −40 and −10 mV), the currently studied nanocarriers are probably located in lysosomes. DMPC M-MSNs were observed in larger vesicles, probably phagosomes with respect to their large size. Once in a biological medium containing proteins, the NPs were covered with a protein corona. Our previous experiments showed that M-MSNs were still negatively charged (−20 mV) when surrounded by a protein corona (Pisani et al. Citation2017a). The main difference is that PEG at the surface of M-MSN may reduce the formation of the corona, thus impeding cellular uptake. Consequently, the internalization of PEG M-MSNs is slowed compared to pristine and DMPC M-MSNs. In addition, it is possible that the use of bovine serum in the human cell culture medium may influence internalization and intracellular functional mechanisms, as suggested by Kim et al. (Citation2014) and as we demonstrated in a recent publication (Pisani et al. Citation2017b). Indeed, if the cell recognizes the NP–protein complex as non-self, it is probable that this recognition does not take place in vivo, where the corona will be constituted of human proteins recognized as self.
Gene expression profiles in HepaRG
We therefore undertook a transcriptomic analysis, a unique technology capable of detecting subtle molecular changes that may occur before any macroscopic physiological changes are visible. This technique is very sensitive and very low doses of exogenous compounds allow the first deleterious molecular events to be deciphered without triggering multiple and extreme deleterious effects. Indeed, beyond a certain threshold, the cell defense pathways are overwhelmed and numerous signaling pathways are triggered, as well as apoptosis and necrosis. These responses must be avoided because they are no longer compound specific (Pisani et al. Citation2015). Thereby, HepaRG cells were exposed to the pristine, PEG, and DMPC M-MSNs at the three doses: 1.6, 16, and 80 µg/cm2 (corresponding to 6, 60, and 300 µg/ml, respectively), for 24 and 48 h.
A moderate and transient adverse effect at low doses
The number of differentially expressed transcripts reflects the magnitude of the cellular disruption caused by NPs (). In terms of number of genes differentially expressed, a very small dose-dependent response was observed after 24 h exposure with the three types of M-MSNs. At this time-point, the lowest concentrations (1.6 and 16 µg/cm2) did not really alter the expression of HepaRG transcripts, with less than 640 differentially expressed genes out of the whole human genome, except for DMPC M-MSNs (1134 altered transcripts). Most importantly, after 48 h exposure, there was no longer any obvious modulation of gene expression at 1.6 and 16 µg/cm2 with any of the M-MSNs, clearly indicating a transient effect during the first 24 h. This result was in accordance with the viability and impedance assays.
However, this transient effect was not observed at 80 μg/cm2: pristine M-MSNs altered as many transcripts at 48 h as at 24 h, and DMPC M-MSNs altered twice as many transcripts after 48 h than 24 h, reflecting an amplified disruption. For PEG M-MSNs, the effect on gene expression was strictly reversible at 1.6 µg/cm2, and the 16 µg/cm2 dose induced a steady low-level effect between 24 and 48 h. However, the highest dose, 80 µg/cm2, led to a drastic increase in the number of altered genes between 24 and 48 h exposure.
According to Vivero-Escoto et al. (Citation2010), MSN materials are biocompatible with HeLa and CHO cells at concentrations below 100 µg/mL, while concentrations above 200 μg/mL result in cell damage. For HepaRG cells, we set the limit of biocompatibility below 16 µg/cm2 (i.e. 60 µg/mL).
The dose without effect (1.6 µg/cm2) can be defined here as a NOTEL, according to Lobenhofer et al. (Citation2004). The first dose with an effect (16 µg/cm2) can be considered as a ‘Lowest Observed Transcriptional Effect Level’ (LOTEL). This point is important to underline because, in search of a quantitative method to classify and compare hepatotoxic substances, transcriptomics techniques could be very helpful by providing quantitative responses for toxicity prediction at low doses (Zarbl et al. Citation2010). The dose 16 μg/cm2 probably triggers the onset of effects that are more clearly observable with a higher dose.
Despite the fact that no tissue alteration was observed at a higher dose in mice with M-MSN (Rascol et al. Citation2017), an in-depth study at 80 µg/cm2 could then reflect a predictive fate of HepaRG cells under exposure to M-MSNs.
Mechanisms of uptake at higher dose
We investigated which known pathways were involved in the internalization of these nanocarriers. However, in our case, none of the conventional pathways such as clathrin or caveolar-mediated endocytosis seem to be involved. Indeed, with 80 µg/cm2 pristine M-MSNs after 48 h, only 12 and 27 genes belonging to ‘caveolar-mediated endocytosis signaling’ and ‘clathrin-mediated endocytosis signaling’ were modulated, respectively, out of the hundreds of genes that describe these two pathways. Alternatively, many G protein-coupled receptors were involved, as well as integrins and Toll-like transmembrane receptors. After 24 h exposure, we observed that many G-PCR receptors were heavily induced or repressed by pristine and DMPC M-MSNs (63 and 19, respectively), while conversely PEG M-MSNs altered them in a lesser extend (5) (ESI Tables S1–S3).
It is important to note that, in a biological medium, NPs become surrounded by proteins, thus forming a protein–NP complex. This corona confers to the NP a new identity. Cells may identify this large protein–NP complex differently to pristine NPs, and set up appropriate recognition mechanisms. In the current case, the corona is composed of bovine proteins originating from additional FBS in the cell culture medium. According to Cerdevall et al., the corona could alter biological functions by the high presence of proteins in a restricted cellular area (Cedervall et al. Citation2007). Thereby, this complex may appear to the cell as an exogenous compound, leading to a recognition by G protein-coupled receptors, integrins, and Toll-like transmembrane receptors, acting as gateways to the cell and triggering the proinflammatory response (Hild et al. Citation2010). Thus, due to the presence of a protein corona around them, NPs may ‘mislead’ the cells, which may recognize these NPs as pathogen-like invaders, such as lipopolysaccharides (LPS) originating from bacterial outer membranes. The membrane receptors that act as ‘molecular switches’ may control the NP uptake and promote, as for LPS, the secretion of proinflammatory cytokines. Precisely, in our datasets, IL-1, TNFα, IL-6, IL-8 were heavily induced (). The gene encoding the C-reactive protein was heavily upregulated (FC = 12). This protein is involved in several host defense-related functions based on its ability to recognize foreign pathogens or injured cells and to initiate their elimination by interacting with humoral and cellular effector systems in the blood. Consequently, the level of this protein in plasma increases greatly during acute phase response to tissue injury, infection, or other inflammatory stimuli such as NP invasion.
We can infer that M-MSNs are not engulfed by a clathrin and caveolin endocytosis-dependent pathway but rather by a receptor-mediated mechanism, more in accordance with the size of these NPs (100 nm) (Vivero-Escoto et al. Citation2010).
Hepatobiliary system disruption
We performed biological data mining for all doses and time-points to extract all molecular signatures with no a priori hypothesis. We then analyzed and compared these responses, not in terms of gene-to-gene comparison but in terms of altered molecular pathways. The most relevant canonical pathways involved in the hepatic environment and revealed by this analysis are depicted in . From this comparative pathway-driven analysis, we highlighted the possible sequence of events that leads to the disruption of hepatobiliary system, as represented schematically in . All the genes mentioned in the text below are reported in .
Figure 7. Representation of M-MSN mode of action on HepaRG hepatocytes. HepaRG cultures (n = 3) were exposed for 24 and 48 h to three concentrations (1.6, 16, and 80 µg/cm²) of NPs including pristine (blue dot), PEG- (purple dot) and DMPC- (red dot)coated M-MSNs. N = nucleus. At 80 µg/cm², the hepatic cholestasis pathway is highlighted by the downregulation of most of its main effectors such as BSEP and NCTP, characterized by an intrahepatic accumulation of cytotoxic bile acids, which ultimately causes liver injury.
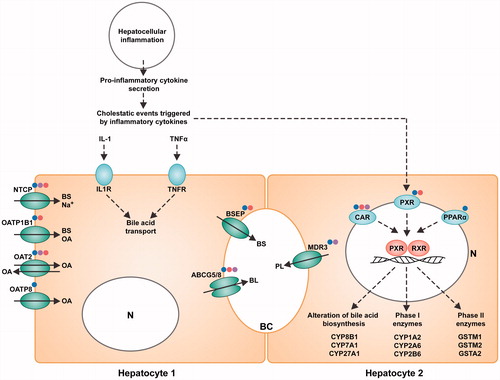
Table 2. Fold changes (FC) of main transcripts modulated by exposure to pristine, PEG, and DMPC M-MSNs (80 µg/cm2 at 24 and 48 h) corresponding to hepatobiliary system disruption.
Inflammation
We observed a strong induction of the proinflammatory cytokines, IL-1 and TNFα. The most significant altered pathway was the ‘LPS/IL-1-mediated inhibition of RXR pathway’. This pathway describes the junction between inflammation and the disruption of hepatobiliary functions. The subsequent inflammation downregulates the expression of hepatic genes involved in a variety of physiological processes, collectively known as the negative hepatic acute phase response (APR) (Beigneux et al. Citation2002). Many of the genes repressed during APR are regulated by the nuclear hormone receptor, retinoid X receptor α (RXRα).
Nuclear receptors
The ‘PXR/RXR pathway’ is one of the most pertinent pathways elicited by M-MSN exposure in our results. Retinoid X receptors (RXRs) are nuclear receptors that mediate strong biological effects by dimerization with type II nuclear receptors, such as the pregnane X receptor (PXR/NR1L2), the constitutive androstane receptor (CAR/NR1L3), and the peroxisome proliferator-activated receptor (PPAR/PPARA). Many of these nuclear receptors were modulated in our datasets, including the small heterodimer partner (SHP/NR0B2), a regulator of bile acid metabolism (Miao et al. Citation2009), as shown in .
Phase I and II enzymes
Expressed predominantly in the liver, activated PXR in conjunction with RXR plays a central role in xenobiotic metabolism by inducing the cytochrome P450 family, including phase I metabolism enzymes, in response to cell injury. Here, CYP1A2, CYP2A6, CYP2B6, CYP2C8, CYP2C9, CYP2C19, CYP3A5, and CYP3A7 were highly downregulated at 48 h in the presence of all M-MSNs (80 µg/cm2). This also included CYP3A4, an enzyme involved in the modification of bile acids, and CYP7A1, responsible for bile acid synthesis. In addition, PXR/RXR is an important regulator of drug phase II metabolism and excretion. This complex induces the downregulation of xenobiotic conjugation phase II enzymes (SULT2A1, UGT1A9, GSTA2, GSTM1, and GSTM2).
In general, exposure to xenobiotics triggers a cellular ‘stress’ response leading to increased gene expression of phase I or phase II genes, which ultimately enhances the elimination and clearance of the xenobiotics (Rushmore and Tony Kong Citation2002).
Efflux pumps
The bile salt export pump (BSEP/ABCB11) was downregulated, as well as ABCG5/G8. We also observed that mRNA levels of an essential transport system for bile salts (NTCP, SLC10A1) were impaired, as were organic anion transporters (OAT2/SLC22A7, OATP1B1/SLCO1B1, OATP8/SLCO1B3), and phospholipid export (MDR3/ABCB4).
Hepatic cholestasis
The reduced expression of transcripts related to the hepatobiliary transport system contributes to the evidence of a disturbed ‘hepatic cholestasis pathway’ (Zollner et al. Citation2001). Cholestasis results in intrahepatic accumulation of cytotoxic bile acids. The observed inhibition of BSEP/ABCB11 should lead to increased intrahepatic concentrations of bile acids and subsequent cholestasis. Nevertheless, cholestatic liver damage may be counteracted by a variety of intrinsic hepatoprotective mechanisms. Such defense mechanisms include the repression of hepatic bile acid uptake and de novo bile acid synthesis (Zollner et al. Citation2006). Here, while the former mechanism was activated, as shown above, there was no de novo biosynthesis of bile acids as all genes belonging to ‘bile acid biosynthesis neutral pathway’ were severely repressed, the most repressed being CYP3A4, CYP7A1, CYP8B1, and SLC27A5. Later key events include bile accumulation, the induction of inflammation, and the activation of specific nuclear receptors.
IL-6 signaling
IL-6 is strongly upregulated. One consequence of IL-6 secretion is the inhibition of xenobiotic transport by acting on the PXR/RXR pathway. IL-6 combined with the action of IL-1 and TNFα, leads to the reduced expression of hepatic proteins, such as metabolism enzymes. This chain of events leads to an impaired metabolism, encompassing the biosynthesis of lipid, cholesterol, and bile acids. The downregulation of xenobiotics conjugation phase II enzymes () alters the transport of xenobiotics, represented by the ‘xenobiotic metabolism pathway’.
Collectively, these mechanisms belong to the adverse outcome pathway (AOP) (Edwards et al. Citation2016; Hartung Citation2017) for cholestatic liver injury, and drive a deteriorative cellular response, ultimately causing liver injury leading to jaundice, and biliary fibrosis (Vinken Citation2016).
Conclusion
Using up-to-date technologies, we have investigated the hepatic biocompatibility of M-MSNs as future nanocarriers for nanomedicine. The potential toxicity of these NPs, separately from any drug with which they may be combined, must be evaluated in order to avoid collateral toxicity to healthy cells, especially cells of the liver, which is the primary accumulative organ. The significant responses of HepaRG cells triggered by exposure to pristine M-MSNs as well as PEG and DMPC M-MSNs were compared.
In our hands, M-MSNs were not extremely harmful to liver cells compared to known hepatotoxicants. From the current transcriptomic study, we determined that 1.6 µg/cm2 is a dose without any molecular effect. The dynamic aspect of these effects is very important and we were able to demonstrate that at 16 µg/cm2 they were transient, disappearing after 48 h. We set the limit of biocompatibility for HepaRG cells below 16 µg/cm2 (i.e. 60 µg/mL) of these NPs. At 80 µg/cm2, we identified initial molecular events and pathways of toxicity elicited by all M-MSNs, such as negative hepatic APR. The hepatic cholestasis AOP was triggered by inhibition of the bile salt export pump transporter protein (BSEP, ABCB11). At this highest dose, adverse effects were amplified after 48 h. Pristine and DMPC M-MSNs showed deleterious effects from 24 h exposure, whereas PEG M-MSNs triggered the same effects only after 48 h, probably because of an impaired corona formation.
In vitro cell culture with ‘omics’ technology complemented with microscopic observation is a powerful combination of tools for testing and comparing substance toxicity, while accessing their molecular mechanisms of action. More broadly, in a regulatory perspective we showed that it is possible to distinguish the doses with no effect (NOTEL) from the doses inducing a lowest observed effect (LOTEL) and thus classify drugs, chemicals, endocrine disruptors, and NPs independently of their structure. This strategy might be an asset for upstream selection of the safest nanocarriers in the framework of nanobiosafety regulation.
Supplemental data
The underlying research materials for this article can be accessed at https://zenodo.org/deposit/891409 ESI Tables S1 to S3 : fold-changes and p-values of modulated transcripts by experimental condition for all doses and time-points. ESI Table S4 : modulated transcripts belonging to pathways mentioned in the text with their fold-changes and p-values.
The transcriptomic raw data supporting this publication have been deposited in the NCBI Gene Expression Omnibus (GEO) repository and are accessible via GEO Series accession number (https://www.ncbi.nlm.nih.gov/geo/query/acc.cgi?acc=GSE98236).
Acknowledgements
We thank Mme Véronique Viguier and Dr. Erwan Oliviero for Osmium tetroxide staining and TEM observation.
Disclosure statement
The authors declare that they have no competing interests.
Additional information
Funding
Related Research Data
References
- Antherieu, S., C. Chesne, R. Li, C. Guguen-Guillouzo, and A. Guillouzo. 2012. “Optimization of the HepaRG Cell Model for Drug Metabolism and Toxicity Studies.” Toxicology in Vitro : An International Journal Published in Association with Bibra 26: 1278–1285.
- Ashley, C. E., E. C. Carnes, G. K. Phillips, D. Padilla, P. N. Durfee, P. A. Brown, T. N. Hanna, et al. 2011. “The Targeted Delivery of Multicomponent Cargos to Cancer Cells by Nanoporous Particle-Supported Lipid Bilayers.” Nature Materials 10: 389–397.
- Atienzar, F. A., H. Gerets, K. Tilmant, G. Toussaint, and S. Dhalluin. 2013. “Evaluation of Impedance-Based Label-Free Technology as a Tool for Pharmacology and Toxicology Investigations.” Biosensors 3: 132–156.
- Bangham, A., M. M. Standish, and J. Watkins. 1965. “Diffusion of Univalent Ions Across the Lamellae of Swollen Phospholipids.” Journal of Molecular Biology 13: 238–252.
- Beigneux, A. P., A. H. Moser, J. K. Shigenaga, C. Grunfeld, and K. R. Feingold. 2002. “Reduction in Cytochrome P-450 Enzyme Expression is Associated with Repression of CAR (Constitutive Androstane Receptor) and PXR (Pregnane X Receptor) in Mouse Liver During the Acute Phase Response.” Biochemical and Biophysical Research Communications 293: 145–149.
- Bouchoucha, M., M.-F. Côté, R. C. Gaudreault, M.-A. Fortin, and F. Kleitz. 2016. “Size-Controlled Functionalized Mesoporous Silica Nanoparticles for Tunable Drug Release and Enhanced Anti-Tumoral Activity.” Chemistry of Materials 28: 4243–4258.
- Brown, G., and J. Butler. 1997. “New Method for the Characterization of Domain Morphology of Polymer Blends Using Ruthenium Tetroxide Staining and Low Voltage Scanning Electron Microscopy (LVSEM).” Polymer 38: 3937–3945.
- Cedervall, T., I. Lynch, S. Lindman, T. Berggård, E. Thulin, H. Nilsson, K. A. Dawson, and S. Linse. 2007. “Understanding the Nanoparticle–Protein Corona Using Methods to Quantify Exchange Rates and Affinities of Proteins for Nanoparticles.” Proceedings of the National Academy of Sciences 104: 2050–2055.
- Danhier, F., E. Ansorena, J. M. Silva, R. Coco, A. Le Breton, and V. Préat. 2012. “PLGA-Based Nanoparticles: An Overview of Biomedical Applications.” Journal of Controlled Release 161: 505–522.
- Deodhar, G. V., M. L. Adams, and B. G. Trewyn.2017. “Controlled Release and Intracellular Protein Delivery from Mesoporous Silica Nanoparticles.” Biotechnology Journal 12(1). doi: 10.1002/biot.201600408.
- Durfee, P. N., Y.-S. Lin, D. R. Dunphy, A. J. Muñiz, K. S. Butler, K. R. Humphrey, A. J. Lokke, et al. 2016. “Mesoporous Silica Nanoparticle-Supported Lipid Bilayers (Protocells) for Active Targeting and Delivery to Individual Leukemia Cells.” ACS Nano 10: 8325–8345.
- Edwards, S. W., Y.-M. Tan, D. L. Villeneuve, M. E. Meek, and C. A. Mcqueen. 2016. “Adverse Outcome Pathways—Organizing Toxicological Information to Improve Decision Making.” Journal of Pharmacology and Experimental Therapeutics 356: 170–181.
- Guillouzo, A. 1998. “Liver Cell Models in In Vitro Toxicology.” Environmental Health Perspectives 106(Suppl 2): 511–532.
- Guillouzo, A., A. Corlu, C. Aninat, D. Glaise, F. Morel, and C. Guguen-Guillouzo. 2007. “The Human Hepatoma HepaRG cells: A Highly Differentiated Model for Studies of Liver Metabolism and Toxicity of Xenobiotics.” Chemico-Biological Interactions 168: 66–73.
- Hart, S. N., Y. Li, K. Nakamoto, E. A. Subileau, D. Steen, and X. B. Zhong. 2010. “A Comparison of Whole Genome Gene Expression Profiles of HepaRG Cells and HepG2 Cells to Primary Human Hepatocytes and Human Liver Tissues.” Drug Metabolism and Disposition 38: 988–994.
- Hartung, T. 2010. “Food for Thought… on Alternative Methods for Nanoparticle Safety Testing.” Altex 27: 87–95.
- Hartung, T. 2017. “Utility of the Adverse Outcome Pathway Concept in Drug Development.” Expert Opinion on Drug Metabolism & Toxicology 13: 1–3.
- He, Q., Z. Zhang, F. Gao, Y. Li, and J. Shi. 2011. “In vivo Biodistribution and Urinary Excretion of Mesoporous Silica Nanoparticles: Effects of Particle Size and PEGylation.” Small 7: 271–280.
- Hild, W., K. Pollinger, A. Caporale, C. Cabrele, M. Keller, N. Pluym, A. Buschauer, et al. 2010. “G Protein-Coupled Receptors Function as Logic Gates for Nanoparticle Binding and Cell Uptake.” Proceedings of the National Academy of Sciences of the United States of America 107: 10667–10672.
- Hudson, S. P., R. F. Padera, R. Langer, and D. S. Kohane. 2008. “The Biocompatibility of Mesoporous Silicates.” Biomaterials 29: 4045–4055.
- Jennen, D. G. J., C. Magkoufopoulou, H. B. Ketelslegers, M. H. M. Van Herwijnen, J. C. S. Kleinjans, and J. H. M. Van Delft. 2010. “Comparison of HepG2 and HepaRG by Whole-Genome Gene Expression Analysis for the Purpose of Chemical Hazard Identification.” Toxicological Sciences 115: 66–79.
- Jennings, P., A. Limonciel, L. Felice, and M. O. Leonard. 2013. “An Overview of Transcriptional Regulation in Response to Toxicological Insult.” Archives of Toxicology 87: 49–72.
- Kanebratt, K. P., and T. B. Andersson. 2008. “HepaRG Cells as an in Vitro Model for Evaluation of Cytochrome P450 Induction in Humans.” Drug Metabolism and Disposition 36: 137–145.
- Kim, J. A., A. Salvati, C. Aberg, and K. A. Dawson. 2014. “Suppression of Nanoparticle Cytotoxicity Approaching In Vivo Serum Concentrations: Limitations of In Vitro Testing for Nanosafety.” Nanoscale 6: 14180–14184.
- Li, T., X. Shen, Y. Geng, Z. Chen, L. Li, S. Li, H. Yang, C. Wu, H. Zeng, and Y. Liu. 2016. “Folate-Functionalized Magnetic-Mesoporous Silica Nanoparticles for Drug/Gene Codelivery To Potentiate the Antitumor Efficacy.” ACS Applied Materials & Interfaces 8: 13748–13758.
- Li, Z., J. C. Barnes, A. Bosoy, J. F. Stoddart, and J. I. Zink. 2012. “Mesoporous Silica Nanoparticles in Biomedical Applications.” Chemical Society Reviews 41: 2590–2605.
- Lison, D., L. C. Thomassen, V. Rabolli, L. Gonzalez, D. Napierska, J. W. Seo, M. Kirsch-Volders, P. Hoet, C. E. Kirschhock, and J. A. Martens. 2008. “Nominal and Effective Dosimetry of Silica Nanoparticles in Cytotoxicity Assays.” Toxicological Sciences 104: 155–162.
- Liu, T., L. Li, X. Teng, X. Huang, H. Liu, D. Chen, J. Ren, J. He, and F. Tang. 2011. “Single and Repeated Dose Toxicity of Mesoporous Hollow Silica Nanoparticles in Intravenously Exposed Mice.” Biomaterials 32: 1657–1668.
- Lobenhofer, E. K., X. Cui, L. Bennett, P. L. Cable, B. A. Merrick, G. A. Churchill, and C. A. Afshari. 2004. “Exploration of Low-Dose Estrogen Effects: Identification of No Observed Transcriptional Effect Level (NOTEL).” Toxicologic Pathology 32: 482–492.
- Lu, J., M. Liong, Z. Li, J. I. Zink, and F. Tamanoi. 2010. “Biocompatibility, Biodistribution, and Drug-Delivery Efficiency of Mesoporous Silica Nanoparticles for Cancer Therapy in Animals.” Small 6: 1794–1805.
- Miao, J., S. Fang, J. Lee, C. Comstock, K. E. Knudsen, and J. K. Kemper. 2009. “Functional Specificities of Brm and Brg-1 Swi/Snf ATPases in the Feedback Regulation of Hepatic Bile Acid Biosynthesis.” Molecular and Cellular Biology 29: 6170–6181.
- Nyalosaso, J., E. Rascol, C. Pisani, C. Dorandeu, X. Dumail, M. Maynadier, M. Gary-Bobo, et al. 2016. “Synthesis, Decoration, and Cellular Effects of Magnetic Mesoporous Silica Nanoparticles.” RSC Advances 6: 57275–57283.
- Perry, J. L., K. G. Reuter, M. P. Kai, K. P. Herlihy, S. W. Jones, J. C. Luft, M. Napier, J. E. Bear, and J. M. Desimone. 2012. “PEGylated PRINT Nanoparticles: The Impact of PEG Density on Protein Binding, Macrophage Association, Biodistribution, and Pharmacokinetics.” Nano Letters 12: 5304–5310.
- Pisani, C., J.-C. Gaillard, M. Odorico, J. L. Nyalosaso, C. Charnay, Y. Guari, J. Chopineau, J.-M. Devoisselle, J. Armengaud, and O. Prat. 2017a. “The timeline of corona formation around silica nanocarriers highlights the role of the protein interactome.” Nanoscale 9: 1840–1851.
- Pisani, C., J. C. Gaillard, V. Nouvel, M. Odorico, J. Armengaud, and O. Prat. 2015. “High-Throughput, Quantitative Assessment of the Effects of Low-Dose Silica Nanoparticles on Lung Cells: Grasping Complex Toxicity with a Great Depth of Field.” BMC Genomics 16: 315.
- Pisani, C., E. Rascol, C. Dorandeu, J.-C. Gaillard, C. Charnay, Y. Guari, J. Chopineau, J. Armengaud, J.-M. Devoisselle, and O. Prat. 2017b. “The Species Origin of the Serum in the Culture Medium Influences the In Vitro Toxicity of Silica Nanoparticles to HepG2 cells.” PLoS One 12: e0182906.
- Rascol, E., M. Daurat, A. Da Silva, M. Maynadier, C. Dorandeu, C. Charnay, M. Garcia, et al. 2017. “Biological Fate of Fe3O4 Core-Shell Mesoporous Silica Nanoparticles Depending on Particle Surface Chemistry.” Nanomaterials 7: 162.
- Rho, W.-Y., H.-M. Kim, S. Kyeong, Y.-L. Kang, D.-H. Kim, H. Kang, C. Jeong, D.-E. Kim, Y.-S. Lee, and B.-H. Jun. 2014. “Facile Synthesis of Monodispersed Silica-Coated Magnetic Nanoparticles.” Journal of Industrial and Engineering Chemistry 20: 2646–2649.
- Rushmore, T. H., and A. Tony Kong. 2002. “Pharmacogenomics, Regulation and Signaling Pathways of Phase I and II Drug Metabolizing Enzymes.” Current Drug Metabolism 3: 481–490.
- Russell, W. M. S., and R. L. Burch. 1959. The Principles of Humane Experimental Technique. London, UK: Methuen & Co., Ltd.
- Savarala, S., S. Ahmed, M. A. Ilies, and S. L. Wunder. 2010. “Formation and Colloidal Stability of DMPC Supported Lipid Bilayers on SiO2 Nanobeads.” Langmuir 26: 12081–12088.
- Sergent, J.-A., V. Paget, and S. Chevillard. 2012. “Toxicity and Genotoxicity of Nano-SiO2 on Human Epithelial Intestinal HT-29 Cell Line.” Annals of Occupational Hygiene 56: 622–630.
- Turpeinen, M., A. Tolonen, C. Chesne, A. Guillouzo, J. Uusitalo, and O. Pelkonen. 2009. “Functional Expression, Inhibition and Induction of CYP Enzymes in HepaRG Cells.” Toxicology in Vitro 23: 748–753.
- Uz, M., V. Bulmus, and S. Alsoy Altinkaya. 2016. “Effect of PEG Grafting Density and Hydrodynamic Volume on Gold Nanoparticle–Cell Interactions: An Investigation on Cell Cycle, Apoptosis, and DNA Damage.” Langmuir 32: 5997–6009.
- Vallet-Regí, M., F. Balas, and D. Arcos. 2007. “Mesoporous Materials for Drug Delivery.” Angewandte Chemie International Edition 46: 7548–7558.
- Vinken, M. 2016. “The Adverse Outcome Pathway for Cholestatic Liver Injury: From Mechanisms to Predictive Human Toxicology.” Toxicology Letters 258:S47.
- Vivero-Escoto, J. L., I. Slowing, B. G. Trewyn, and V. S. Lin. 2010. “Mesoporous Silica Nanoparticles for Intracellular Controlled Drug Delivery.” Small 6: 1952–1967.
- Witasp, E., N. Kupferschmidt, L. Bengtsson, K. Hultenby, C. Smedman, S. Paulie, A. E. Garcia-Bennett, and B. Fadeel. 2009. “Efficient Internalization of Mesoporous Silica Particles of Different Sizes by Primary Human Macrophages without Impairment of Macrophage Clearance of Apoptotic or Antibody-Opsonized Target Cells.” Toxicology and Applied Pharmacology 239: 306–319.
- Wright, W. R., K. Parzych, D. Crawford, C. Mein, J. A. Mitchell, and M. J. Paul-Clark. 2012. “Inflammatory Transcriptome Profiling of Human Monocytes Exposed Acutely to Cigarette Smoke.” PLoS One 7: e30120.
- Xie, J., S. Lee, and X. Chen. 2010. “Nanoparticle-Based Theranostic Agents.” Advanced Drug Delivery Reviews 62: 1064–1079.
- Yang, P., S. Gai, and J. Lin. 2012. “Functionalized Mesoporous Silica Materials for Controlled Drug Delivery.” Chemical Society Reviews 41: 3679–3698.
- Zarbl, H., M. A. Gallo, J. Glick, K. Y. Yeung, and P. Vouros. 2010. “The Vanishing Zero Revisited: Thresholds in the Age of Genomics.” Chemico-Biological Interactions 184: 273–278.
- Zollner, G., P. Fickert, R. Zenz, A. Fuchsbichler, C. Stumptner, L. Kenner, P. Ferenci, et al. 2001. “Hepatobiliary Transporter Expression in Percutaneous Liver Biopsies of Patients with Cholestatic Liver Diseases.” Hepatology 33: 633–646.
- Zollner, G., H.-U. Marschall, M. Wagner, and M. Trauner. 2006. “Role of Nuclear Receptors in the Adaptive Response to Bile Acids and Cholestasis: Pathogenetic and Therapeutic Considerations.” Molecular Pharmaceutics 3: 231–251.