
Abstract
To keep pace with its rapid development an efficient approach for the risk assessment of nanomaterials is needed. Grouping concepts as developed for chemicals are now being explored for its applicability to nanomaterials. One of the recently proposed grouping systems is DF4nanoGrouping scheme. In this study, we have developed three structure-activity relationship classification tree models to be used for supporting this system by identifying structural features of nanomaterials mainly responsible for the surface activity. We used data from 19 nanomaterials that were synthesized and characterized extensively in previous studies. Subsets of these materials have been used in other studies (short-term inhalation, protein carbonylation, and intrinsic oxidative potential), resulting in a unique data set for modeling. Out of a large set of 285 possible descriptors, we have demonstrated that only three descriptors (size, specific surface area, and the quantum-mechanical calculated property ‘lowest unoccupied molecular orbital’) need to be used to predict the endpoints investigated. The maximum number of descriptors that were finally selected by the classification trees (CT) was very low– one for intrinsic oxidative potential, two for protein carbonylation, and three for NOAEC. This suggests that the models were well-constructed and not over-fitted. The outcome of various statistical measures and the applicability domains of our models further indicate their robustness. Therefore, we conclude that CT can be a useful tool within the DF4nanoGrouping scheme that has been proposed before.
Introduction
The development of efficient approaches for the assessment of potential human health effects of nanomaterials is an ongoing effort. The potential for nanomaterials to improve material properties and consumer products is widely acknowledged (Godwin et al. Citation2015). Modifications of the (surface-related) physicochemical properties of nanomaterials may change the interactions of the materials with biological components (Hussain et al. Citation2015; Sauer et al. Citation2015). Risk assessment approaches as established for chemicals are under pressure as nanomaterials are being developed in an increasing number of types, and for different applications (Stone et al. Citation2014). It seems impracticable and economically undesirable to fully test all nanomaterials variabilities. This would also contradict the societal demands and legal requirements to reduce animal testing (EU Citation2006; ECHA Citation2008; Hartung Citation2009; Burden et al. Citation2017). At the same time it needs to be acknowledged that a wealth of experimental data on the toxic potential of nanomaterials has been generated (Krug Citation2014). The selection of data to be used in the risk assessment of nanomaterials is challenging as quite some discordant study results have been published, even for relatively clear-cut toxicological endpoints, such as genotoxicity (Oesch and Landsiedel Citation2012).
To keep pace with the rapid development of nanomaterials, grouping concepts as already developed for chemicals (ECHA 2008) are currently established for nanomaterials as well (Arts et al. Citation2014, Citation2015; Oomen et al. Citation2014; Stone et al. Citation2014; Bos et al. Citation2015; Godwin et al. Citation2015; Braakhuis, Oomen, and Cassee Citation2016; Landsiedel Citation2016). Most of the current grouping approaches involve to some extent the nanomaterial intrinsic properties and their biophysical interactions (i.e. system-dependent properties) in the perspective of the nanomaterial’s life cycle (Arts et al. Citation2014). Recently, a functionality driven framework for grouping of nanomaterials, the so-called DF4nanoGrouping framework has been proposed (Arts et al. Citation2015, Citation2016). In this approach nanomaterials are categorized in four groups (with possible subgroups). The first main group (MG1) consists of soluble nanomaterials. The second main group (MG2) contains nanomaterials with high bio persistence and high aspect ratio. In the third main group (MG3), there are nanomaterials without obvious biological effects (‘passive’). Finally, in the fourth main group (MG4) there are ‘active’ nanomaterials – those demonstrating surface-related specific toxic properties (Arts et al. Citation2015). To some extent, this approach combines intrinsic properties with system-dependent properties and toxicological effects. For example, the solubility of a nanomaterial can be regarded as an intrinsic property, but its dissolution rate is also highly dependent on the environmental conditions (Tantra et al. Citation2016). Detailed sub-grouping, especially in the group of active nanomaterials should be amended to this concept, and should be related to mechanisms of action, ideally integrated into the adverse outcome pathway concept (Ankley et al. Citation2010; Becker et al. Citation2015; Riebeling et al. Citation2016). A Bayesian network approach toward this concept has recently been described (Marvin et al. Citation2017).
A few computational (Quantitative) Structure–Activity Relationship ((Q)SAR) approaches have been developed for nanomaterials, mainly to explain and predict the toxicity of metal oxide nanomaterials (Fourches, Pu, and Tropsha Citation2011; Puzyn et al. Citation2011b; Gajewicz et al. Citation2015; Toropova et al. Citation2015; Pan et al. Citation2016). A basic principle of (Q)SAR modeling is to find structural parameters (descriptors) that are responsible for the observed biophysical interactions and toxicological effects. Some of these (potential) nanomaterial descriptors can be determined experimentally with the currently available analytical nanomaterial characterization techniques. Others can be calculated using theoretical chemistry approaches (Puzyn et al. Citation2011b). Modeling can be performed either in quantitative (QSAR) or qualitative (SAR) manner, dependent on the way of expressing the endpoint (i.e. numeric value or class).
In the context of recent discussions on grouping criteria, there is a need to explore relationships between the properties (intrinsic and extrinsic) and toxicity endpoints measured for nanomaterials. Thus, within this work we aimed to develop a series of SAR classification models that support the DF4nanoGrouping scheme by linking activity of 19 nanomaterials in three assays (namely, protein carbonylation, ferric reducing ability of serum, and NOAEC from a short-term inhalation study in rats) to their structural properties.
Methods
In this study we used data from 19 nanomaterials that were synthesized and characterized extensively in the previous BMBF funded project nanoGEM (nanoGEM Citation2012; Driessen et al. Citation2015) and other projects, such as EU FP7 project MARINA. Subsets of these nanomaterials have been used in toxicological studies, both in vitro and in vivo (short-term inhalation studies) of which the data have been published before (Landsiedel et al. Citation2010, Citation2014a, Citation2014b; Klein et al. Citation2012; Buesen et al. Citation2014; Hofmann et al. Citation2016; Wiemann et al. Citation2016) (using the same nanomaterials, additional measurements were performed as described below). In total we have obtained a comprehensive data set to develop and evaluate a novel modeling approach.
Materials characterization
Data on 19 nanomaterials is used in this study. As described previously (nanoGEM Citation2012; Wohlleben et al. Citation2016) nine nanomaterials were specifically synthesized with well-specified surface modifications on three core materials (i.e. silica and zirconia; see ). These nine nanomaterials were synthesized by sol–gel or precipitation and were available in aqueous suspensions. Other nanomaterials were BaSO4 NM-220, TiO2 (NM-105, TLSF), CeO2 (Al, NM-211, 212), and DPP (Bulk, Nano, and Red), all of which were obtained as powders. A complete characterization data set is available from these studies on the nanoGEM webpage (nanoGEM Citation2012) or in the JRC nanomaterial characterization reports (only for nanomaterials as provided by the JRC) and the studies as cited (Comero et al. Citation2011; Singh et al. Citation2011; Cotogno et al. Citation2013, Citation2014; Rasmussen et al. Citation2014).
Table 1. Experimentally determined physicochemical properties.
Protein carbonylation
A previous study indicated that the analysis of protein carbonylation is correlated to the nanomaterials’ overall toxicity as evaluated by the WST-1 assay (Driessen et al. Citation2015). Therefore, we used the carbonyl patterns induced after exposing NRK-52E cells in vitro to a subset of the above described suite of nanomaterials (Driessen et al. Citation2015). Briefly, carbonyl patterns were retrieved after exposing NRK-52E cells to the different nanomaterials, followed by cells lysis. Protein carbonyls were then labeled using OxiBlot Kit (Merck Millipore, Darmstadt, Germany) according to the manufacturer’s instruction, separated by 1D gel electrophoresis and analyzed by immunoblotting. The overall level of protein carbonylation for each nanomaterial was then qualitatively classified based on the immunoblotting results as being either negative, weak, medium, or strong compared to control (Driessen et al. Citation2015).
Nanomaterial intrinsic oxidative potential (IOP)
To determine the IOP of the nanomaterials we used the ferric reduction ability of serum (FRAS) assay. The purpose of the FRAS assay was to quantify the surface reactivity of nanomaterials under physiological conditions, the so-called biological oxidative damage. The assay quantifies the decrease in the total antioxidant capacity in human blood serum which was incubated with nanomaterials as compared to unexposed human blood serum. An optimized FRAS assay protocol was described by Hsieh et al. (Citation2013) and further developed into an advanced multi-dose protocol by Gandon et al. (Citation2017). Briefly, human blood serum is incubated with nanomaterials, which are then removed by centrifugation. The remaining antioxidant capacity of human blood serum is determined by the reduction of a colorless Fe3+ complex to form a blue Fe2+ complex. This is then quantified by measuring the light absorbance at 593 nm. The depletion of the anti-oxidative capacity in human blood serum by nanomaterial’s surface reactivity reduces the blue color. The read-out of the FRAS assay is calibrated by a concentration series of Trolox (6-hydroxy-2,5,7,8-tetramethylchroman-2-carboxylic acid, a Vitamin E analogon) and the result expressed as μUFRAS/m2h.
Short-term rodent inhalation study: derivation of NOAECs
The nanomaterials from the nanoGEM project were studied in short-term inhalation studies (Buesen et al. Citation2014; Landsiedel et al. Citation2014a; Hofmann et al. Citation2016). Briefly, Wistar rats were head–nose exposed to respirable dust (3 or 10 mg/m3) for 6 h/d at five subsequent days. Animals were sacrificed at study days 5, and 26 for histopathological evaluations. In addition, body weights, clinical parameters, and broncho-alveolar lavage was evaluated (Buesen et al. Citation2014; Landsiedel et al. Citation2014a; Hofmann et al. Citation2016). From these studies NOAECs were derived and used here.
Structural descriptor calculations
In addition to 89 structural descriptors derived from experimental characterization, 562 structural descriptors were calculated as follows. These calculated descriptors include (i) 28 quantum-mechanical descriptors computed at the semi-empirical level of the theory using PM7 Hamiltonian (Stewart Citation2013) with MOPAC 2012 software package (Stewart, J.J.P., Stewart Computational Chemistry, Colorado Springs, CO, http://OpenMOPAC.net; 2012); (ii) 503 constitutional, topological, and topostructural descriptors calculated with DRAGON version 4.0 software (Talette SRL, Milan, Italy, http://.talete.mi.it/products/software.htm; 2006); and (iii) 31 elemental descriptors computed with an Elemental Descriptors Calculator version. 1.0 (DTC Lab, Kolkata, India, http://teqip.jdvu.ac.in/QSAR_Tools/; 2013). The calculations were performed based on the simplest molecular models that include only a single molecular fragment that is repeated in the shell or core structure (e.g. polyethylene glycol monomer or titanium dioxide molecule). There were, in total, 517 calculated descriptors representing properties of the nanomaterial shell and 45 descriptors of the core.
Modeling
Data on the selected endpoints were all modeled using the classification trees (CT) technique for the supervised selection of the most significant descriptors that affect the modeled endpoint and for obtaining the predictive model (Questier et al. Citation2005). The process is based on growing a tree that divides nanomaterials into mutually exclusive groups (nodes). The algorithm starts with a ‘root node’ that contains all nanomaterials. Then, they are divided into ‘child nodes’ by recursive binary splitting. Each split is defined by a rule (threshold) considering values of the descriptor selected at a given stage. The descriptors are selected at each step based on the highest reduction of ‘impurity’ that means the binary split performed with the developed rule should lead to obtaining two maximally homogeneous groups of nanomaterials. The impurity is measured with Gini index G defined as:
(1)
where nj is the number of nanomaterials from class j present in the node (Questier et al. Citation2005).
The modeling was performed in R software package with using recursive partitioning with RPART routines.
Validation of the models
In order to appropriately validate the predictive ability of the classic SAR models, the data are split into two sets: a training set (used to develop the classification tree) and a validation set (used for verifying the classification tree’s predictive ability). However, since CT developed on the basis of very small data sets might not be robust enough, we have carried out multiple splitting to investigate the potential influence of the splitting procedure on the modeling results (Puzyn et al. Citation2011a). First, the nanomaterials were sorted in an ascending order of their activity value, i.e. starting with the least active. Every third nanomaterial was included in the validation set (V), whereas the remaining nanomaterials formed the training set (T). Then, the procedure was repeated for various splits and the results of modeling based on different training sets were compared each other. After confirming sufficient robustness of the modeling procedure, we have developed the final predictive model trained on all 19 nanomaterials.
To verify the classification tree’s predictive ability, statistical measures commonly used for qualitative modeling were applied in this study (). The first, sensitivity, measures the proportion of active nanomaterials that were correctly identified as such Equation(Equation (2))(2) . The second, specificity, defines the proportion of inactive nanomaterials that were correctly identified as such (EquationEquation (3))
(3) (Baldi et al. Citation2000; Lever, Krzywinski, and Altman Citation2016; Pradeep et al. Citation2016).
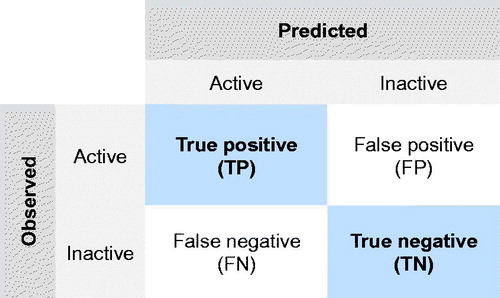
Figure 1. Confusion matrix describing the performance of a classification model (or ‘classifier’) on a set of test data for which the true values are known.
It should be emphasized, however, that limited and unbalanced training dataset might face the risk of a bias toward the majority class and yield, therefore, a very optimistic accuracy estimate. This is so-called the ‘accuracy paradox’. Thus, to alleviate this problem, balanced accuracy, which is defined as the arithmetic mean of class-specific accuracies, was employed instead of standard accuracy (EquationEquation (4))(4) . It is worth noting that the balanced accuracy will be reduced to the standard accuracy (i.e. the number of correct predictions divided by the total number of predictions), if the developed classification tree will perform equally well on either class. Finally, balanced error that describes the total number of misclassified nanomaterials was employed (EquationEquation (5))
(5) .
(2)
(3)
(4)
(5)
As the predictive ability of the model may depend on the splitting, so-called ‘consensus fuzzy predicting’ was applied, i.e. calculating the probability of being active and inactive based on the responses from models derived with different splits.
Among the various validation aspects, the applicability domain (AD) plays a crucial role for estimating the uncertainty in predictions. Thus, in order to verify whether a given nanomaterial lies within the intended domain of model’s applicability or not, as well as to confirm whether the prediction for particular nanomaterial is trustworthy or not, the AD was determined by using basic theory of the standardization approach. The standardization is a simple method for defining the X-outliers (in the case of the training set) and identifying the compounds that reside outside the domain (in the case of the validation set and prediction set) (Roy, Kar, and Ambure Citation2015).
Results
Experimentally derived physicochemical properties
In this study, we used data from 24 nanomaterials synthesized and investigated in a previous study. We extracted the data and focused on the physicochemical properties to be used in our models. The main experimental descriptors used for modeling are summarized in (and Supplementary Table S1). For most of the nanomaterials surface chemistry variations were available; the chemical structures in the shell of these nanomaterials is indicated in .
Table 2. Nanomaterial surface coatings.
Calculated quantum-mechanical properties
The complete list of descriptors (both experimental and calculated) can be found in the Supplementary material (Table S2). Descriptor pre-processing was done in two stages: (a) removing descriptors with missing values, (b) removing descriptors with zero variance (descriptors with non-unique values, e.g. all equal to zero). After winnowing out only the useful descriptors, they were used for developing the predictive models. In effect 285 descriptors were retained for modeling (Table S1a).
Nanomaterial IOP
The IOP of the nanomaterials was determined using the FRAS assay, the result expressed as μUFRAS/m2h ().
Table 3. Summary of the nanomaterial intrinsic oxidative potential, protein carbonylation, and NOAECs derived from short-term inhalation studies (STIS).
Protein carbonylation
The protein carbonylation data were taken from (Driessen et al. Citation2015). The labels used as input for CT were based on the original qualitative values. Nanomaterials lacking a protein carbonylation effect were labeled as ‘Inactive’. Nanomaterials with weak, medium, and strong protein carbonylation effect were labeled as ‘Active’.
NOAECs derived from the literature
For the modeling in our study we extracted the NOAECs from the short-term inhalation studies as reported earlier (Buesen et al. Citation2014; Landsiedel et al. Citation2014a; Hofmann et al. Citation2016). The NOEACs used are listed in .
Modeling
Protein carbonylation
Protein carbonylation data for 10 nanomaterials were included in this study. Six of them were inactive, whereas, four exhibited various levels of activity (). Thus, the studied nanomaterials were divided into two classes: active (A) and inactive (I).
Table 4. Activity in protein carbonylation assay.
In the next step, we developed a classification tree model for predicting protein carbonylation activity of the remaining (not analyzed experimentally) nine nanomaterials. The developed model () utilizes two descriptors for discriminating nanomaterials into either active or non-active group. These are: ‘Size’ – the primary particle diameter and ‘SSA’ – surface area (BET intrusion). Only one nanomaterial was classified incorrectly (), which gives the following formal values of balanced accuracy: 80%, balanced error: 10%, sensitivity: 80%, and specificity: 100%. Those parameters are satisfying, since in practice, models with accuracy at the level of 70–90% are widely accepted (Linden and Yarnold Citation2016).
Figure 2. Classification tree for the protein carbonylation assay. Active nanomaterials are indicated with red; inactive with green color. Please note that the classification tree uses the auto scaled values of the descriptors. Thus, size≥ −0.41 corresponds to 12.5 nm and SSA≥ −1.4 corresponds to 47.9 m2/g.
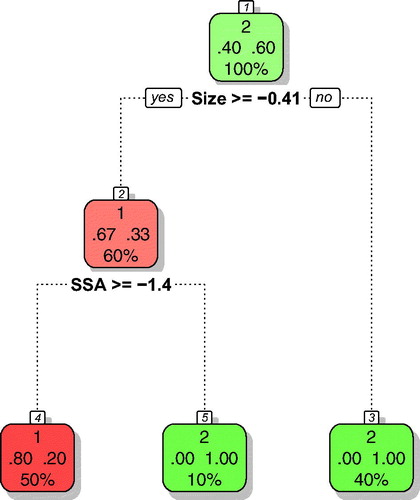
The assessment of the AD of the developed models indicated no outliers and neither of the validation compounds reside outside the AD (). At the same time it can be observed that four of nine prediction compounds (i.e. experimentally untested nanomaterials) were found outside the AD. This can be explained by the fact that all those compounds (i.e. CeO2, CeO2.Al, DPP.BULK, and DPP.NANO) lie beyond the range of the values of the size descriptor used to develop a classification tree.
Please note that the model discussed above was obtained by using a complete experimental data set, available for 10 nanomaterials. We validated our model by multiple splitting the data in two sets: ‘training set’ – with seven nanomaterials, and ‘validation set’ consisted of three remaining nanomaterials. Detailed results of the multiple validation together with the ‘splitting patterns’ are presented in .
Table 5. Validation of the model robustness (protein carbonylation assay).
Interestingly, independent from the splitting pattern, we observed that one inactive nanomaterial, namely, SiO2.PEG was falsely predicted to be active (false positive), while remaining nanomaterials were classified correctly. Since each validation set contained one active and two inactive nanomaterials, the models were also sensitive enough to discriminate active from inactive nanomaterials. However, since the predictive ability of the model may depend on the splitting, we applied so-called ‘consensus fuzzy predicting’ concept. That is, we calculated the probability of being active and inactive based on the responses from models derived with different splits and put the results together with the activity predicted based on the model developed for the complete set of experimental data ().
Table 6. Original and consensus fuzzy predictions of protein carbonylation for untested nanomaterials.
Independently on the splitting, we observed that three of nine untested compounds (i.e. CeO2.Al, DPP.NANO, and TiO2.TLSF) were predicted as active, while remaining prediction nanomaterials were predicted as inactive (). This is also in agreement with the results predicted by the model developed without dividing nanomaterials into the training and validation sets.
Nanomaterial IOP
A similar procedure has been applied for modeling the nanomaterial IOP. Experimental measurements have been performed for nine nanomaterials. Activity in IOP was transformed into binary scale by setting up a threshold of 0.01921 μU FRAS/m2h (1% of Mn2O3 reactivity, personal communication Dr. Wendel Wohlleben). Reactivity of nanomaterials was divided into three classes based on the reactivity of Mn2O3 as positive control (this material is highly reactive and non-soluble, thus effects are truly surface-induced): reactive >10% of positive control; intermediate 1–10%; non-oxidative <1% of positive control (Arts et al. Citation2015). Five nanomaterials with activities of ≥0.01921 μU FRAS/m2h () were qualified as active (A), whereas, four with activities of <0.01921 μU FRAS/m2h were qualified as inactive (I). The developed model () utilizing only one descriptor (‘Size’ – primary particle diameter) was characterized by 100% of balanced accuracy. Here, too, we repeated the modeling in order to validate robustness of the model for three various splits (). Independent from the split, the accuracy for validation was always 100%.
Figure 3. Classification tree for nanomaterial intrinsic oxidative potential. Active nanomaterials are indicated with red; inactive with green color. Please note that the classification tree uses the auto scaled values of the descriptors. Thus, size≥ −0.41 corresponds to 23.83 nm.
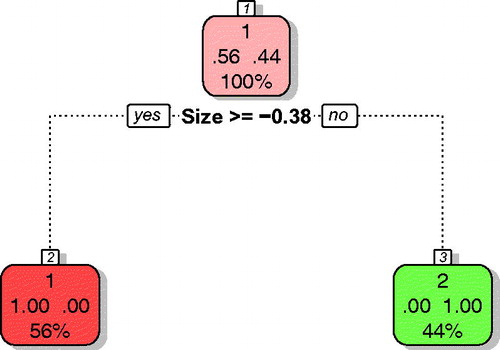
Table 7. Nanomaterial intrinsic oxidative potential.
Table 8. Validation of model robustness (nanomaterial intrinsic oxidative potential).
As performed on the classification tree for the protein carbonylation assay, the model’s AD was defined using the standardization approach. The results summarized in , confirm that one nanomaterial from the validation set (i.e. DPP.BULK) resides outside the AD. This could have been expected, realizing that DPP.BULK was shown to have the highest values of the size descriptor used to develop a classification tree. As DPP.BULK is dissimilar from all other compounds used for the model development in terms of structural domain, its model prediction should be treated, therefore, with considerable caution as potentially less reliable.
By performing multiple splitting and applying consensus fuzzy prediction, we were able to confirm previous predictions (). The activity of the studied nanomaterials in the IOP assay was predicted using only the primary diameter of the particle. We noticed that nanomaterials of size equal or larger than 23.83 nm (that corresponds to the auto scaled value of −0.38) were classified as active. Although, this is in contrast to the usually observed trend according to which the activity increases with decreasing size (Oberdorster, Oberdorster, and Oberdorster Citation2005; Ivask et al. Citation2014).
Table 9. Original and consensus fuzzy predictions of nanomaterial intrinsic oxidative potential for untested nanomaterials.
NOAEC derived from a short-term inhalation study in rats
The modeling procedure has been applied in case of the NOAECs derived from a short-term inhalation study in rats. The experimental data () were obtained for 17 nanomaterials and then transformed into binary scale: 10 inactive (NOAEC ≥10 mg/m3) and 7 active (NOAEC <10 mg/m3) (Arts et al. Citation2015) ().
Figure 4. Classification tree for a short-term inhalation study in rats. Active nanomaterials are indicated with red; inactive with green color. Please note that the classification tree uses the auto scaled values of the descriptors. Thus, LUMO_C< −0.61 corresponds to −2.40 eV; SSA ≥0.99 corresponds to 158.48 m2/g, and Shelpres <0.05 to the value of 0.5.
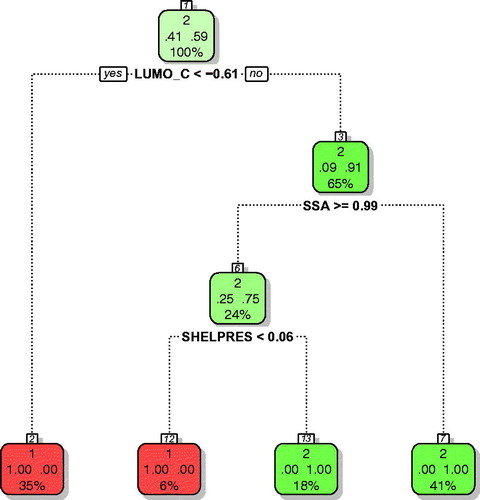
Table 10. Activity in a short-term inhalation study in rats.
The model utilizes four descriptors: LUMO_C (calculated energy of the lowest unoccupied molecular orbital of nanomaterial’s core), size (primary particle diameter), SSA (surface area/BET intrusion), and SHELPRES (coating presence, 0 – not or 1 – yes binary values). Mechanistic interpretation of the model is provided in ‘Discussion’ section.
Balanced accuracy calculated based on the training set containing all 17 nanomaterials was 100%, balanced error: 0%, sensitivity: 100% and specificity: 100%. When applying multiple splitting validation (), those statistics are not so perfect, but still do not differ substantially from other models published in the literature. As shown in , the results obtained using the standardization approach, confirmed that there is no outlier in the case of the training set and neither of the compounds reside outside the AD in the case of the validation and prediction sets.
Table 11. Validation of model robustness (a short-term inhalation study in rats).
Predictions were independent on the way the model was developed and the splitting pattern; both untested nanomaterials were predicted to be inactive ().
Table 12. Original and consensus fuzzy predictions of activity in a short-term inhalation study in rats for untested nanomaterials.
Discussion
Based on the classification tree technique, we have developed three structure-activity relationships (SAR) models for nanomaterials that support the DF4nanoGrouping scheme by linking the activity of 19 nanomaterials in three independent assays (that is: protein carbonylation, nanomaterial’s IOP, and rodent short-term inhalation study outcome) to their structural properties.
Most recently published Nano-(Q)SAR models (Fourches, Pu, and Tropsha Citation2011; Puzyn et al. Citation2011b; Gajewicz et al. Citation2015; Toropova et al. Citation2015; Mu et al. Citation2016; Pan et al. Citation2016; Basant and Gupta Citation2017; Fjodorova et al. Citation2017; Gajewicz Citation2017) have been developed based on a very small data set compared with the data sets underlying classic (chemical) (Q)SAR models. The problem of limited availability of experimental data that are suitable for nano-(Q)SAR modeling has been widely discussed in the literature (Puzyn et al. Citation2011b; Oksel et al. Citation2016; Banares et al. Citation2017). Although models developed on limited data are certainly less robust and do not cover the whole space of all theoretical variations of the structure, we do believe they provide useful information. In particular, these models can be used to reveal the most important structural factors (i.e. key descriptors) bridging to nanomaterial properties and the observed effects. Oksel et al. (Citation2017) proposed three criteria on datasets for modeling: data should be obtained from a preferably single and standardized protocol; its accuracy and suitability for (Q)SAR analysis should be examined; and datasets should be large enough to allow rational division of the data into training and test sets (Oksel et al. Citation2017). Here we have used a unique dataset that fulfills these criteria, in that it comprises a very well characterized panel of nanomaterials that has been evaluated in different assays, both, in vitro and – importantly – in vivo (short-term inhalation). Available larger data sets usually comprise data from nanomaterials that have been synthesized in house and are evaluated with relatively straightforward in vitro screens (see Oksel et al. Citation2016). Here we have used a dataset of materials that in part have industrial relevance, that uniquely incorporates in vivo data, and could be evaluated using the DF4nanoGrouping scheme.
The principle of the DF4nanoGrouping scheme (Arts et al. Citation2014) is to assign a nanomaterial to one of four main groups: soluble nanomaterials [main group (MG1)]; bio persistent high aspect-ratio nanomaterials (MG2); bio persistent, non-fibrous passive nanomaterials (MG3); and bio persistent, non-fibrous, active nanomaterials (MG4). The grouping scheme is structured into three tiers of data collection. In the first tier mainly the intrinsic nanomaterial properties are characterized (Tier 1). This is followed by the assessment of system-dependent (extrinsic) nanomaterial properties (Tier 2) in combination with in vitro studies. Analytical chemistry characterization of the nanomaterials in their natural environment and data of a limited number of in vitro studies are used to assess whether a nanomaterial can be assigned to MG2 and to distinguish between passive and active nanomaterials (MG3 and MG4). Finally, in vivo studies addressed in Tier 3 are aimed to confirm the distinction between passive and active nanomaterials (Arts et al. Citation2014). While others have proposed different grouping schemes they, all boil down to the same principle: identifying key descriptors of nanomaterials that are most straightforward to experimentally determine and relate these to the respective biological effects (Oomen et al. Citation2014; Dekkers et al. Citation2016).
Obviously, classification of nanomaterials into MG1 and MG2 is possible using relatively easily obtained data (Tier 1, i.e. solubility and aspect ratio). The most problematic step is to decide whether the nanomaterial neither previously assigned to MG1 nor MG2 is passive (MG3) or active (MG4). For this purpose SAR modeling might be very valuable, either to directly predict the nanomaterial activity or to prioritize subsets of nanomaterials for further experimental evaluation. Here we analyzed three cases. First, the case of protein carbonylation, for this two parameters were identified as suitable descriptors, the primary particle diameter (‘Size’), and specific surface area (SSA) were identified as the key structural parameter for grouping for this endpoint. The key structural parameter for grouping was size that separated the smallest coted ZrO2 nanomaterials from the others. Subsequently, the SSA was identified for subsequent classification, where nanomaterials with a large SSA were classified as active, as described previously (Driessen et al. Citation2015). The intrinsic oxidation potential could be predicted using the primary particle diameter (‘Size’), as the only descriptive parameter. Surprisingly it separates nine smaller nanomaterials (i.e. CeO2.NM-211, SiO2.NH3, SiO2.PEG, SiO2PO3, SiO2.UNMOD, ZrO2.ACR, ZrO2.NH3, ZrO2.PEG, and ZrO2.TOD) from the others. Even, although the number of studied nanomaterials was not large, and not all possible variations in the structure have been represented in the data set, the classification results lead to interesting conclusions. The simple rule ‘the smaller the size the larger the toxicity’ does not always hold true. Our results indicate that this needs to be refined taking the surface reactivity into account. For instance, the small ZrO2 nanomaterials all contained a coating. If a nanomaterial’s core is small, but has a coating on its surface, the (absolute) surface that is available for reactions is smaller compared to the surface of larger nanomaterials. Unfortunately, no uncoated ZrO2 nanomaterials were available.
The third model was developed for the NOAECs derived from a rodent short-term inhalation study. In this case, the most important parameter deciding on the activity was the energy of the lowest unoccupied molecular orbital calculated with quantum-mechanical methods for the nanoparticle’s core (LUMO_C). This parameter is related to the surface redox activity of nanomaterials. In the Hartree–Fock calculations the energy level of LUMO corresponds to the material’s electron affinity. Thus, in case of those nanomaterials having high negative values of, large amounts of energy are released in response to the attachment of additional electrons at the surface. For semi-conducting nanomaterials, the energy of LUMO can be used as the first approximation of the conduction band level. As previously discussed by (Gajewicz et al. Citation2015), the energy of the conduction band is the key parameter for assessing the ability of a nanomaterial surface to interfere with the naturally occurring intracellular redox reactions. The high intensity of such reactions may disturb the natural redox balance and result in high concentration of reactive oxygen species. In our study, nanomaterials having a LUMO_C< −2.40 eV (i.e. nanomaterials with TiO2 or CeO2 cores) were classified as active at the first stage. In the next stage, the nanomaterials with a relatively small (<158.49 m2/g) SSA were classified as inactive. The only nanomaterials with sufficiently large SSAs (≥158.48 m2/g) were those having a SiO2 core. However, only uncoated SiO2 (SiO2.UNMOD) was active; the presence of a coating (SHELPRES =1) led to reduction of the activity.
CT are widely used for classification and prediction, as they automatically select the descriptors most relevant to a specific endpoint (Wang et al. Citation2006; Ma et al. Citation2008). They have successfully been used for both large and small datasets (Oksel et al. Citation2016). CT have proven especially useful with ‘noisy’ data, e.g. nanoparticle toxicity (Thomas et al. Citation2014; Oksel et al. Citation2015; Oksel et al. Citation2016), where they can be used for pre-screening and reducing redundant variables. Besides key descriptors a classification tree also gives a set of property value thresholds, which also may be useful for designing nanomaterials. The most commonly used methods for verification of the quality of CT predictions are the four statistical measures used in this study: accuracy, error rate, sensitivity, and specificity. One should note that the values of these statistical measures obtained in this study are quite high and comparable with the parameters developed in similar studies (Oksel et al. Citation2016). In addition we assessed the AD of our models as this is crucial for estimating the uncertainty in predictions. Only the classification of one nanomaterial in one of our models was outside its AD. Moreover, the maximum number of descriptors that were finally selected by the CT was very low – one for IOP, two for protein carbonylation, and three for NOAEC. This suggests that the models were well constructed and not over-fitted.
From an integrated testing strategy perspective, there is a strong incentive to maximally increase the (cost) efficiency of experimental testing and to reduce animal experimentation. The three models developed here use three descriptors, the primary particle diameter (‘Size’), SSA, and the energy of the lowest unoccupied molecular orbital calculated with quantum-mechanical methods for the nanoparticle’s core (LUMO_C). We explored if one of the models could predict the outcome of the other, or if the in vitro data-based models predicts the in vivo results, this however, did not result in a reliable correlation (data not shown). Grouping has been identified as an important tool to assess weather hazard data on one form of a nanomaterial can extrapolated to other forms of this nanomaterial. ECHA has identified that a robust scientific explanation is needed to underpin the definition of a group (ECHA Citation2017). CT like developed here, can contribute to such a scientific underpinning of grouping. Here we have shown that CT can be a useful tool within the DF4nanoGrouping scheme that has been proposed before.
Conclusion
In this study, we have developed three SAR classification tree models showing that even with relatively small data sets reliable predictions can be achieved. The maximum number of descriptors that were finally selected by the CT was very low – one for IOP, two for protein carbonylation, and three for NOAEC. This suggests that the models were well constructed and not over-fitted. The outcome of various statistical measures and the ADs of our models further indicate their robustness. We, therefore, conclude that CT can be a useful tool within the DF4nanoGrouping scheme that has been proposed before.
A._GAJEWICZ_ET_AL_Supplementary_content.zip
Download Zip (85.5 KB)Disclosure statement
Authors declare that they have no financial or non-financial competing interests. All authors collaborate with several companies via National and European projects. RL and MIL are employers of BASF SE, a chemical company producing and marketing chemical formulations.
Additional information
Funding
Related Research Data
References
- Ankley, G. T., R. S. Bennett, R. J. Erickson, D. J. Hoff, M. W. Hornung, R. D. Johnson, D. R. Mount, et al. 2010. “Adverse Outcome Pathways: A Conceptual Framework to Support Ecotoxicology Research and Risk Assessment.” Environmental Toxicology and Chemistry 29 (3): 730–741. doi:10.1002/etc.34.
- Arts, J. H., M. Hadi, M. A. Irfan, A. M. Keene, R. Kreiling, D. Lyon, M. Maier, et al. 2015. “A Decision-Making Framework for the Grouping and Testing of Nanomaterials (DF4nanoGrouping).” Regulatory Toxicology and Pharmacology 71 (2): S1–S27. Doi:org/https://doi.org/10.1016/j.yrtph.2015.03.007.
- Arts, J. H., M. Hadi, A. M. Keene, R. Kreiling, D. Lyon, M. Maier, K. Michel, et al. 2014. “A Critical Appraisal of Existing Concepts for the Grouping of Nanomaterials.” Regulatory Toxicology and Pharmacology 70 (2): 492–506. doi:https://doi.org/10.1016/j.yrtph.2014.07.025.
- Arts, J. H., M. A. Irfan, A. M. Keene, R. Kreiling, D. Lyon, M. Maier, K. Michel, et al. 2016. “Case Studies Putting the Decision-Making Framework for the Grouping and Testing of Nanomaterials (DF4nanoGrouping) into Practice.” Regulatory Toxicology and Pharmacology 76: 234–261. doi:https://doi.org/10.1016/j.yrtph.2015.11.020.
- Baldi, P., S. Brunak, Y. Chauvin, C. A. F. Andersen, and H. Nielsen. 2000. “Assessing the Accuracy of Prediction Algorithms for Classification: An Overview.” Bioinformatics 16 (5): 412–424. doi:org/10.1093/bioinformatics/16.5.412.
- Banares, M. A., A. Haase, L. Tran, V. Lobaskin, G. Oberdorster, R. Rallo, J. Leszczynski, et al. 2017. “CompNanoTox2015: Novel Perspectives from a European Conference on Computational Nanotoxicology on Predictive Nanotoxicology.” Nanotoxicology 11 (7): 839–845. doi: 10.1080/17435390.2017.1371351.
- Basant, N., and S. Gupta. 2017. “Multi-Target QSTR Modeling for Simultaneous Prediction of Multiple Toxicity Endpoints of Nano-Metal Oxides.” Nanotoxicology 11 (3): 339–350. doi:https://doi.org/10.1080/17435390.2017.1302612.
- Becker, R. A., G. T. Ankley, S. W. Edwards, S. W. Kennedy, I. Linkov, B. Meek, M. Sachana, et al. 2015. “Increasing Scientific Confidence in Adverse Outcome Pathways: Application of Tailored Bradford-Hill Considerations for Evaluating Weight of Evidence.” Regulatory Toxicology and Pharmacology 72 (3): 514–537. doi:https://doi.org/10.1016/j.yrtph.2015.04.004.
- Bos, P. M., S. Gottardo, J. J. Scott-Fordsmand, M. van Tongeren, E. Semenzin, T. F. Fernandes, D. Hristozov, et al. 2015. “The MARINA Risk Assessment Strategy: A Flexible Strategy for Efficient Information Collection and Risk Assessment of Nanomaterials.” International Journal of Environmental Research and Public Health 12 (12): 15007–15021. doi:https://doi.org/10.3390/ijerph121214961.
- Braakhuis, H. M., A. G. Oomen, and F. R. Cassee. 2016. “Grouping Nanomaterials to Predict Their Potential to Induce Pulmonary Inflammation.” Toxicology and Applied Pharmacology 299: 3–7. doi:https://doi.org/10.1016/j.taap.2015.11.009.
- Buesen, R., R. Landsiedel, U. G. Sauer, W. Wohlleben, S. Groeters, V. Strauss, H. Kamp, and B. van Ravenzwaay. 2014. “Effects of SiO2, ZrO2, and BaSO4 Nanomaterials with or without Surface Functionalization upon 28-day Oral Exposure to Rats.” Archives of Toxicology 88 (10): 1881–1906. doi:https://doi.org/10.1007/s00204-014-1337-0.
- Burden, N., K. Aschberger, Q. Chaudhry, M. J. D. Clift, S. H. Doak, P. Fowler, H. Johnston, R. Landsiedel, J. Rowland, and V. Stone. 2017. “The 3Rs as a Framework to Support a 21st Century Approach for Nanosafety Assessment.” Nano Today 12: 10–13. doi: 10.1016/j.nantod.2016.06.007.
- Comero, S., C. Klein, B. Stahlmecke, J. Romazanov, T. Kuhlbusch, and E. V. Doren. 2011. “NM-300 Silver Characterisation, Stability, Homogeneity.” In NM-Series of Representative Manufactured Nanomaterials. Ispra (Italy): Joint Research Centre of the European Commission.
- Cotogno, G., P. Gibson, P. A. Clausen, P. De Temmerman, S. Hjortkjaer Nielsen, and G. Ceccone. 2013. “Synthetic Amorphous Silicon Dioxide (NM-200, NM-201, NM-202, NM-203, NM-204): Characterisation and Physico- Chemical Properties.” In NM-Series of Representative Manufactured Nanomaterials. Ispra (Italy): Joint Research Centre of the European Commission.
- Cotogno, G., P. Gibson, P. A. Clausen, P. De Temmerman, S. Hjortkjaer Nielsen, and G. Ceccone. 2014. “Titanium Dioxide, NM-100, NM-101, NM-102, NM-103, NM-104, NM-105: Characterisation and Physico-Chemical Properties.” In NM-Series of Representative Manufactured Nanomaterials. Ispra (Italy): Joint Research Centre of the European Commission.
- Dekkers, S., A. G. Oomen, E. A. J. Bleeker, R. J. Vandebriel, C. Micheletti, J. Cabellos, G. Janer, et al. 2016. “Towards a Nanospecific Approach for Risk Assessment.” Regulatory Toxicology and Pharmacology 80: 46–59. doi:10.1016/j.yrtph.2016.05.037.
- Driessen, M. D., S. Mues, A. Vennemann, B. Hellack, A. Bannuscher, V. Vimalakanthan, C. Riebeling, et al. 2015. “Proteomic Analysis of Protein Carbonylation: A Useful Tool to Unravel Nanoparticle Toxicity Mechanisms.” Particle and Fibre Toxicology 12: 36. doi: https://doi.org/10.1186/s12989-015-0108-2.
- ECHA. 2008. Guidance on Information Requirements and Chemical Safety Assessment. Chapter R.6: QSARs and Grouping of Chemicals. European Chemicals Agency. www.echa.europe.eu
- ECHA. 2017. Guidance on Information Requirements and Chemical Safety Assessment. Appendix R.6–1 for Nanomaterials Applicable to the Guidance on QSARs and Grouping of Chemicals. European Chemicals Agency. www.echa.europe.eu
- EU. Regulation (EC) No 1907/2006 of the European Parliament and of the Council of 18 December 2006 Concerning the Registration, Evaluation, Authorisation and Restriction of Chemicals (REACH), Establishing a European Chemicals Agency, and Amending Directive 1999/45/EC and Repealing Council Regulation (EEC) No 793/93 and Commission Regulation (EC) No 1488/94 as well as Council Directive 76/769/EEC and Commission Directives 91/155/EEC, 93/67/EEC, 93/105/EC and 2000/21/EC. Official Journal of the European Union, 2006. L 396/1.
- Fjodorova, N., M. Novic, A. Gajewicz, and B. Rasulev. 2017. “The Way to Cover Prediction for Cytotoxicity for All Existing Nano-sized Metal Oxides by Using Neural Network Method.” Nanotoxicology 11 (4): 475–483. doi:https://doi.org/10.1080/17435390.2017.1310949.
- Fourches, D., D. Q. Y. Pu, and A. Tropsha. 2011. “Exploring Quantitative Nanostructure-Activity Relationships (QNAR) Modeling as a Tool for Predicting Biological Effects of Manufactured Nanoparticles.” Combinatorial Chemistry & High Throughput Screening 14 (3): 217–225. doi:10.2174/138620711794728743.
- Gajewicz, A. 2017. “What If the Number of Nanotoxicity Data Is Too Small for Developing Predictive Nano-QSAR Models? An Alternative Read-across Based Approach for Filling Data Gaps.” Nanoscale 9 (24): 8435–8448. doi:https://doi.org/10.1039/c7nr02211e.
- Gajewicz, A., N. Schaeublin, B. Rasulev, S. Hussain, D. Leszczynska, T. Puzyn, and J. Leszczynski. 2015. “Towards Understanding Mechanisms Governing Cytotoxicity of Metal Oxides Nanoparticles: Hints from Nano-QSAR Studies.” Nanotoxicology 9 (3): 313–325. doi:https://doi.org/10.3109/17435390.2014.930195.
- Gandon, A., K. Werle, N. Neubauer, and A. Wohlleben. 2017. “Surface Reactivity Measurements as Required for Grouping and Read-across: An Advanced FRAS Protocol.” Journal of Physics, Conference Series 838:012033.
- Godwin, H., C. Nameth, D. Avery, L. L. Bergeson, D. Bernard, E. Beryt, W. Boyes, et al. 2015. “Nanomaterial Categorization for Assessing Risk Potential to Facilitate Regulatory Decision-Making.” ACS Nano 9 (4): 3409–3417. doi:https://doi.org/10.1021/acsnano.5b00941.
- Hartung, T. 2009. “Toxicology for the Twenty-First Century.” Nature 460 (7252): 208–212. doi:https://doi.org/10.1038/460208a.
- Hofmann, T., L. Ma-Hock, V. Strauss, S. Treumann, M. Rey Moreno, N. Neubauer, W. Wohlleben, et al. 2016. “Comparative Short-Term Inhalation Toxicity of Five Organic Diketopyrrolopyrrole Pigments and Two Inorganic Iron-Oxide-Based Pigments.” Inhalation Toxicology 28 (10): 463–479. doi:https://doi.org/10.1080/08958378.2016.1200698.
- Hsieh, S. F., D. Bello, D. F. Schmidt, A. K. Pal, A. Stella, J. A. Isaacs, and E. J. Rogers. 2013. “Mapping the Biological Oxidative Damage of Engineered Nanomaterials.” Small 9 (9–10): 1853–1865. doi:https://doi.org/10.1002/smll.201201995.
- Hussain, S. M., D. B. Warheit, S. P. Ng, K. K. Comfort, C. M. Grabinski, and L. K. Braydich-Stolle. 2015. “At the Crossroads of Nanotoxicology In Vitro: Past Achievements and Current Challenges.” Toxicological Sciences 147 (1): 5–16. doi:10.1093/toxsci/kfv106.
- Ivask, A., I. Kurvet, K. Kasemets, I. Blinova, V. Aruoja, S. Suppi, H. Vija, et al. 2014. “Size-Dependent Toxicity of Silver Nanoparticles to Bacteria, Yeast, Algae, Crustaceans and Mammalian Cells In Vitro.” PLoS One 9 (7): e102108. doi:10.1371/journal.pone.0102108.
- Klein, C. L., K. Wiench, M. Wiemann, L. Ma-Hock, B. van Ravenzwaay, and R. Landsiedel. 2012. “Hazard Identification of Inhaled Nanomaterials: Making Use of Short-Term Inhalation Studies.” Archives of Toxicology 86 (7): 1137–1151. doi:https://doi.org/10.1007/s00204-012-0834-2.
- Krug, H. F. 2014. “Nanosafety Research – Are We on the Right Track?” Angewandte Chemie International Ed. in English 53 (46): 12304–12319. doi:https://doi.org/10.1002/anie.201403367.
- Landsiedel, R. 2016. “Concern-Driven Integrated Approaches for the Grouping, Testing and Assessment of Nanomaterials.” Environmental Pollution 218: 1376–1380. doi:https://doi.org/10.1016/j.envpol.2015.10.060.
- Landsiedel, R., L. Ma-Hock, T. Hofmann, M. Wiemann, V. Strauss, S. Treumann, W. Wohlleben, S. Groters, K. Wiench, and B. van Ravenzwaay. 2014a. “Application of Short-Term Inhalation Studies to Assess the Inhalation Toxicity of Nanomaterials.” Particle and Fibre Toxicology 11: 16. doi:org/10.1186/1743-8977-11-16.
- Landsiedel, R., L. Ma-Hock, A. Kroll, D. Hahn, J. Schnekenburger, K. Wiench, and W. Wohlleben. 2010. “Testing Metal-Oxide Nanomaterials for Human Safety.” Advanced Materials 22 (24): 2601–2627. doi:https://doi.org/10.1002/adma.200902658.
- Landsiedel, R., U. G. Sauer, L. Ma-Hock, J. Schnekenburger, and M. Wiemann. 2014b. “Pulmonary Toxicity of Nanomaterials: A Critical Comparison of Published In Vitro Assays and In Vivo Inhalation or Instillation Studies.” Nanomedicine (London, England) 9 (16): 2557–2585. doi:https://doi.org/10.2217/nnm.14.149.
- Lever, J., M. Krzywinski, and N. Altman. 2016. “Classification Evaluation.” Nature Methods 13 (8): 603–604. doi:10.1038/nmeth.3945.
- Linden, A., and P. R. Yarnold. 2016. “Using Data Mining Techniques to Characterize Participation in Observational Studies.” Journal of Evaluation in Clinical Practice 22 (6): 835–843. doi:https://doi.org/10.1111/jep.12515.
- Ma, C. Y., F. V. Buontempo, X. Z. Wang, B. Bertrand, and J. Xavier. 2008. “Inductive Data Mining: Automatic Generation of Decision Trees from Data for QSAR Modelling and Process Historical Data Analysis.” Computer Aided Chemical Engineering 25: 581–586. doi:org/10.1016/S1570-7946(08)80102-2.
- Marvin, H. J., Y. Bouzembrak, E. M. Janssen, M. van der Zande, F. Murphy, B. Sheehan, M. Mullins, and H. Bouwmeester. 2017. “Application of Bayesian Networks for Hazard Ranking of Nanomaterials to Support Human Health Risk Assessment.” Nanotoxicology 11 (1): 123–133. doi:https://doi.org/10.1080/17435390.2016.1278481.
- Mu, Y., F. Wu, Q. Zhao, R. Ji, Y. Qie, Y. Zhou, Y. Hu, et al. 2016. “Predicting Toxic Potencies of Metal Oxide Nanoparticles by Means of Nano-QSARs.” Nanotoxicology 10 (9): 1207–1214. doi:https://doi.org/10.1080/17435390.2016.1202352.
- nanoGEM. 2012. Deliverable 1.3.1 Charakterisierungsbericht Zu Allen Materialien/Characterization Report for all NanoGEM Materials. http://www.nanogem.de/cms/nanogem/upload/Veroeffentlichungen/nanoGEM_Del1.3.1_Characterization_Materials_2013_04_24.pdf
- Oberdorster, G., E. Oberdorster, and J. Oberdorster. 2005. “Nanotoxicology: An Emerging Discipline Evolving from Studies of Ultrafine Particles.” Environmental Health Perspectives 113: 823–839. doi:10.1289/ehp.7339.
- Oesch, F., and R. Landsiedel. 2012. “Genotoxicity Investigations on Nanomaterials.” Archives of Toxicology 86 (7): 985–994. doi:https://doi.org/10.1007/s00204-012-0838-y.
- Oksel, C., C. Y. Ma, J. J. Liu, T. Wilkins, and X. Z. Wang. 2015. “(Q)SAR Modelling of Nanomaterial Toxicity: A Critical Review.” Particuology 21: 1–19. doi:10.1016/j.partic.2014.12.001.
- Oksel, C., C. Y. Ma, J. J. Liu, T. Wilkins, and X. Z. Wang. 2017. “Literature Review of (Q)SAR Modelling of Nanomaterial Toxicity.” Advances in Experimental Medicine and Biology 947: 103–142. doi:https://doi.org/10.1007/978-3-319-47754-1_5.
- Oksel, C., D. A. Winkler, C. Y. Ma, T. Wilkins, and X. Z. Wang. 2016. “Accurate and Interpretable nanoSAR Models from Genetic Programming-Based Decision Tree Construction Approaches.” Nanotoxicology 10 (7): 1001–1012. doi:https://doi.org/10.3109/17435390.2016.1161857.
- Oomen, A. G., P. M. Bos, T. F. Fernandes, K. Hund-Rinke, D. Boraschi, H. J. Byrne, K. Aschberger, et al. 2014. “Concern-Driven Integrated Approaches to Nanomaterial Testing and Assessment–Report of the Nano Safety Cluster Working Group 10.” Nanotoxicology 8 (3): 334–348. doi:10.3109/17435390.2013.802387.
- Pan, Y., T. Li, J. Cheng, D. Telesca, J. I. Zink, and J. C. Jiang. 2016. “Nano-QSAR Modeling for Predicting the Cytotoxicity of Metal Oxide Nanoparticles Using Novel Descriptors.” RSC Advances 6 (31): 25766–25775. doi:10.1039/C6RA01298A.
- Pradeep, P., R. J. Povinelli, S. White, and S. J. Merrill. 2016. “An Ensemble Model of QSAR Tools for Regulatory Risk Assessment.” Journal of Cheminformatics 8 (1):48. doi:10.1186/s13321-016-0164-0.
- Puzyn, T., A. Mostrag-Szlichtyng, A. Gajewicz, M. Skrzynski, and A. P. Worth. 2011a. “Investigating the Influence of Data Splitting on the Predictive Ability of QSAR/QSPR Models.” Structural Chemistry 22: 795–804. doi:10.1007/s11224-011-9757-4.
- Puzyn, T., B. Rasulev, A. Gajewicz, X. Hu, T. P. Dasari, A. Michalkova, H. M. Hwang, A. Toropov, D. Leszczynska, and J. Leszczynski. 2011b. “Using Nano-QSAR to Predict the Cytotoxicity of Metal Oxide Nanoparticles.” Nature Nanotechnology 6 (3): 175–178. doi:https://doi.org/10.1038/nnano.2011.10.
- Questier, F., R. Put, D. Coomans, B. Walczak, and Y. V. Heyden. 2005. “The Use of CART and Multivariate Regression Trees for Supervised and Unsupervised Feature Selection.” Chemometrics and Intelligent Laboratory 76 (1): 45–54. doi:10.1016/j.chemolab.2004.09.003.
- Rasmussen, K., J. Mast, P. Temmerman, E. Verleysen, N. Waegeneers, and F. Steen. 2014. “Multi-walled Carbon Nanotubes, NM-400, NM-401, NM-402, NM-403: Characterisation and Physico-Chemical Properties.” In NM-Series of Representative Manufactured Nanomaterials. Ispra, Italy: Joint Research Centre of the European Commission.
- Riebeling, C., M. Wiemann, J. Schnekenburger, T. A. J. Kuhlbusch, W. Wohlleben, A. Luch, and A. Haase. 2016. “A Redox Proteomics Approach to Investigate the Mode of Action of Nanomaterials.” Toxicology and Applied Pharmacology 299: 24–29. doi:10.1016/j.taap.2016.01.019.
- Roy, K., S. Kar, and P. Ambure. 2015. “On a Simple Approach for Determining Applicability Domain of QSAR Models.” Chemometrics and Intelligent Laboratory 145: 22–29. doi:10.1016/j.chemolab.2015.04.013.
- Sauer, U. G., A. Aumann, L. Ma-Hock, R. Landsiedel, and W. Wohlleben. 2015. “Influence of Dispersive Agent on Nanomaterial Agglomeration and Implications for Biological Effects In Vivo or In Vitro.” Toxicology In Vitro: An International Journal Published in Association with Bibra 29 (1): 182–186. doi:https://doi.org/10.1016/j.tiv.2014.10.011.
- Singh, C., S. Friedrichs, M. Levin, R. Birkedal, K. A. Jensen, G. Pojana, and G. Gotogno. 2011. “Zinc Oxide NM-110, NM-111, NM-112, NM-113: Characterisation and Test Item Preparation.” In NM-Series of Representative Manufactured Nanomaterials. Ispra, Italy: Joint Research Centre of the European Commission.
- Stewart, J. J. 2013. “Optimization of Parameters for Semiempirical Methods VI: More Modifications to the NDDO Approximations and Re-Optimization of Parameters.” Journal of Molecular Modeling 19 (1): 1–32. doi:https://doi.org/10.1007/s00894-012-1667-x.
- Stone, V., S. Pozzi-Mucelli, L. Tran, K. Aschberger, S. Sabella, U. Vogel, C. Poland, et al. 2014. “ ITS-NANO-prioritising Nanosafety Research to Develop a Stakeholder Driven Intelligent Testing Strategy.” Particle and Fibre Toxicology 11: 9. doi:https://doi.org/10.1186/1743-8977-11-9.
- Tantra, R., H. Bouwmeester, E. Bolea, C. Rey-Castro, C. A. David, J. M. Dogne, J. Jarman, et al. 2016. “Suitability of Analytical Methods to Measure Solubility for the Purpose of Nanoregulation.” Nanotoxicology 10 (2): 173–184. doi:https://doi.org/10.3109/17435390.2015.1038661.
- Thomas, D. G., S. Chikkagoudar, A. Heredia-Langer, M. F. Tardiff, Z. Xu, D. E. Hourcade, C. T. Pham, G. M. Lanza, K. Q. Weinberger, and N. A. Baker. 2014. “Physicochemical Signatures of Nanoparticle-Dependent Complement Activation.” Computational Science & Discovery 7 (1): 015003. doi:https://doi.org/10.1088/1749-4699/7/1/015003.
- Toropova, A. P., A. A. Toropov, E. Benfenati, R. Korenstein, D. Leszczynska, and J. Leszczynski. 2015. “Optimal Nano-descriptors as Translators of Eclectic Data into Prediction of the Cell Membrane Damage by Means of Nano Metal-oxides.” Environmental Science and Pollution Research International 22 (1): 745–757. doi:https://doi.org/10.1007/s11356-014-3566-4.
- Wang, X. Z., F. V. Buontempo, A. Young, and D. Osborn. 2006. “Induction of Decision Trees Using Genetic Programming for Modelling Ecotoxicity Data: Adaptive Discretization of Real-Valued Endpoints.” SAR and QSAR in Environmental Research 17 (5): 451–471. doi:https://doi.org/10.1080/10629360600933723.
- Wiemann, M., A. Vennemann, U. G. Sauer, K. Wiench, L. Ma-Hock, and R. Landsiedel. 2016. “An In Vitro Alveolar Macrophage Assay for Predicting the Short-Term Inhalation Toxicity of Nanomaterials.” Journal of Nanobiotechnology 14 (1): 16. doi:10.1186/s12951-016-0164-2.
- Wohlleben, W.,. M. D. Driessen, S. Raesch, U. F. Schaefer, C. Schulze, B. von Vacano, A. Vennemann, et al. 2016. “Influence of Agglomeration and Specific Lung Lining Lipid/Protein Interaction on Short-Term Inhalation Toxicity.” Nanotoxicology 10 (7): 970–980. doi:10.3109/17435390.2016.1155671.