
Abstract
An increasing use of cobalt (Co)-based nanoparticles (NPs) in different applications and exposures at occupational settings triggers the need for toxicity assessment. Improved understanding regarding the physiochemical characteristics of Co metal NPs and different oxides in combination with assessment of toxicity and mechanisms may facilitate decisions for grouping during risk assessment. The aim of this study was to gain mechanistic insights in the correlation between NP reactivity and toxicity of three different Co-based NPs (Co, CoO, and Co3O4) by using various tools for characterization, traditional toxicity assays, as well as six reporter cell lines (ToxTracker) for rapid detection of signaling pathways of relevance for carcinogenicity. The results showed cellular uptake of all NPs in lung cells and induction of DNA strand breaks and oxidative damage (comet assay) by Co and CoO NPs. In-depth studies on the ROS generation showed high reactivity of Co, lower for CoO, and no reactivity of Co3O4 NPs. The reactivity depended on the corrosion and transformation/dissolution properties of the particles and the media highlighting the role of the surface oxide and metal speciation as also confirmed by in silico modeling. By using ToxTracker, Co NPs were shown to be highly cytotoxic and induced reporters related to oxidative stress (Nrf2 signaling) and DNA strand breaks. Similar effects were observed for CoO NPs but at higher concentrations, whereas the Co3O4 NPs were inactive at all concentrations tested. In conclusion, our study suggests that Co and CoO NPs, but not Co3O4, may be grouped together for risk assessment.
Introduction
Cobalt-based materials (e.g. Co metal, salts, hard metals, oxides, and alloys) are used widely in various industrial and medical applications. Cobalt metal is, for example, an alloy element of high-strength steels and metal carbides (e.g. tungsten carbide). During recent years, the production and use of various nanoparticles (NPs) have increased in society. Cobalt-based NPs are now used as pigments, catalysts, sensors, magnetic contrast agents, and in energy storage devices (Lison Citation2015). Dispersion may occur via wear processes from cobalt-chromium (CoCr) alloy containing metal-on-metal implants (Gill et al. Citation2012). One of the main health concerns related to cobalt exposure is the risk of developing cancer. Chronic inhalation exposure to cobalt metal (micron-sized) and cobalt sulfate salts has been shown to cause lung cancer in rats and mice (NTP Citation2016). Carcinogenic effects of cobalt NPs are less studied, but one in vivo study exposing a small number of rats to Co NPs via intramuscularly implantation showed malignant mesenchymal tumors in five out of six animals (Hansen et al. Citation2006). Furthermore, a study on transgenic mice clearly showed higher mutant frequency in lung tissue, as compared to controls (Wan et al. Citation2017). In contrast, a recent cohort study on Finnish male cobalt production workers did not observe any increased cancer risk (Sauni et al. Citation2017). These and other in vivo studies are highly valuable for assessing risks related to cobalt-based particles. However, in vitro assays are needed for rapid screening of toxicity and elucidation of underlying mechanisms.
Cobalt-based NPs including metallic NPs (Co) as well as oxides (CoO, Co3O4) have been studied previously with focus on genotoxicity and cell transformation using different in vitro models. Co NPs have, for example, been shown to cause DNA damage in fibroblasts (Ponti et al. Citation2009), human peripheral leukocytes (Colognato et al. Citation2008), and human lung cells (A549) (Wan et al. Citation2012). Furthermore, the ability of Co NPs to transform fibroblasts to a carcinogenic phenotype has been shown (Annangi et al. Citation2015; Ponti et al. Citation2009). One study highlighted the role of oxidatively damaged DNA since cells deficient in repair of such damage (8-oxo-dGuanine DNA glycosylase 1, Ogg1−/−) were considerably more sensitive (Annangi et al. Citation2015). CoO has shown cytotoxicity and to cause oxidative stress-related damage or inflammatory responses in cultured cells (Chattopadhyay et al. Citation2015; Sisler et al. Citation2016). Furthermore, a slight increase in DNA damage was observed for Co3O4 NPs in lung cells (A549 and BEAS-2B) in the absence of inflammatory effects (Cavallo et al. Citation2015), and a recent study reported Co3O4 NPs to be non-cytotoxic in BEAS-2B cells whereas an induction of micronuclei formation and DNA strand breaks were observed (Uboldi et al. Citation2015). All these studies indicate a possible toxicological hazard from these NPs, but their relative toxicity is difficult to assess since no comparative study has investigated all these materials at the same conditions.
In the current study, we thoroughly characterized Co, CoO, and Co3O4 NPs in order to relate their toxicity to their physicochemical characteristics, with a focus on DNA damage and oxidative stress. In addition to traditional toxicity assays, the different NPs were tested in six different green fluorescent protein(GFP)-based reporter cell lines called ToxTracker (Hendriks et al. Citation2016) to gain mechanistic insight. ToxTracker monitors the activation of various cellular stress responses that are relevant for carcinogenicity, including DNA damage, oxidative stress, and protein damage. These reporter cells are based on mouse embryonic stem (mES) cells which, in contrast to cancer-derived cell lines, are genetically stable, proficient in all cellular DNA repair pathways, and have a high rate of cell proliferation making them sensitive to DNA damage (Giachino et al. Citation2013). In addition, stem cells are considered to be the cells of origin for most cancers and therefore highly relevant for genotoxicity studies. Two of the reporter cell lines ‘report’ on DNA damage related to signaling pathways for replication stress (Bscl2 reporter) or DNA double strand breaks (Rtkn reporter). These reporters are e.g. activated by genotoxic substances such as cisplatin and doxorubicin (Hendriks et al. Citation2016). Two other cell lines show oxidative stress related to antioxidant signaling (Srxn1 and Blvrb reporters). Finally, two other cell lines indicate general p53-dependent cellular stress (Btg2 reporter) or protein unfolding (Ddit3 reporter). We previously showed the applicability of these reporters for NPs (Karlsson et al. Citation2014; Åkerlund et al. Citation2018).
The aim of this study was to gain mechanistic insights in the correlation between NP reactivity (Co release, corrosion, ROS generation) and toxicity of Co-based NPs (Co, CoO, and Co3O4) in order to facilitate decisions for grouping.
Materials and methods
Cell culture and reagents
2′,7′-Dichlorofluorescin-diacetate (H2DCF-DA) was purchased from Sigma-Aldrich (Sweden) and dulbecco-modified essential medium (DMEM, Lot# 1720776), PBS, fetal bovine serum (FBS, Gibco®, Lot# 07F2235K), sodium pyruvate, penicillin/streptomycin antibiotics mixture (Gibco®) from Life Technologies (Sweden). Ultrapure water (18.2 MΩ cm; Millipore, Sweden) was used for rinsing or as solvent for solutions. All equipment for metal release measurements was acid-cleaned in 10% HNO3 for at least 24 h and rinsed four times with ultrapure water. All chemicals were of analytical grade (p.a.). HNO3 (65% puriss. p.a. grade) was used to acidify the solution samples prior to atomic absorption spectroscopy (AAS). The graphite powder was obtained from Alfa Aesar (99.9995% metal basis).
A549 type II epithelial cell lines (American Type Culture Collection, ATCC) were grown at 37 °C in a humidified atmosphere with 5% CO2 in DMEM supplemented with 10% (v/v) FBS, 1% (v/v) sodium pyruvate, and 1% (v/v) penicillin/streptomycin mixture, hereafter denoted ‘complete DMEM’. The HBEC cells (HBEC3-kt) were cultured as described previously (Åkerlund et al. Citation2018). In short, cells were cultured in flasks pre-coated with 0.01% collagen at serum free conditions (mix of 50% RPMI and 50% LHC-9) supplemented with 1% PEST. Culture of the ToxTracker mES cells was performed as described previously (Hendriks et al. Citation2012). The mES cells were maintained in the presence of irradiated mouse embryonic fibroblasts as feeder cells in Knockout DMEM containing 10% FBS, 2 mM GlutaMAX, 1 mM sodium pyruvate, 100 μM β-mercaptoethanol, and leukemia inhibitory factor (LIF). Cells were seeded 24 h prior to exposure on gelatin-coated plates using buffalo rat liver cell (BRL)-conditioned mES cell medium in the absence of feeder cells.
Nanoparticles
The Co NPs (metal purity of 99.8%) were supplied by American Elements, Los Angeles, CA. For comparison, a cobalt(II) oxide (CoO – metal purity of 99.99%) and a cobalt(II, III) oxide (Co3O4 – metal purity of 99.5%) were purchased from Sigma-Aldrich, Sweden. Unless specified differently, 1 mg/mL of NP suspensions in the appropriate solvent were sonicated for 20 min in a water bath (‘Bransonic ultrasonic cleaner’, Model B-2200 E1, HF output power 60 W, working frequency 47 kHz ±6%).
TEM
Transmission electron microscopy (TEM) investigations of NP morphologies were performed using a Hitachi HT7700 microscope, operating at 100 kV. NPs samples were prepared by dispersing the particles in butyl alcohol at a concentration of 1 g/L followed by sonication (Branson Sonifier 250, 30% duty cycle, output 4, 3 min). The suspensions were then pipetted onto TEM copper grids coated with holey carbon films (Ted Pella), from which the solvent evaporated at ambient laboratory conditions (25 °C). TEM images were recorded in bright field mode. Size measurements were carried out using the ImageJ software (https://imagej.net) and data are presented as the mean ± standard deviation for NP size and median for NP aggregate size. Analysis of cellular uptake was performed after 2 and 24 h of treatment with 40 µg/mL of Co, CoO, and Co3O4 NPs. After exposure, cells were harvested and fixed in freshly prepared 2.5% glutaraldehyde in 0.1 M phosphate buffer (PB). The pellets were then post fixed in 2% osmium tetroxide in 0.1 M PB, pH 7.4 at 4 °C for 2 h, dehydrated in ethanol followed by acetone, and embedded in LX-112 (Ladd, Burlington, VT). Ultrathin sections (60–80 nm) were cut by a Leica ultracut UCT (Leica, Wien, Austria) and contrasted with uranylacetate followed by lead citrate and examined with in Tecnai 12 Spirit Bio TWIN TEM (Fei company, Eindhoven, The Netherlands) at 100 kV. Digital images were captured by using a Veleta camera (Olympus Soft Imaging Solutions, GmbH, Münster, Germany).
Brunauer–Emmet–Teller (BET) method
The surface area to weight ratio (specific surface area) of each NP was measured considering the adsorbed amount of nitrogen at cryogenic conditions, according to the Brunauer–Emmet–Teller method (Micromeritics GEMINI V). The measurements were performed at five different partial pressures and at five different local positions for each powder (standard BET method).
Zeta potential
The zeta potentials of the NPs were measured using a Malvern Zetasizer nano Z instrument. The NPs were first sonicated (Branson Sonifier 250, 30% duty cycle, output 4) for 3 min in 10 mM NaCl (pH 6.6) in Malvern zetasizer Nanoseries cuvettes. The Smoluchowski approximation was used to calculate the zeta potential from the electrophoretic mobility. The zeta potential was measured in triplicate for two different samples of each NP.
Photon cross correlation spectroscopy (PCCS)
Stability of the NPs in solution was studied by means of photon-cross-correlation-spectroscopy (PCCS; Nanophox, Sympatec GmbH), at room temperature (RT), in cuvettes (Eppendorf AG, Germany, UVette Routine pack, LOT no. C153896Q). The NPs were suspended before analysis in complete DMEM, in serum-free HBEC medium (mix of 50% RPMI and 50% LHC-9), and in 10 mM NaCl, in which they were sonicated for 3 min (Branson Sonifier 250, 30% duty cycle, output 4). The PCCS analysis at room temperature and a particle concentration of 0.1 g/L was set to measure every 5 min for 24 h. The intensity size distribution is presented in cases with acceptable correlation functions. The non-negative least squares (NNLS) analysis algorithm was used to obtain intensity size distributions.
Electrochemical and surface characterization
One milligram of the Co NPs mixed with 100 mg graphite powder was used as a working electrode connected to an Ag/AgCl (saturated KCl) reference electrode (Radiometer, Sweden) and a platinum wire as counter electrode. A 8 M NaOH (pH 13.6) was used as electrolyte in a volume of approximately 3 mL. Set-up details are given elsewhere (Morsdorf et al. Citation2015). In brief, open circuit potential (OCP) measurements were performed in complete DMEM at pH 7.4 ± 0.1 for 48 h. Cyclic voltammetry (CV) measurements started from OCP (after 5 min stabilization), following a reduction at a rate of 0.0005 V/s to the lower water stability line (H2 evolution peak) and an oxidation to the higher water stability line (O2 evolution peak), or vice versa.
A Horiba Yvon Jobin HR800 spectrometer was employed for Raman investigations. To minimize beam-induced damage, a 785 nm laser was used together with a 100× microscope, with an approximate beam spot size of 10 µm. The accumulation time for each spectrum was 30 s. Three spots were investigated for each sample.
The outermost (approx. 5 nm) surface of the NPs, X‐ray photoelectron spectroscopy (XPS) was investigated using a Kratos AXIS UltraDLD X‐ray photoelectron spectrometer (Kratos Analytical, Manchester, UK) driven by a monochromatic 150 W Al X‐ray source (analyzed areas approximately sized 700 × 300 μm). Wide spectra and detailed spectra (pass energy 20 eV) of the main compositional elements of each powder (C 1s, O 1s, and Co 2p) were acquired. The NPs were mounted on copper tape to fix them against diffusion in the applied vacuum inside the ultra-high vacuum instrumental chamber. All binding energies were corrected to the carbon C 1s contamination peak at 285.0 eV.
The X-ray diffraction (XRD) investigations were conducted using a Siemens D5000 diffractometer (30 mA, 40 kV) using monochromatic Cu Kα (1.54178 Å) radiation. Diffractograms were collected between 10° and 90° (2θ).
Metal release
Triplicate samples and one blank sample without added particles were incubated (5 mg NPs in 50 mL complete DMEM) at dark conditions at 37 °C for 10 min, 4 h, and 24 h, in a Stuart S180 incubator at bilinear shaking conditions (12°, 25 cycles/min). Directly after incubation, approximately 30 mL of the sample was ultra-centrifuged for 1 h to separate the NPs and the dissolved fractions of Co (relative centrifugal force 52 900g, Beckman Optima L-90K, SW-28 rotor). By this, all NPs larger than approximately >20 nm are expected to be removed from solution as described in (Tsao et al. Citation2011). A centrifugation time of 1 h leads to a longer exposure time than the nominal, as some of the NPs will be present in the centrifuged solution and hence release Co to some extent also during this treatment. The samples were then acidified to pH <2 using 65% HNO3. The concentration of Co in the particle-free solutions was determined using a Perkin Elmer Analyst 800 atomic absorption spectrometer (AAS) in flame, or graphite furnace, mode. In addition, analysis of Co was performed in samples directly obtained from several assays (see below) using the same sonication and preparation procedures as for the assays.
The calibration curves and their linearity, recoveries, limits of detection, identification, and quantification were performed according to the method described in Vogelgesang and Hädrich (Citation1998), see Table S2. Reported release values are means of triplicate samples with the blank solution concentration, if >0, subtracted. Release data are presented both as the measured metal release normalized to the Co content in the particles, as % dissolution:
where x = 1 (Co NPs), 0.7865 (CoO NPs), or 0.734 (Co3O4 NPs); and normalized to the BET surface area in µg/cm2:
Cell viability lung cells (Alamar Blue assay)
A549 and HBEC cells were seeded in transparent 96 well plates (5000 cells/well) 24 h before exposure to Co, CoO, and Co3O4 NPs (5, 10, 15, 20, 40, 60, 80, 100 µg/mL) in complete DMEM or HBEC cell medium for 24 and 48 h. The nominal dose was verified by control measurements by means of AAS. After exposure, the supernatant was removed and AlamarBlue® reagent (Invitrogen, Carlsbad, CA) was added as previously described (Di Bucchianico et al. Citation2017). Potential interferences of the NPs with the assay were tested in an acellular system by incubating the different doses of NPs with the AlamarBlue® reagent for 2 h at 37 °C in 96 well plates.
Genotoxicity lung cells (comet assay)
A549 and HBEC cells were seeded in 24 well plates (30 000 cells/well) 24 h before exposure to 20 and 40 µg/mL Co NPs or 40 and 60 µg/mL CoO and Co3O4 NPs for 3 and 24 h in complete DMEM or HBEC cell medium. The doses were selected based on the cytotoxicity results. Comet assay was then performed as previously described (Gliga et al. Citation2014). For evaluation of oxidatively damaged DNA, Fpg (formamidopyrimidine glycosylase) was added to the gels to detect 8-oxoguanine and other oxidized purines using the mini-gel version as previously described (Di Bucchianico et al. Citation2017). Treatment with 50 µM H2O2 for 5 min at 4 °C was used as positive control. After electrophoresis (30 min at 29 V), the slides were neutralized, dried, and stained with 1:10 000 dilution of Sybr Green in TAE buffer for 15 min and thereafter scored using a fluorescence microscope (LeicaDMLB, Houston, TX) with Comet assay IV software (Perceptive Instruments, Suffolk, UK). At least 50 cells were scored per sample and the results were expressed as mean percent DNA in tail.
ROS detection
Intracellular ROS levels were measured using the dichloro-dihydro-fluorescein diacetate (DCFH-DA) assay. A549 cells were seeded in black 96 well plates with transparent bottom (30 000 cells/well) and incubated for 24 h. A 1 mg/mL solutions of the NPs were prepared in ultrapure water. Dilutions were made in DMEM (without phenol red) or DMEM (without phenol red) + 10% FBS or PBS. Cell were incubated for 2 h with suspensions of Co, CoO, and Co3O4 NPs (10, 50, 100 μg/mL). After exposure, the cells were washed with PBS and loaded with 40 μM DCFH-DA in the same medium as used for exposure. Rapidly after the DCFH-DA loading, fluorescence was recorded every 5 min over 60 min (excitation 485 nm, emission 535 nm) at RT using a plate reader (Perkin Elmer victor 1420 Multilabel Counter). Tertbutyl hydroperoxide (TBP, 500 μM) was used as positive control. ROS increase was normalized to the unexposed control and calculated as fold increase. Results are presented as mean ± standard deviation of four independent experiments.
Production of ROS induced by the NPs and their released Co fraction was also determined in an acellular system. Dispersions of Co, CoO, and Co3O4 NPs (1 mg/mL) in ultrapure water were sonicated for 20 min in a sonication bath. In order to obtain the released fraction, dilutions of 50 or 100 µg/mL in PBS or DMEM (without phenol red) or DMEM (without phenol red) + 10%FBS were incubated for 2 h at 37 °C (mixing briefly every 30 min) followed by centrifugation for 30 min at 13 000 rpm and collection of the supernatant. A 40 µL of DCFH-DA (5 mM in DMSO) was added to 1.6 mL 0.01 M NaOH at dark conditions (RT) for cleavage of the acetate group. After 30 min, the reaction was neutralized by adding 8 mL of PBS. A 25 µL of the NP suspensions (final concentrations of 10, 50, 100 µg/mL) and 25 µL of the released fractions, both in PBS or DMEM ±10% FBS (without phenol red), were mixed with 75 µL of H2DCF solution in a black 96 well plates with transparent bottoms. The fluorescence was recorded every 5 min over 60 min (excitation 485 nm, emission 535 nm) at RT using a plate reader (Perkin Elmer victor 1420 Multilabel Counter). ROS increase was normalized to the unexposed control and calculated as fold increase. Results are presented as mean ± standard deviation of four independent experiments.
Chemical equilibrium speciation
The JESS version 8.3 (May 2015) and Visual MINTEQ 3.0 software (J. Gustafsson, KTH, Stockholm, Sweden) were used for chemical equilibrium speciation calculations of Co in DMEM and PBS. The temperature was set to 37 °C, and the redox potential to 305 mV in DMEM (305 ± 15 mV) based on measurements using an Inlab redox electrode (Mettler Toledo, Sweden). The set of DMEM components used in the JESS calculations is given in Table S3. A few components were not available in the database for the JESS calculations (choline, pantothenate, niacinamide, and inositol).
ToxTracker assay (mES cells)
The ToxTracker assay is a mouse embryonic stem (mES) cell based genotoxicity assay employing six green fluorescent protein reporters, specific for DNA damage, oxidative stress, protein damage, and cellular stress response. mES cells were seeded (40 000 cells/well) 24 h prior to treatment on gelatin-coated 96 well-plates using buffalo rat liver cell (BRL) conditioned mES cell medium in the absence of feeder cells. A screening of NP toxicity was performed treating cells for 24 h with increasing concentrations of NPs (0–100 µg/mL).
For GFP reporter analysis, the mES cells were exposed for 24 h at five increasing concentrations of the NPs in twofold dilution steps, up to a maximal one corresponding at 50–75% of cytotoxicity. In case of no observed cytotoxicity, a maximum concentration of 100 μg/mL was investigated. Induction of the GFP reporters was determined after 24 h exposure using a Guava easyCyte 8HT flow cytometer (Millipore). Only GFP expression in intact single cells was determined. Mean GFP fluorescence was measured and used to calculate GFP reporter induction compared to a vehicle control treatment. Cytotoxicity was estimated by cell count after 24 h exposure using a flow cytometer and was expressed as percentage of intact cells after 24 h exposure compared to vehicle exposed controls.
Statistical analysis and BMD determination
Data were analyzed in GraphPad Prism (version 5.02, La Jolla, CA) by one-way ANOVA followed by Dunnett’s multiple comparison or T-test. p Values lower than 0.05 were considered statistically significant (*p ≤ 0.05, **p ≤ 0.01, ***p ≤ 0.001). The error bars represent standard errors of the mean. The BMD method predefines a specific effect, referred to as the Benchmark Response (BMR) and estimates the dose (BMD) associated with the specified effect. The BMD is estimated from the complete dose response dataset by fitting dose response models. Statistical uncertainties in the data are taken into account in the confidence interval around the BMD, the lower limit of which (denoted as BMDL) is the Point of Departure for deriving exposure limits. Here, BMD20 and the BMD50 were analyzed using R software with PROAST 64.20 package (RIVM, Bilthoven, The Netherlands).
Results
All NPs agglomerate in cell medium
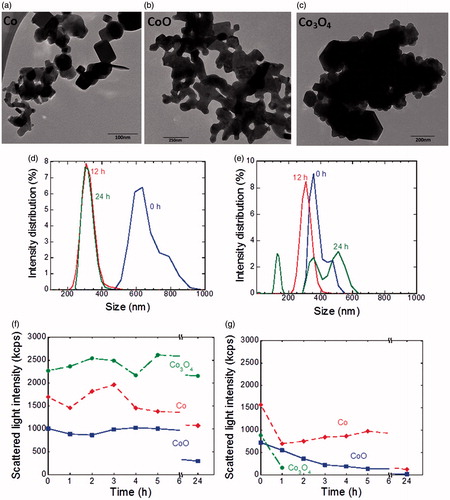
TEM analysis showed a heterogeneous population of the Co NPs of different dimension and shapes varying from spheres to parallelepipeds (). The average pristine size was 25 ± 8.8 nm whereas the aggregates had a median size of 277 nm. The CoO NPs were mainly spherical in shape and fused into large agglomerates with a pristine dimension of 43 ± 9 nm and a median agglomerate size of 2.5 µm (). The Co3O4 NPs had a pristine size of 51 ± 11 nm but appeared to be tightly aggregated in clusters with a median size of 1.5 µm (). Co and Co3O4 NPs were agglomerated in complete DMEM with main peaks around 200–600 nm (). The CoO NPs agglomerated to such an extent that it was not possible to obtain reliable size distribution data, also evident by the low scattered light intensity (). When immersed in a low ionic strength saline solution (10 mM NaCl, pH 6.6), in which it was possible to measure the zeta potential (Skoglund et al. Citation2017), all NPs sedimented rapidly (). Their stability and negative zeta potential decreased in the order; Co > CoO > Co3O4. The NPs agglomerated also in the serum-free HBEC medium (mix of RPMI and LHC-9) and similar trends were observed as for the complete DMEM (see Supplementary Figure S2).
Figure 1. Size characterization of the NPs. TEM images of NPs of Co (a), CoO (b), and Co3O4 (c). Intensity–density size distribution of NPs of Co (d) and Co3O4 (e) in complete DMEM after 0, 12, and 24 h. No reliable data were obtained for CoO NPs due to agglomeration. Scattered light intensity by means of PCCS of NPs of Co, Co3O4, and CoO in complete DMEM (f) and 10 mM NaCl (g) during 24 h. A decreasing intensity indicates particle sedimentation.
Co NPs have a surface of CoO and corrode in cell medium
In order to obtain information of the surface composition of the NPs, and of the corrosion activity of the Co NPs, cyclic voltammetry and OCP measurements were performed combined with XPS, Raman, and XRD measurements (detailed results in Supplementary Information, Figure S1). The results of the multi-analytical investigation were consistent and summarized in . CoO (divalent cobalt oxide) was the main surface oxide component of the Co NPs and the surface composition of CoO NPs was CoO while that of Co3O4 NPs was Co3O4 (). The BET surface area of Co NPs was approximately six times larger (10.7 m2/g) than of CoO and Co3O4 NPs (1.9 and 1.7 m2/g).
Figure 2. Summary of surface oxides, surface area, and corrosion. Details on XRD, Raman, CV, and XPS techniques and results are given in Supplementary Information. The open circuit potential (OCP) of Co NPs show results from two replicates in complete DMEM (pH 7.4) during 48 h.
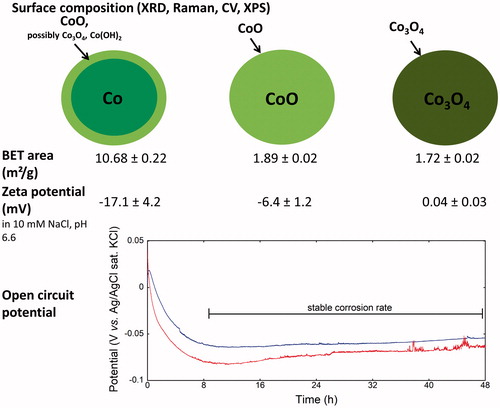
The OCP analysis (providing information on surface passivity and corrosion) was performed in complete DMEM for the Co NPs, since corrosion (metal oxidation) does not occur for the oxide particles. An initially reduced potential during the first 8 h followed by a relatively stable OCP with time indicates active corrosion up to 8 h during with reduced barrier properties of the surface oxide followed by its stabilization and relatively constant corrosion rates up to 48 h ().
Sonication strongly increases the extent of released Co from NPs of Co and CoO
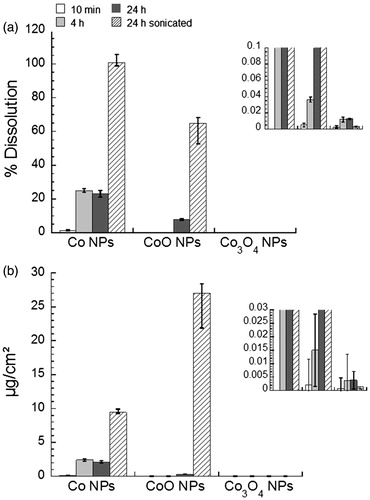
Non-sonicated particle suspensions were prepared in complete DMEM and the released amounts of Co were determined after 10 min, 4 h, and 24 h. 25% of the added mass of Co NPs was released after 4 h with only a few percent of the mass released during the first 10 min of exposure. Only minor amounts of Co were released during the subsequent exposure period up to 24 h. In view of the results of the OCP measurements, this kinetic behavior suggests a combination of chemical dissolution of the surface oxide and of corrosion during the first 8 h. The non-sonicated CoO NPs showed a delayed release of Co, probably due to relatively slow chemical dissolution processes and/or slow diffusion processes due to extensive particle agglomeration. After 24 h, approximately 8% of the total Co content was released into complete DMEM. The Co3O4 NPs did not show any significant extent of Co release (). Similar pattern of Co release/dissolution was observed when expressing the released amount of Co (in mg) per particle BET surface area (cm2) (). In the case of sonicated particle suspensions in complete DMEM, the release of Co was strongly accelerated (101 ± 2% of the particle mass of Co) for the Co NPs after 24 h (comparable time as the cell viability assay tests) and for the CoO NPs (65 ± 12%), but not for the Co3O4 NPs (0.003 ± 0.001%). Thus, initial sonication led to complete Co release/dissolution of the Co NPs after 24 h in cell medium with serum.
Figure 3. Co release in cell medium. (a) Released amounts, expressed % of Co released per Co content in NPs of Co, CoO, and Co3O4, into complete DMEM after 10 min, 4 h, and 24 h (non-sonicated) as well as after 24 h with initial sonication of the stock suspension (similar treatment as in the assays), (b) corresponding released amounts (µg/cm2) expressed as µg Co per cm2 particle surface area (BET specific surface area, ). The insets show magnified graphs.
Co, CoO, and Co3O4 NPs are efficiently taken up by A549 cells
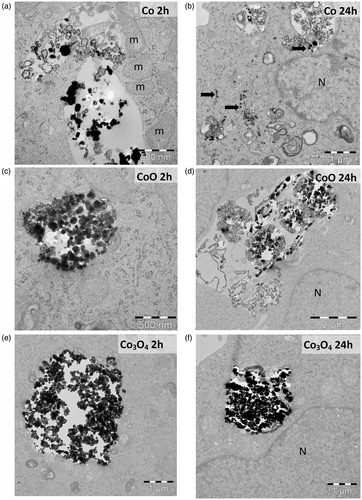
TEM imaging was used to investigate cellular uptake and intracellular localization in A549 cells. The analysis showed an efficient cell uptake of all NPs already after 2 h of exposure (). The Co NPs, smallest of the three NPs, resided mainly in small endocytic vesicles whereas the CoO and Co3O4 NPs mainly were observed in large endocytic vesicles (). After 24 h exposure, Co NPs were observed both inside endosomes and free in the cytoplasm (arrows) where they appeared to align along the endoplasmic reticulum. The Co NPs were freely spread in the cell and present next to mitochondria, but no NPs were observed inside the mitochondria or in the nucleus (). CoO and Co3O4 NPs were also after 24 h exposure mainly confined in large endocytic vesicles ().
Figure 4. TEM images of A549 uptake of NPs of Co (a, b), CoO (c, d), and Co3O4 (e, f) after 2 and 24 h. ‘N’ indicates nucleus, ‘m’ mitochondria, and free NPs are indicated by arrows.
Co NPs are cytotoxic in lung cells
A549 and HBEC cells were exposed to the three NPs for 24 and 48 h and cell viability was determined as mitochondrial activity using the Alamar Blue assay. Only the Co NPs were cytotoxic to the lung cells after 24 h (). The BMD50 (the dose causing 50% of reduction in viability) in the A549 cells was around 93 and 46 µg/mL for 24 and 48 h, respectively (details in Supplementary Information, Figure S3).
Figure 5. Effects of Co, CoO, and Co3O4 on cell viability and DNA damage in lung cells. Cell viability of A549 cells (a) and HBEC cells (b) after 24 h exposure assessed using Alamar Blue assay. Results are expressed as % of control. Co NPs significantly decreased viability from 40 µg/mL for both A549 and HBEC (***, p < 0.001). DNA damage in A549 (c) and HBEC (d) after 3 or 24 h assessed using comet assay. Significant results as compared to the control are marked with asterisks (*for p value ≤0.05, **for p value <0.01, ***for p value <0.001).
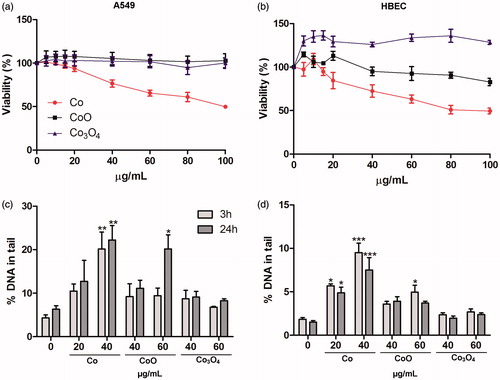
Co and CoO NPs cause DNA damage in lung cells
The potential of the NPs to induce DNA damage was investigated with the alkaline comet assay, which measures DNA strand breaks and alkali labile sites, after 3 and 24 h following exposure of A549 and HBEC cells. A statistically significant increase in DNA damage was observed in both cell lines following exposure to Co NPs after both 3 and 24 h. An increase in damage was also observed for CoO at a higher dose (60 µg/mL), whereas Co3O4 NPs showed no DNA damage at any of the tested concentrations or time points ().
Co and CoO NPs cause DNA damage related to oxidative stress
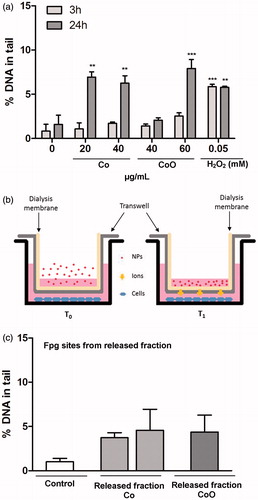
In addition to the alkaline version of the comet assay, the Fpg (formamidopyrimidine glycosylase) version of the assay was used in A549 cells in order to more specifically analyze DNA damage related to oxidative stress (such as 8-oxodG). The results showed that oxidative stress related DNA damage (Fpg sensitive sites) was observed for the Co and CoO NPs, but only after 24 h (). In contrast, Co3O4 NPs showed no increase in Fpg sites (data not shown). In order to elucidate the possible role of extracellularly released ionic species, we also tested the effect of the released fraction of Co from the different NPs. The NPs were incubated in cell medium for 24 h after which the NPs and the released fraction were separated from each other using centrifugation and the cells were thereafter exposed to this fraction. The amounts of released Co ionic species were higher for the Co NPs (approx. 80% of added mass of Co) when compared to the CoO NPs (approx. 20%). No DNA strand breaks or oxidative DNA damage were observed from this separated released fraction (data not shown). When the cells were exposed to freshly released ionic species by adding the NPs onto a transwell membrane (0.4 µm pore) covered by a dialysis membrane (MWCO = 13 kDa), schematically illustrated in slight increase in Fpg sensitive sites were observed for released Co from both Co and CoO NPs ().
Figure 6. DNA damage related to oxidative stress induced by NPs of Co and CoO as well as their released fractions in A549 cells. The oxidative DNA damage is expressed as Fpg sites (% DNA in tail). An increase in Fpg sites was observed for Co and CoO nanoparticles after 24 h exposure (a). In (b), a schematic representation of an experiment performed using the ‘freshly released fraction’ is shown. Here, NPs were applied on a transwell and dialysis membrane and the cells were cultured in the lower chamber. This system allows for released ionic species but not NPs to reach the cells. Fpg sensitive sites caused by freshly released Co species are shown in (c). Significant results as compared to the control (0 µg/mL) are marked with asterisks (*for p value ≤0.05, **for p value <0.01, ***for p value <0.001).
Co NPs cause high ROS production
The DNA damage and induction of Fpg sensitive sites suggest ROS production of Co and CoO NPs induced both by the particles and by released Co species. In order to thoroughly study the ROS generating capacity of the different NPs, the released fraction, as well as the role of the composition of the biological media, acellular and cellular experiments were performed using the ROS sensitive DCFH-DA probe. The acellular experiments clearly showed high ROS production by the Co NPs tested at concentrations up to 100 µg/mL, in particular when the tests were performed in cell medium (DMEM) without serum. Substantially lower activity was observed in serum-containing DMEM and in PBS (). Only minor amounts of ROS were generated by the CoO NPs in DMEM, whereas production was observed in either DMEM with serum or in PBS. The Co3O4 NPs were inactive in all media tested. Parallel tests were performed on the ROS generating capacity of the released fraction of Co (separated from the NPs after incubation of the NPs for 2 h in the different media followed by centrifugation). This fraction was active in all media tested in the case of the Co NPs, whereas for CoO NPs, only the released fraction in DMEM was active (). Interestingly, this was the case even though the amount of released Co was substantially higher from the CoO NPs when exposed in PBS (approx. 10%) compared with DMEM without (1.2%) and with (0.8%) serum (). This suggests a different chemical speciation of released Co (Note the scale differences in . The ROS generation in DMEM is similar for the CoO NPs and the released fraction from CoO, approx. 3.5 times increase in 100 µg/mL). Finally, the intracellular ROS production was measured following 2 h exposure to the different NPs. The same trends, although at somewhat lower levels, were observed as in the acellular experiments. Again, Co NPs were highly potent particularly in DMEM without serum and a slight increased potency was also observed for CoO NPs whereas Co3O4 NPs were inactive. No intracellular ROS was observed for any of the NPs in PBS.
Figure 7. ROS formation. (a) ROS induced by Co CoO and Co3O4 NPs after 2 h of incubation at 37 °C in cell-free conditions in three different biological media; DMEM, DMEM +10%FBS (DMEM + FBS), and PBS. (b) ROS induced by the released fraction in the three different media prepared by centrifugation after 2 h of incubation. (c) ROS formation induced by the three NPs in A549 cell line.
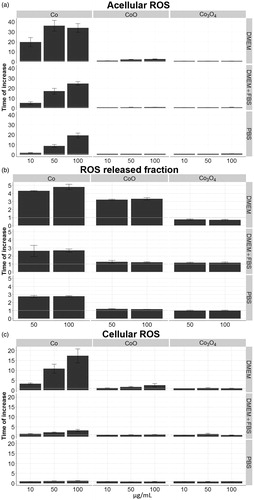
Table 1. Co released from NPs of Co and CoO in different media.
Chemical speciation modeling predicts complexation between released Co and different ligands of the cell media and a large extent of Co precipitation in PBS
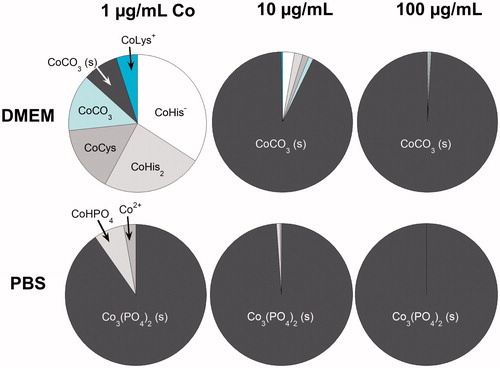
The ROS experiments suggested different chemical speciation. To analyze this, we used an in silico approach by using JESS and Visual MINTEQ for chemical speciation modeling of different concentrations of released Co in DMEM (see input composition in Table S3) and in PBS. The results are summarized in . It is evident that released Co forms complexes with different types of amino acids in DMEM, in particular at low concentrations (<1 µg/mL). At higher concentrations (>1 µg/mL), the formation of solid Co carbonate dominates the speciation. Interactions between released Co and PBS result in the formation of solid Co phosphate. Essentially no free Co ions are hence expected to exist in DMEM. Minor amounts of free Co ions were predicted in PBS at the low Co concentration (1 µg/mL). These predictions are equilibrium estimates and the time to reach these conditions is unknown.
Figure 8. Predicted chemical equilibrium speciation of Co in DMEM (JESS-model) and PBS (Visual MINTEQ-model). The dominating species (3–6) are visualized for three different concentrations of Co. The dark gray areas show solid (s) species. His: histidine; Cys: cysteine; Lys: lysine.
Reporter cells reveal signaling pathways related to oxidative stress and DNA damage for Co and CoO NPs whereas NPs of Co3O4 are inactive
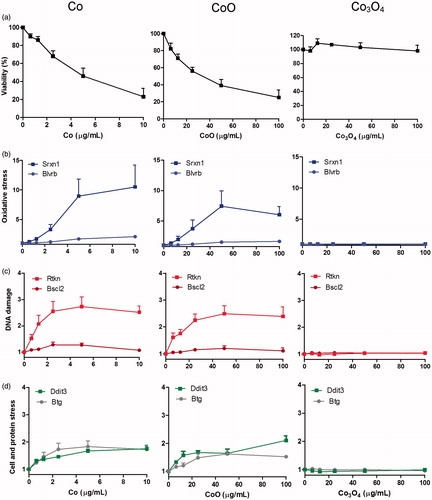
In order to gain insight into the mechanism of genotoxicity, we finally tested the NPs in the ToxTracker reporter assay. The results showed that Co NPs were highly cytotoxic and caused a strong induction of the Srxn1-GFP reporter related to oxidative stress (Nrf2 signaling). However, the second marker for oxidative stress Blvrb-GFP that is associated with Hmox1 signaling was not activated. Co NPs also activated the Rtkn-GFP genotoxicity reporter that is associated with induction of DNA strand breaks (NFκB signaling). The Bscl2-GFP reporter that is associated with induction of promutagenic DNA lesions and DNA replication inhibition was not activated by Co NPs. No significant induction of the Ddit3-GFP (unfolded protein response) and Btg2-GFP (p53 activation) reporters was observed. Similar effects were observed for CoO NPs, but at higher concentrations, whereas the Co3O4 NPs were completely inactive (). BMD analysis on Co and CoO NPs showed a mean (for all reporter cell lines) BMD50 value of 5.4 and 30.8 µg/mL for Co and CoO, respectively (see Table S4). The corresponding BMD20 values were calculated to 1.7 and 7.7 µg/mL. Thus, the BMD values were approximately six times lower for the Co NPs suggesting similar effects if surface area dose was considered (since Co NPs have approx. 6 times larger BET area). None of the Co-based NPs caused an increase in the Bscl2 reporter, which suggest that none of the NPs (or Co ions released from the NPs) could interact with DNA in a manner that cause stalled replication forks. These results suggest that Co and CoO, despite having different reactivity, act via similar mechanisms whereas Co3O4 NPs are inactive.
Figure 9. ToxTracker assay response to the Co-based NPs. Cytotoxicity assessed as intact cells (a) and ToxTracker reporter activation in live cells (b–d) assessed by flow cytometry. The reporter cell lines Srxn1-GFP and Blvrb-GFP report on oxidative stress (Nrf2-associated and Nrf2-indipendent, respectively), Bscl2-GFP and Rtkn-GFP report on DNA damage (ATR/Chk1 signaling and NF-kB signaling, respectively), Ddit3-GFP indicate unfolded protein response and Btg2-GFP p53-associated cellular stress.
Discussion
Carcinogenic properties of Co-based particles following, for example, inhalation are important from an occupational perspective. Recently, the Committee for Risk Assessment, the European Chemicals Agency, decided to classify Co metal for carcinogenicity (Carc. 1B; H350 with a specific concentration limit of 0.01%) and mutagenicity (Muta. 2; H341) (ECHA Citation2017). In this study, we explored (geno)toxic properties of well characterized Co, CoO, and Co3O4 NPs by using a combination of traditional assays as well as a novel reporter cell system. One main finding is that the ToxTracker reporter cells were shown to efficiently differentiate the toxic potential of these Co-based NPs and at the same time provide mechanistic information. Furthermore, the toxic potential was predicted by the reactivity of the NPs.
The physicochemical characterization of the NPs showed a high reactivity of the Co NPs that can be explained by their corrosion activity and chemically unstable surface oxide (CoO). Our data furthermore suggests that NPs of Co3O4 are chemically stable in the tested in vitro environments, while NPs of CoO partially dissolve. The surface oxide on the Co NPs predominantly consists of chemically unstable CoO, and when starting to transform/dissolve, rapid metal oxidation of the underlying bulk metal takes place resulting in additional release of Co. Thus, the combined effect of a chemically unstable surface oxide and a thermodynamically driven force to corrode is most likely the reason behind the high reactivity and dissolution of the Co NPs. During the electrochemical corrosion process also intermediate products such as H2O2 (Churchill Citation1939) form that contribute to the high oxidative damage potential of Co NPs. A thorough analysis of Co release/dissolution at different experimental conditions showed, for example, a high effect of sonication. In line with previous studies (Sabbioni et al. Citation2014), 25 wt% of the total mass of Co NPs was released after 24 h in complete DMEM at non-sonicated conditions during particle suspension preparation, whereas complete dissolution (100 wt%) was the case after 24 h in the case of initial sonication (20 min in water bath). For the very poorly soluble Co3O4 NPs, sonication did not influence the extent of dissolution. Thus, the role of sonication needs to be recognized in studies using reactive metal NPs, findings in agreement with our previous studies (Cronholm et al. Citation2011; Hedberg et al. Citation2016; Pradhan et al. Citation2016). The low solubility of Co3O4 NPs in complete DMEM is in line with previous findings. Ortega et al. observed, for example, less than 0.5% dissolution in cell medium when tested after 3 and 7 days. Interestingly, the same study observed intracellular dissolution (using micro-PIXE), although in low amounts (0.04–1.6% after 72 h in BEAS-2B) (Ortega et al. Citation2014).
Differences in reactivity of the NPs determined via the physicochemical characterization were reflected in the cellular toxicity studies. Co3O4 NPs were clearly inactive in A549 cells, in line with previous findings (Cavallo et al. Citation2015), although some effects have been observed in BEAS-2B cells and in HepG2 cells (Alarifi et al. Citation2013; Cavallo et al. Citation2015). The lack of toxicity in our study was not explained by the lack of cellular uptake since evident cellular uptake was observed for all three NPs (). The CoO and Co3O4 NPs were mainly observed in endosomes whereas the Co NPs also were detected in the cytoplasm and, interestingly, also appeared to align with the endoplasmatic reticulum. This is in line with observations by Marmorato et al. whom reported agglomerates of cobalt ferrite (CoFe2O4) NPs inside the cells (Balb/3T3 mouse fibroblasts) and especially in the endoplasmic reticulum region (Marmorato et al. Citation2011).
One interesting question concerns the extent of reactivity/toxicity that is driven by released ionic species. By separating the exposed NPs and the released fraction, we have previously shown that cytotoxicity of Cu and Ag NPs appears to be mainly driven by the NPs and likely subsequent intracellular ion release and not the extracellularly released fraction or any formed complexes (Gliga et al. Citation2014; Midander et al. Citation2009). In such experiments, however, it is important to acknowledge differences in the delivered dose of NPs and ions. For NPs that do not dissolve to any large extent, the delivered dose is determined by the balance of sedimentation and diffusional transport, which may be estimated by using mathematical models (Cohen et al. Citation2014). NPs that dissolve over the experimental time scale are more complicated to model since their dissolution rates and speciation of released ionic species impact the delivered dose and toxicity (Shi et al. Citation2017). When comparing cellular uptake of Co NPs and Co ions, Sabbioni et al. clearly showed higher uptake of the NPs (Sabbioni et al. Citation2014). Interestingly, the same study also reported higher amount of Co associated to the nuclear fraction for the NPs compared to Co ions. When we tested the DNA-damage potential of freshly released fractions from Co NPs, we observed oxidative DNA damage (), but not when testing the released fraction that was separated from the NPs via centrifugation. This may suggest a change in chemical speciation of released Co with time in the cell medium.
To further elucidate the role of the released fraction and speciation of released Co, we performed a range of experiments on the ROS generating capacity. The Co NPs revealed an extraordinary high ROS-generating capacity in the cell-free assay (). The reactivity was predominantly attributed to inherent properties of the NPs, since much less activity was observed for the released fraction (prepared after 2 h incubation). The ROS-generating capacity of the CoO NPs was much lower compared to Co NPs and predominantly related to the released fraction (). The speciation of released Co-species is obviously important since the ROS-generating capacity was only observed when the assay was performed in cell medium (without serum) and not in PBS, despite a higher amount of Co-species in this released fraction (). This is likely explained by the fact that released Co ions (Co2+) precipitate in the presence of physiological concentrations of phosphates as predicted by modeling () and bind to proteins such as albumin (Lloyd et al. Citation1997; Sabbioni et al. Citation2014) possibly resulting in protein aggregation (Hedberg et al. Citation2015). Indeed, as observed in , serum was found protective in the ROS-experiments. Despite this protective effect, an increase in DNA breaks and oxidative DNA damage (Fpg-sites) was observed after exposure to both Co and CoO NPs ( and ).
Several other studies have shown genotoxic effects of both Co-based NPs as well as ionic Co added as CoCl2 (e.g. Xie et al. Citation2016), but distinct differences have also been noted (Ponti et al. Citation2009). ROS generation from Co ions is possible in the presence of H2O2 via Fenton-type reactions but can also be produced on the Co metal surface via corrosion (oxidation) reactions (Lison et al. Citation2001). Our data on ROS generation clearly support a high activity of the Co NPs due to corrosion generating both Co2+ and ROS.
The cytotoxicity observed after exposure to the six different reporter cells clearly ranked the NPs as highly cytotoxic in the case of Co NPs (average BMD50 value: 5.4 µg/mL), medium toxic for CoO (30.8 µg/mL) and non-cytotoxic for Co3O4. Furthermore, taken into account differences in surface area, the toxicity of Co and CoO NPs was similar based on surface area dose rather than of mass dose. The fact that cytotoxic effects were observed for CoO in the ToxTracker assay but not in the lung cells suggests higher sensitivity of ToxTracker cells, likely at least in part due to their higher rate of proliferation. Our study supports the general notion that generation of ROS is an important underlying mechanism for Co toxicity, shown as a clear increase in the Srxn1-reporter (). This reporter is mainly activated by particles that induce ROS that can lead to DNA single strand breaks during the repair of oxidative DNA lesions. During the extensive validation of the ToxTracker assay, genotoxic carcinogens were shown to generally activate both the Bscl2-GFP and Rtkn-GFP DNA damage reporters (Hendriks et al. Citation2016). However, the Co NPs tested in this study selectively activated the Rtkn-GFP genotoxicity reporter, but not the Bscl2-GFP reporter. The induction of the Bscl2-reporter is associated with the ATR (ataxia telangiectasia and Rad3-related)/Checkpoint Kinase 1 (CHK1) DNA damage signaling pathway and identifies compounds that induce DNA replication blocking lesions (Hendriks et al. Citation2012). The Rtkn reporter is activated upon induction of DNA double strand breaks and is related to NF-kB signaling. High levels of ROS production and oxidative DNA lesions can result in DNA single strand breaks that in turn will lead to DNA double strand breaks during DNA replication. Both micronuclei-induction and DNA double strand breaks (γH2AX-foci) have been documented following exposure to Co-based NPs (Ponti et al. Citation2009; Wan et al. Citation2012). The absence of Bscl2-GFP reporter activation indicates that the Co NPs that were tested in this study did not directly bind to the DNA and interfere with DNA replication. However, the induction of the Rtkn-GFP reporter indicates a more severe oxidative stress response and resulting DNA damage compared to compounds that only induce the Srxn1-GFP reporter. The induction of the Srxn1-GFP and Rtkn-GFP reporters by the Co and CoO NPs suggests that induction of oxidative stress and subsequent DNA strand breaks is the primary mechanism of genotoxicity. Further investigation regarding mutagenicity as a result of this damage is warranted.
Taken together, this study provides detailed NPs characterization and mechanistic insight into (geno)toxic effects induced by Co-based NPs. Our results suggest that NPs of Co and CoO, but not Co3O4, may be grouped together for risk assessment.
Supplemental Material
Download MS Word (475.9 KB)Disclosure statement
GH and RD are employed by Toxys, a Dutch company that offers ToxTracker as a commercial service.
Additional information
Funding
References
- Åkerlund, E., F. Cappellini, S. Di Bucchianico, S. Islam, S. Skoglund, R. Derr, I. Odnevall Wallinder, G. Hendriks, and H. L. Karlsson. 2018. “Genotoxic and Mutagenic Properties of Ni and NiO Nanoparticles Investigated by Comet Assay, Gamma-H2AX Staining, Hprt Mutation Assay and ToxTracker Reporter Cell Lines.” Environmental and Molecular Mutagenesis 59 (3): 211–222. doi:10.1002/em.22163.
- Alarifi, S., D. Ali, A. O. Y, M. Ahamed, M. A. Siddiqui, and A. A. Al-Khedhairy. 2013. “Oxidative Stress Contributes to Cobalt Oxide Nanoparticles-Induced Cytotoxicity and DNA Damage in Human Hepatocarcinoma Cells.” International Journal of Nanomedicine 8: 189–199. doi:10.2147/IJN.S37924
- Annangi, B., J. Bach, G. Vales, L. Rubio, R. Marcos, and A. Hernandez. 2015. “Long-Term Exposures to Low Doses of Cobalt Nanoparticles Induce Cell Transformation Enhanced by Oxidative Damage.” Nanotoxicology 9 (2): 138–147. doi:10.3109/17435390.2014.900582.
- Cavallo, D., A. Ciervo, A. M. Fresegna, R. Maiello, P. Tassone, G. Buresti, S. Casciardi, S. Iavicoli, and C. L. Ursini. 2015. “Investigation on Cobalt-Oxide Nanoparticles Cyto-Genotoxicity and Inflammatory Response in Two Types of Respiratory Cells.” Journal of Applied Toxicology 35 (10): 1102–1113. doi:10.1002/jat.3133.
- Chattopadhyay, S., S. K. Dash, S. Tripathy, B. Das, D. Mandal, P. Pramanik, and S. Roy. 2015. “Toxicity of Cobalt Oxide Nanoparticles to Normal Cells; An in Vitro and in Vivo Study.” Chemico-Biological Interactions 226: 58–71. doi:10.1016/j.cbi.2014.11.016.
- Churchill, J. 1939. “The Formation of Hydrogen Peroxide during Corrosion Reactions.” Transactions of the Electrochemical Society 76 (1): 341–357. doi:10.1149/1.3500289.
- Cohen, J. M., J. G. Teeguarden, and P. Demokritou. 2014. “An Integrated Approach for the in Vitro Dosimetry of Engineered Nanomaterials.” Particle and Fibre Toxicology 11 (1): 20. doi:10.1186/1743-8977-11-20.
- Colognato, R., A. Bonelli, J. Ponti, M. Farina, E. Bergamaschi, E. Sabbioni, and L. Migliore. 2008. “Comparative Genotoxicity of Cobalt Nanoparticles and Ions on Human Peripheral Leukocytes in Vitro.” Mutagenesis 23 (5): 377–382. doi:10.1093/mutage/gen024.
- Cronholm, P., K. Midander, H. L. Karlsson, K. Elihn, I. Odnevall Wallinder, and L. Moller. 2011. “Effect of Sonication and Serum Proteins on Copper Release from Copper Nanoparticles and the Toxicity towards Lung Epithelial Cells.” Nanotoxicology 5 (2): 269–281. doi:10.3109/17435390.2010.536268.
- Di Bucchianico, S., F. Cappellini, F. Le Bihanic, Y. Zhang, K. Dreij, and H. L. Karlsson. 2017. “Genotoxicity of TiO2 Nanoparticles Assessed by Mini-Gel Comet Assay and Micronucleus Scoring with Flow Cytometry.” Mutagenesis 32 (1): 127–137. doi:10.1093/mutage/gew030.
- ECHA. 2017. RAC concludes on 10 scientific opinions for harmonised classification and labelling – ECHA/NA/17/23. In E. C. Agency ed. https://echaeuropaeu/documents/10162/23012100/na_annex_rac42pdf/061303fd-0ad5-3e5b-fade-93cb10d72855.
- Giachino, C., L. Orlando, and V. Turinetto. 2013. “Maintenance of Genomic Stability in Mouse Embryonic Stem Cells: relevance in Aging and Disease.” International Journal of Molecular Sciences 14 (2): 2617–2636. doi:10.3390/ijms14022617.
- Gill, H. S., G. Grammatopoulos, S. Adshead, E. Tsialogiannis, and E. Tsiridis. 2012. “Molecular and Immune Toxicity of CoCr Nanoparticles in MoM Hip Arthroplasty.” Trends in Molecular Medicine 18 (3): 145–155. doi:10.1016/j.molmed.2011.12.002.
- Gliga, A. R., S. Skoglund, I. Odnevall Wallinder, B. Fadeel, and H. L. Karlsson. 2014. “Size-Dependent Cytotoxicity of Silver Nanoparticles in Human Lung Cells: The Role of Cellular Uptake, Agglomeration and Ag Release.” Particle and Fibre Toxicology 11 (1): 11. doi:10.1186/1743-8977-11-11.
- Hansen, T., G. Clermont, A. Alves, R. Eloy, C. Brochhausen, J. P. Boutrand, A. M. Gatti, and C. J. Kirkpatrick. 2006. “Biological Tolerance of Different Materials in Bulk and Nanoparticulate Form in a Rat Model: sarcoma Development by Nanoparticles.” Journal of the Royal Society, Interface 3 (11): 767–775. doi:10.1098/rsif.2006.0145.
- Hedberg, Y. S., M. Pettersson, S. Pradhan, I. Odnevall Wallinder, M. W. Rutland, and C. Persson. 2015. “Can Cobalt(II) and Chromium(III) Ions Released from Joint Prostheses Influence the Friction Coefficient?” ACS Biomaterials Science & Engineering 1 (8): 617–620. doi:10.1021/acsbiomaterials.5b00183.
- Hedberg, Y. S., S. Pradhan, F. Cappellini, M. E. Karlsson, E. Blomberg, H. L. Karlsson, I. Odnevall Wallinder, and J. F. Hedberg. 2016. “Electrochemical Surface Oxide Characteristics of Metal Nanoparticles (Mn, Cu and Al) and the Relation to Toxicity.” Electrochimica Acta 212: 360–371. doi:10.1016/j.electacta.2016.07.017.
- Hendriks, G., M. Atallah, B. Morolli, F. Calleja, N. Ras-Verloop, I. Huijskens, M. Raamsman, B. van de Water, and H. Vrieling. 2012. “The ToxTracker Assay: novel GFP Reporter Systems That Provide Mechanistic Insight into the Genotoxic Properties of Chemicals.” Toxicological Sciences 125 (1): 285–298. doi:10.1093/toxsci/kfr281.
- Hendriks, G., R. S. Derr, B. Misovic, B. Morolli, F. M. Calleja, and H. Vrieling. 2016. “The Extended ToxTracker Assay Discriminates between Induction of DNA Damage, Oxidative Stress, and Protein Misfolding.” Toxicological Sciences 150 (1): 190–203. doi:10.1093/toxsci/kfv323.
- Karlsson, H. L., A. R. Gliga, F. M. Calleja, C. S. Goncalves, I. Odnevall Wallinder, H. Vrieling, B. Fadeel, and G. Hendriks. 2014. “Mechanism-Based Genotoxicity Screening of Metal Oxide Nanoparticles Using the ToxTracker Panel of Reporter Cell Lines.” Particle and Fibre Toxicology 11 (1): 41. doi:10.1186/s12989-014-0041-9.
- Lison, D. 2015. “Cobalt.” In Handbook on The Toxicology of Metals, edited by G. F. Nordberg, B. A. Fowler, and M. Nordberg. 4th ed., 743–763. London, UK.
- Lison, D., M. De Boeck, V. Verougstraete, and M. Kirsch-Volders. 2001. “Update on the Genotoxicity and Carcinogenicity of Cobalt Compounds.” Occupational and Environmental Medicine 58 (10): 619–625. doi:10.1136/oem.58.10.619.
- Lloyd, D. R., D. H. Phillips, and P. L. Carmichael. 1997. “Generation of Putative Intrastrand Cross-Links and Strand Breaks in DNA by Transition Metal Ion-Mediated Oxygen Radical Attack.” Chemical Research in Toxicology 10 (4): 393–400. doi:10.1021/tx960158q.
- Marmorato, P., G. Ceccone, A. Gianoncelli, L. Pascolo, J. Ponti, F. Rossi, M. Salome, B. Kaulich, and M. Kiskinova. 2011. “Cellular Distribution and Degradation of Cobalt Ferrite Nanoparticles in Balb/3T3 Mouse Fibroblasts.” Toxicology Letters 207 (2): 128–136. doi:10.1016/j.toxlet.2011.08.026.
- May, M. P. 2015. “JESS at Thirty: Strengths, Weaknesses and Future Needs in the Modelling of Chemical Speciation.” Applied Geochemistry 55: 3–16. doi:10.1016/j.apgeochem.2014.11.023.
- Midander, K., P. Cronholm, H. L. Karlsson, K. Elihn, L. Moller, C. Leygraf, and I. Odnevall Wallinder. 2009. “Surface Characteristics, Copper Release, and Toxicity of Nano- and Micrometer-Sized Copper and Copper(II) Oxide Particles: A Cross-Disciplinary Study.” Small 5 (3): 389–399. doi:10.1002/smll.200801220.
- Morsdorf, A., I. Odnevall Wallinder, and Y. Hedberg. 2015. “Bioaccessibility of Micron-Sized Powder Particles of Molybdenum Metal, Iron Metal, Molybdenum Oxides and Ferromolybdenum–Importance of Surface Oxides.” Regulatory Toxicology and Pharmacology 72 (3): 447–457. doi:10.1016/j.yrtph.2015.05.027.
- NTP. 2016. Report on carcinogens monograph on cobalt and cobalt compounds that telease cobalt ions in vivo. Office of the Report on Carcinogens, Division of the National Toxicology Program.
- Ortega, R., C. Bresson, C. Darolles, C. Gautier, S. Roudeau, L. Perrin, M. Janin, et al. 2014. “Low-Solubility Particles and a Trojan-Horse Type Mechanism of Toxicity: The Case of Cobalt Oxide on Human Lung Cells.” Particle and Fibre Toxicology 11 (1): 14. doi:10.1186/1743-8977-11-14.
- Ponti, J., E. Sabbioni, B. Munaro, F. Broggi, P. Marmorato, F. Franchini, R. Colognato, and F. Rossi. 2009. “Genotoxicity and Morphological Transformation Induced by Cobalt Nanoparticles and Cobalt Chloride: An in Vitro Study in Balb/3T3 Mouse Fibroblasts.” Mutagenesis 24 (5): 439–445. doi:10.1093/mutage/gep027.
- Pradhan, S., J. Hedberg, E. Blomberg, S. Wold, and I. Odnevall Wallinder. 2016. “Effect of Sonication on Particle Dispersion, Administered Dose and Metal Release of Non-Functionalized, Non-Inert Metal Nanoparticles.” Journal of Nanoparticle Research 18 (9): 285. doi:10.1007/s11051-016-3597-5.
- Sabbioni, E., S. Fortaner, M. Farina, R. Del Torchio, C. Petrarca, G. Bernardini, R. Mariani-Costantini, et al. 2014. “Interaction with Culture Medium Components, Cellular Uptake and Intracellular Distribution of Cobalt Nanoparticles, Microparticles and Ions in Balb/3T3 Mouse Fibroblasts.” Nanotoxicology 8 (1): 88–99. doi:10.3109/17435390.2012.752051.
- Sauni, R., P. Oksa, J. Uitti, A. Linna, R. Kerttula, and E. Pukkala. 2017. “Cancer Incidence among Finnish Male Cobalt Production Workers in 1969–2013: A Cohort Study.” BMC Cancer 17 (1): 340.doi:10.1186/s12885-017-3333-2
- Shi, M., K. L. de Mesy Bentley, G. Palui, H. Mattoussi, A. Elder, and H. Yang. 2017. “The Roles of Surface Chemistry, Dissolution Rate, and Delivered Dose in the Cytotoxicity of Copper Nanoparticles.” Nanoscale 9 (14): 4739–4750.doi:10.1039/c6nr09102d
- Sisler, J. D., S. V. Pirela, J. Shaffer, A. L. Mihalchik, W. P. Chisholm, M. E. Andrew, D. Schwegler-Berry, V. Castranova, P. Demokritou, and Y. Qian. 2016. “Toxicological Assessment of CoO and La2O3 Metal Oxide Nanoparticles in Human Small Airway Epithelial Cells.” Toxicological Sciences 150 (2): 418–428.doi:10.1093/toxsci/kfw005
- Skoglund, S., J. Hedberg, E. Yunda, A. Godymchuk, E. Blomberg, and I. Odnevall Wallinder. 2017. “Difficulties and Flaws in Performing Accurate Determinations of Zeta Potentials of Metal Nanoparticles in Complex Solutions-Four Case Studies.” PLoS One 12 (7): e0181735.doi:10.1371/journal.pone.0181735
- Tsao, T. M., Y. M. Chen, and M. K. Wang. 2011. “Origin, Separation and Identification of Environmental Nanoparticles: A Review.” Journal of Environmental Monitoring 13 (5): 1156–1163.doi:10.1039/c1em10013k
- Uboldi, C., T. Orsiere, C. Darolles, V. Aloin, V. Tassistro, I. George, and V. Malard. 2015. “Poorly Soluble Cobalt Oxide Particles Trigger Genotoxicity via Multiple Pathways.” Particle and Fibre Toxicology 13 (1): 5.doi:10.1186/s12989-016-0118-8
- Vogelgesang, J., and J. Hädrich. 1998. “Limits of Detection, Identification and Determination: A Statistical Approach for Practitioners.” Accreditation and Quality Assurance 3 (6): 242–255.doi:10.1007/s007690050234
- Wan, R., Y. Mo, L. Feng, S. Chien, D. J. Tollerud, and Q. Zhang. 2012. “DNA Damage Caused by Metal Nanoparticles: involvement of Oxidative Stress and Activation of ATM.” Chemical Research in Toxicology 25 (7): 1402–1411.doi:10.1021/tx200513t
- Wan, R., Y. Mo, Z. Zhang, M. Jiang, S. Tang, and Q. Zhang. 2017. “Cobalt Nanoparticles Induce Lung Injury, DNA Damage and Mutations in Mice.” Particle and Fibre Toxicology 14 (1): 38.doi:10.1186/s12989-017-0219-z
- Xie, H., L. J. Smith, A. L. Holmes, T. Zheng, and J. Pierce Wise Sr. 2016. “The Cytotoxicity and Genotoxicity of Soluble and Particulate Cobalt in Human Lung Epithelial Cells.” Environmental and Molecular Mutagenesis 57 (4): 282–287.doi:10.1002/em.22009