
Abstract
Although multiple studies have reported the toxicological effects and underlying mechanisms of toxicity of silver nanoparticles (AgNP) in a variety of organisms, the interactions of AgNP with environmental contaminants such as cadmium are poorly understood. We used biochemical assays and mass spectrometry-based proteomics to assess the cellular and molecular effects induced by a co-exposure of HepG2 cells to AgNP and cadmium. Cell viability and energy homeostasis were slightly affected after a 4-h exposure to AgNP, cadmium, or a combination of the two; these endpoints were substantially altered after a 24-h co-exposure to AgNP and cadmium, while exposure to one of the two contaminants led only to minor changes. Proteomics analysis followed the same trend: while a 4-h exposure induced minor protein deregulation, a 24-h exposure to a combination of AgNP and cadmium deregulated 43% of the proteome. The toxicity induced by a combined exposure to AgNP and cadmium involved (1) inactivation of Nrf2, resulting in downregulation of antioxidant defense and proteasome-related proteins, (2) metabolic adaptation and ADP/ATP imbalance, and (3) increased protein synthesis possibly to reestablish homeostasis. The adaptation strategy was not sufficient to restore ADP/ATP homeostasis and to avoid cell death.
Introduction
Production and application of silver nanoparticles (AgNP) has grown substantially over the past decades, and AgNP are now the most widely used nanoparticles among engineered nanomaterials (Vance et al. Citation2015). AgNP have an enormous potential to improve current technologies in multiple areas, from medicine and pharmacology to consumer products and bioremediation (Zhang, Hu, and Deng Citation2016), but not without the release of nanowastes into the natural environment (Cleveland et al. Citation2012; Furman, Usenko, and Lau Citation2013). The estimated concentration of AgNP in surface waters, a potential human exposure route, is 0.088–10,000 ng/L. It is, however, difficult to estimate the concentrations of nanoparticles released at a given time, because of their prevalence in commercial products (Maurer-Jones et al. Citation2013).
Multiple research groups have demonstrated the extent of AgNP toxicity to cells and tissues using controlled experiments (Navarro et al. Citation2008; Govindasamy and Rahuman Citation2012; Wildt et al. Citation2016). The natural environment continuously receives complex mixtures of contaminants with various chemical properties. Therefore, the study of interactions among contaminants has a practical importance in toxicology (Goldoni and Johansson Citation2007), particularly for novel contaminants such as AgNP. A number of studies have investigated the interactions of nanoparticles and widespread environmental xenobiotics, such as metals, polycyclic aromatic hydrocarbons, and pesticides in different organisms (Guo et al. Citation2013; Ferreira et al. Citation2014; Della Torre et al. Citation2015; Deville et al. Citation2016). Deville et al. (Citation2016), for instance, showed that interaction of gold nanoparticles with nickel sulfate led to competitive effects on dendritic cell maturation, unlike separate exposures. Guo et al. (Citation2013) observed synergistic interaction of silica nanoparticles and cadmium chloride in mice, resulting in enhanced biochemical response and metal biodistribution. Cadmium (Cd2+) is a non-essential metal and ubiquitous contaminant of natural environments and dietary products (Arbuckle et al. Citation2016). Because it is used in battery production, fertilizers, and plastic stabilizers (Capaldo et al. Citation2016), this metal enters natural environments and induces adverse effects on biota and humans (Cuypers et al. Citation2010).
In a previous study, we showed that mercury ion uptake by HepG2 cells was enhanced by co-exposure with 2 nm AgNP, and co-exposure of Cd2+ with AgNP induced greater toxicity (e.g. decreased cell viability and proliferation, and increased production of reactive oxygen species [ROS]), even though AgNP did not increase intracellular Cd2+ levels (Miranda et al. Citation2017). Based on these observations, we used mass spectrometry-based proteomics in this study to elucidate in greater detail the molecular processes underlying the toxic biological outcomes induced by a combined exposure of AgNP and Cd2+ in HepG2 cells. Proteomics results were supplemented with analyses of cell viability, ADP/ATP ratio, and ROS production.
Methods
AgNP characterization
Spherical AgNP (10 nm) in citrate buffer were commercially obtained from Sigma-Aldrich (St. Louis, MO). The mass concentration was 0.02 mg/mL in 2 mM citrate buffer. The suspension was characterized according to nanoparticle size distribution (Zetasizer Nano ZS, Malvern Instruments, Malvern, UK) and shape (transmission electron microscopy [TEM], images provided by the producer on JEM-1400Plus; JEOL, Tokyo, Japan).
Cell culture
Human HepG2 hepatocellular carcinoma cells (Sigma-Aldrich) were cultured as a monolayer in high-glucose Dulbecco’s modified Eagle’s medium (DMEM) supplemented with 10% inactivated fetal bovine serum (FBS) and antibiotics (10 U/mL penicillin and 10 µg/mL streptomycin) at 37 °C and 5% CO2. Cells at passages 110–118 were used in the study.
Exposure protocol
Cells were seeded onto 96-well microplates (4 × 10⁴ cells per well) for analyses of lactate dehydrogenase (LDH) leakage (cell viability) and ADP/ATP ratio (energy metabolism), and onto 60-mm Petri dishes (1.5 × 10⁶ cells per well) for trypan blue (cell viability) and proteomics analyses. Contaminant concentrations used in the study were selected based on a previous study published by our group (Miranda et al. Citation2017). Briefly, toxicity-screening tests of AgNP and Cd2+ were made to identify and select two concentrations of each contaminant; a non-cytotoxic one and a cytotoxic one. Among all possible combinations, the combined exposure of 3.5 µg/mL of AgNP with 1.5 µM of Cd2+ induced toxic effects that could not be predicted based on the single-contaminant exposures effects in HepG2 cells. Therefore, these concentrations were chosen to further analyze the effects of AgNP and Cd2+ on cell proteome.
After 24 h of plating, the medium was replaced by fresh DMEM with antibiotics and 2% FBS containing either AgNP (3.5 µg/mL), or CdCl2 (1.5 µM), or a combination of AgNP and CdCl2 (AgNP + Cd2+). In the case of co-exposures, at first, AgNP were added to the medium, homogenized and then CdCl2 was added. Cells were exposed to these contaminants for 4 and 24 h using appropriate controls.
Cell viability
The LDH assay was used to assess the degree of cellular membrane damage. The CytoTox-ONE (Promega, Madison, WI) cell viability assay was performed in 96-well microplates according to the manufacturer’s instructions. Briefly, cells were exposed to the contaminants for 4 and 24 h at a final volume of 100 µL and then stabilized at 22 °C. Next, 100 µL of CytoTox-ONE reagent were added to each experimental well, and the cells were incubated for 10 min. Two microliters of lysis solution were used in positive control wells. At the end of the incubation period, 50 µL of stop solution were added to all wells, and fluorescence was measured at 560 nm excitation and 590 nm emission. Cytotoxicity was expressed as the percent of maximum LDH release.
For the trypan blue assay, supernatants were collected after the exposure periods, and cells were detached with 0.5 mL of trypsin (0.25% trypsin and 0.02% EDTA in phosphate-buffered saline [PBS], pH 7.2), suspended in tubes containing 5 mL of culture medium with 2% FBS, pelleted (500 g for 5 min), and resuspended in 1 mL of total culture medium with 2% FBS. Next, 30 µL from each sample were stained with 30 µL of trypan blue (Sigma-Aldrich) and counted with a Neubauer chamber under an inverted light microscope. Results are expressed as percentage of control.
ADP/ATP ratio assay
The ADP/ATP kit (Sigma-Aldrich) was used in 96-well microplates according to the manufacturer’s instructions. Briefly, in the first step cells were lysed to release ATP and ADP. In the presence of luciferase, ATP immediately reacts with luciferin-D to emit light that is measured in a luminometer and indicates ATP levels (relative luminescence units [RLU]A). Prior to the second step, ATP levels are measured again (RLUB). Next, ADP is converted to ATP through an enzymatic reaction that generates light in the presence of luciferin-D. This third light intensity is measured and represents the total ADP and ATP (RLUC). The ADP/ATP ratio is calculated by dividing ADP levels (RLUC – RLUB) by ATP levels (RLUA), followed by normalization to cell viability (trypan blue assay).
Statistical procedures for biochemical assays
Three independent experiments were performed, with a total of three replicates per experiment. Data distribution was tested and parametric (one-way ANOVA) tests were performed, followed by Dunnett’s test. Effects of contaminants were verified by comparing data from the control to data from the AgNP, Cd2+, and AgNP + Cd2+ exposures. Toxicological interactions were identified by comparing data from the co-exposure group with data from the single-contaminant groups. p Values lower than 0.05 were considered statistically significant.
Sample preparation for mass spectrometry-based proteomics analysis
Following the exposure periods, the culture medium was removed and cells were carefully rinsed three times with ice-cold PBS. Next, 1 mL of ice-cold PBS, along with protease and phosphatase inhibitors (ProtoSTOP and PhosSTOP; Roche, Basel, Switzerland), were added to the plates and cells were harvested using a cell scraper. Cell suspensions were transferred to 1.5-mL tubes, centrifuged for 5 min at 600 g, and the supernatant discarded. The cell pellets were suspended in ice-cold PBS again, centrifuged for 5 min at 600 g, and stored at −80 °C until analysis.
Lysis buffer (urea [6 M], thiourea [2 M], and protease and phosphatase inhibitors cocktail) and 20 mM of triethylammonium bicarbonate (TEAB) plus a reducing agent (10 mM dithiothreitol) were added to each tube at room temperature for 2 h. Next, samples were diluted (1:10) with 20 mM of TEAB (pH 7.5), cell lysis was enhanced, and DNA was fragmented by tip sonication on ice. Protein concentration was measured by a fluorometric quantification method (Qubit, Life Technologies, Carlsbad, CA), and 50 µg of protein were alkylated in 20 mM iodoacetamide for 30 min in the dark. Following incubation, samples were digested with trypsin (50:1 [w/w] protein to trypsin) overnight at room temperature. Peptides were acidified with 5% formic acid to stop trypsin digestion and dried prior to desalting.
Desalting with R2/R3 micro-columns
Samples were resuspended in 0.1% trifluoroacetic acid (TFA) and desalted using P200 columns made with a C8 plug (3 M Empore) packed with equal ratios of Poros R2 and R3 resin materials (Applied Biosystems, Foster City, CA) in 100% acetonitrile (ACN). The column was prepared by short centrifugation at low speed (100 g), equilibrated with 0.1% TFA, and centrifuged again. This procedure was repeated twice. Next, samples were loaded onto the columns and washed twice with 0.1% TFA. Peptides were eluted with 60% ACN and 0.1% TFA.
Peptide labeling
Fifty micrograms of tryptic peptides per sample group were labeled with iTRAQ 8-plex according to the manufacturer’s instructions. Next, peptides were combined 1:1:1:1:1:1:1:1, dried under vacuum, and stored at –20 °C until further processing.
Sample fractionation
Prior to liquid chromatography-tandem mass spectrometry (LC-MS/MS) analysis, samples were prefractionated to reduce complexity and to remove unbound iTRAQ reagents. The prefractionation methods applied were high-pH and hydrophilic interaction liquid chromatography (HILIC). In the first method, R3 micro-columns in 100% ACN were prepared as previously described and equilibrated with 0.1% NH3. Samples were resuspended in 1% NH3, loaded onto the columns, and washed twice with 0.1% NH3. Finally, peptides were eluted using different concentrations of ACN. Ten fractions were collected and dried.
For HILIC fractionation, samples were resuspended in 90% ACN and 0.1% TFA (solvent B) and loaded to a TSKGel Amide-80 HILIC HPLC column (length, 15 cm; diameter, 2 mm; particle size, 3 μm). Peptides were eluted at 6 µL/min by decreasing solvent B from 100% to 60% over 30 min. A total of nine fractions were collected and dried in a vacuum centrifuge.
Reversed-phase nLC-MS/MS
Each HILIC and high-pH sample was resuspended in 0.1% formic acid and loaded onto an in-house packed trap column (2 cm ×100 µm inner diameter; 5 µm) filled with ReproSil-Pur C18-AQ (Dr. Maisch, Ammerbuch-Entringen, Germany). Peptides were separated on an analytical column (17 cm × 75 µm; 3 µm) packed in-house with ReproSil-Pur C18-AQ (Dr. Maisch) by reversed-phase chromatography on an EASY-nLC system (Thermo Fisher Scientific, Waltham, MA). To avoid the supercharge effect of the iTRAQ 8-plex, a 5% ammonia solution was placed under the electrospray needle. The chromatography gradient was as follows: 0–7% B in 1 min; 7–30% B in 79 min; 30–50% B in 10 min; 50–100% B in 5 min, followed by 8 min 100% B (A: 0.1% formic acid, B: 95% ACN and 0.1% formic acid) at a constant flow rate of 250 nL/min. The nLC system was connected to a Q Exactive high-field hybrid quadrupole-orbitrap mass spectrometer (Thermo Fisher Scientific) operating in positive ion mode with data-dependent acquisition. The full scan was acquired with an automatic gain control target value of 3 × 10⁶ and a maximum injection time of 100 ms. Each MS scan was acquired at a resolution of 60 000 at m/z 200 with a mass range of m/z 400–1400. Twelve intense precursor ions with charge from 2 to 5 were selected for fragmentation with higher-energy collisional dissociation. Fragmentation was performed at normalized collision energy of 30% using an isolation width of 1.2 Da and a dynamic exclusion duration of 20 s. MS2 spectra were acquired at a resolution of 30 000 at m/z 200, with automatic gain control of 1 × 10⁵ and maximum injection time of 200 ms.
Database searches and bioinformatics analysis
Raw data were processed using Proteome Discoverer v. 1.4 (Thermo Fisher Scientific) and searched against the SwissProt human database using the Mascot search engine. Trypsin was selected as the enzyme, allowing two missed cleavage sites. A precursor mass tolerance of 10 ppm and a product ion mass tolerance of 0.02 Da were used. Fixed modifications included carbamidomethylation of cysteines and iTRAQ8-plex labeling for lysines and N-termini. Dynamic modifications contained methionine oxidation and N-terminal acetylation. False discovery rates were calculated using the Percolator algorithm, with the q-value filter set to 0.01. Reporter ion intensities were log2-transformed and normalized in each channel using the median. The R Rollup function from DanteR package (Taverner et al. Citation2012) was used to build protein intensities from peptides. Protein regulations were determined using the Limma ranked product approach (Schwämmle et al. Citation2013). Only proteins with p values ≤0.05 were considered regulated, and subsequently corrected for multiple testing using Storey corrections and leading to a q value filter of ≤0.05.
Regulated proteins were submitted to the Search Tool for the Retrieval of Interacting Genes/Proteins (STRING) Franceschini et al. Citation2013 to elucidate cellular protein responses induced by the exposures to the contaminants. To identify signaling pathways affected by specific contaminants, a signaling pathway analysis was performed with all altered proteins for each group using Ingenuity pathway analysis (http://www.ingenuity.com) with databases of experimental and predictive origin. Ingenuity pathway analysis was also used to visualize significantly altered biological functions (z-score ≥2: activation or z-score ≤−2: inhibition; p value ≤0.05) by the z-scores and p values derived from Fisher´s exact test across all observations.
Results
AgNP characterization
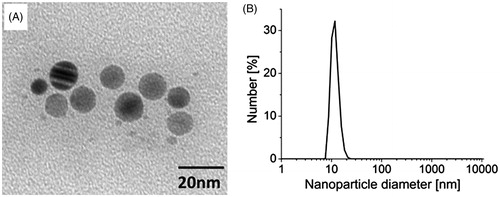
Dynamic light scattering measurements indicated that most of the particles had a diameter of 8–20 nm (, Supplementary Figure 1). TEM images obtained for the sample confirmed the AgNP as monodispersed with a spherical shape (). The high zeta potential of the sample, equal to −30.1 ± 3.28 mV dispersed in the citrate buffer, indicated good colloidal stability of the nanoparticles.
Figure 1. Characterization of silver nanoparticles (AgNP; 0.02 mg/mL in 2 mM citrate buffer). (A) Transmission electron microscopy image of AgNP suspension. (B) Particle distribution according to size.
Cell viability and energy homeostasis
The effects of AgNP, Cd2+, and AgNP + Cd2+ on cell viability and energy homeostasis were evaluated using trypan blue, LDH leakage (plasma membrane permeability), and ADP/ATP ratio (energy homeostasis) assays. Following a 4-h exposure, increases of 1.3- to 1.8-fold in LDH levels were observed for all groups compared with levels in the control (). Findings were similar following a 24-h exposure to single contaminants (1.9-fold increase for AgNP and 1.3-fold increase for Cd2+) (), while the AgNP + Cd2+ co-exposure resulted in a 6.6-fold increase in LDH levels ().
Figure 2. Cell viability assay. Lactate dehydrogenase (LDH) leakage (A, B) and trypan blue (C, D) assays in HepG2 cells exposed for 4 h (A, C) and 24 h (B, D) to silver nanoparticles (AgNP, 3.5 µg/mL), cadmium (Cd2+, 1.5 µM), and AgNP + Cd2+ (3.5 µg/mL + 1.5 µM). Data shown are mean + SEM of three independent experiments in triplicate. Asterisks indicate effects in comparison to the control (**p < 0.01, ***p < 0.001); # indicates toxicological interaction.
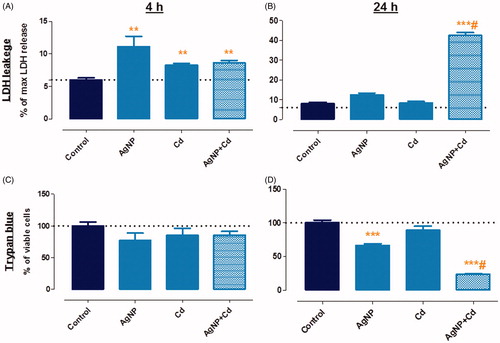
Several studies have suggested that AgNP may interact with LDH via enzyme inhibition or binding (Han et al. Citation2011; Gliga et al. Citation2014), masking the decrease in viability. Therefore, we also conducted a trypan blue assay. Although differing from LDH in terms of sensitivity, a more pronounced effect of AgNP + Cd2+ was also observed in the trypan blue assay after 24 h (). No effects were observed after 4 h of exposure (), but decreases in cell viability during the 24-h experiment occurred for AgNP (34%), Cd2+ (18%), and notably AgNP + Cd2+ (77%; ).
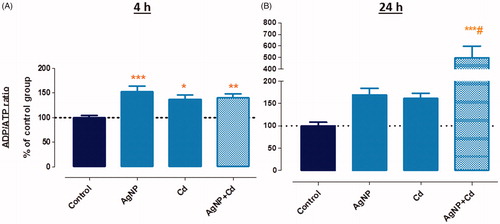
ADP/ATP ratios increased for AgNP (52%), Cd2+ (36%), and AgNP + Cd2+ (40%) after 4 h of exposure (). After 24 h, the increases in the ADP/ATP ratios for AgNP and Cd2+ were 70% and 61%, respectively. A substantial increase of 396%, however, was observed for AgNP + Cd2+ in comparison to the control (). Although an energy imbalance occurred after 4 h of exposure, cells survived and viability loss was minor (LDH assay) or not observed (trypan blue assay). In the 24-h exposure, ADP/ATP imbalance was followed by loss of cell viability. Considering that ATP production was hampered by the exposure, cells may not have undergone apoptosis, at least in the AgNP + Cd2+ group, which may explain the marked increase in LDH leakage (characteristic of necrosis). In addition, we previously reported a change in the cell death mechanism from apoptosis to necrosis using time-lapse confocal microscopy in HepG2 cells exposed to AgNP + Cd2+ (Miranda et al. Citation2017). The findings in this study validate that co-exposure to AgNP and Cd induces significantly more harm to HepG2 cells than exposure to either of the contaminants singly.
Figure 3. ADP/ATP ratio in HepG2 cells exposed for 4 h (A) and 24 h (B) to silver nanoparticles (AgNP, 3.5 µg/mL), cadmium (Cd2+, 1.5 µM), and AgNP + Cd2+ (3.5 µg/mL + 1.5 µM). Data shown are mean + SEM of three independent experiments in triplicate. Asterisks indicate effects in comparison to the control (**p < 0.01, ***p < 0.001); # indicates toxicological interaction.
Comparison of viability data of the present study and in Miranda et al. (Citation2017) suggests that toxicological interaction of AgNP with Cd2+ depends on the particle’s characteristics, such as coating and size, as well as the period of exposure. Noncoated 2 nm AgNP (Miranda et al. Citation2017) interaction with Cd2+ induced earlier toxic effects (e.g. decreased cell viability and increased ROS levels already after 4 h) than 10 nm citrate-coated AgNP (used in this study). However, after 24 h these endpoints reached similar values after co-exposure of both AgNP with Cd2+.
Proteomics
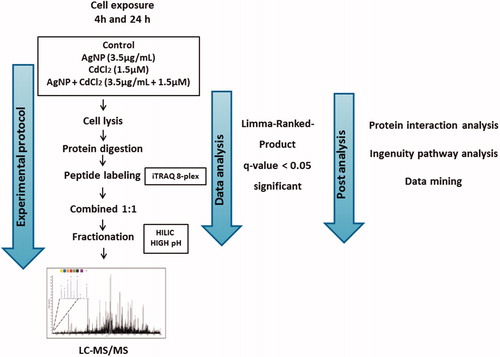
We used quantitative proteomics to identify differentially expressed proteins following AgNP + Cd2+ exposure. displays the experimental design. LC-MS/MS analysis identified 4522 proteins across all experimental repetitions (Supplementary Table 1).
Figure 4. Schematic workflow to study the interaction of silver nanoparticles (AgNP) and cadmium in HepG2 cells.
The term ‘upregulated’ was used to describe proteins more abundant after exposure to the contaminants, while ‘downregulated’ refers to those less abundant after exposure, compared to control; the term ‘deregulated’ refers to statistically significant regulated proteins (both up and downregulated). displays the numbers of upregulated and downregulated proteins following 4 h (A) and 24 h (C) of exposure to the contaminants in comparison with the controls (Supplementary Tables 2 and 3). After 4 h of exposure, 54 proteins were differently regulated for AgNP (30 upregulated and 24 downregulated), 50 proteins for Cd2+ (25 upregulated and 25 downregulated), and 14 proteins for AgNP + Cd2+ (five upregulated and nine downregulated). Multiple proteins were differentially regulated in only one of the three-contaminant groups: AgNP, 47 proteins; Cd2+, 40 proteins; AgNP + Cd2+, nine proteins ().
Figure 5. Quantitative proteomic analysis of three independent experiments. Upregulated and downregulated proteins in HepG2 cells after 4 h (A) and 24 h (C) of exposure to silver nanoparticles (AgNP, 3.5 µg/mL), cadmium (Cd2+, 1.5 µM), and AgNP + Cd2+ (3.5 µg/mL + 1.5 µM). Overlap among proteins regulated by each contaminant after 4 h (B) and 24 h (D) of exposure.
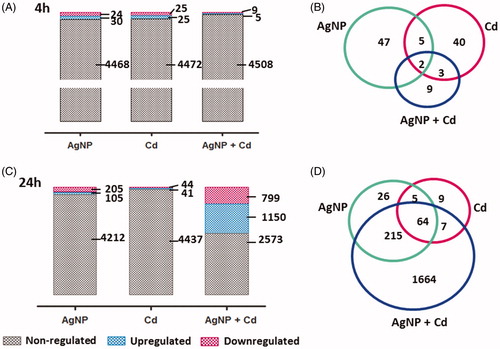
After 24 h of exposure (), 310 proteins were differentially regulated for AgNP (105 upregulated and 205 downregulated), 85 proteins for Cd2+ (41 upregulated and 44 downregulated), and 1949 proteins for AgNP + Cd2+ (1150 upregulated and 799 downregulated). Exposure-specific regulation was observed in 26 proteins for AgNP, nine for Cd2+, and 1664 for AgNP + Cd2+ ().
For all groups, the global cellular response to the exposures was in the range of a few hours and intensified over a 24-h exposure period, with pronounced differences in protein regulation, particularly for cells co-exposed to AgNP and Cd2+ (alteration of 43% of the proteome after 24 h of exposure vs. 0.3% after 4 h of exposure). Moreover, the 24-h response to AgNP + Cd2+ could not be predicted from the responses to the AgNP and Cd2+ exposures.
Molecular mechanisms underlying the toxic responses
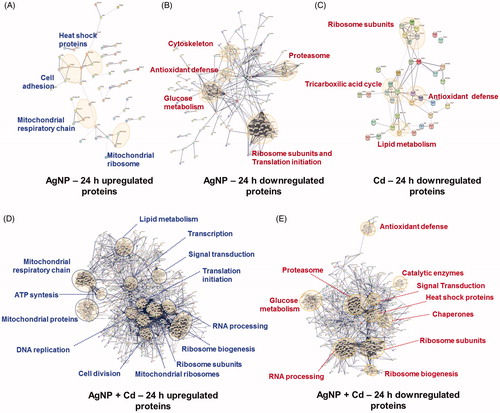
To better understand the molecular mechanisms involved in the toxicity of AgNP, Cd2+, and AgNP + Cd2+, protein-protein interaction networks were built using a STRING algorithm for the 24-h exposure experiment (), as networks were not formed after 4 h of exposure. AgNP induced the upregulation of mitochondrial proteins related to the respiratory chain and biogenesis of ribosomes, as well as heat shock and cell-cell/matrix adhesion proteins (). Multiple proteins involved with translation initiation and ribosome structure were downregulated. Defined clusters of proteins involved in glucose metabolism, antioxidant defense, and cell signaling were also observed (). Following the Cd2+ exposure, clusters of protein-protein interactions were only observed for proteins that were downregulated, indicating that nutrient metabolism and depletion of antioxidant defenses were related to the cellular response (). Protein-protein interactions in the co-exposure group related more to AgNP than to Cd2+. Upregulation occurred for mitochondrial and respiratory chain proteins, as well as for proteins involved in lipid metabolism, transcription, RNA processing, ribosome formation, and translation (). Downregulation occurred for chaperone proteins such as heat shock proteins, proteasome subunits, antioxidant defense proteins, and proteins involved in glycolysis ().
Figure 6. Protein-protein interaction networks. Functional interaction networks of HepG2 cellular proteins deregulated by silver nanoparticles (AgNP) and cadmium (Cd2+) after 24 h were built using a STRING algorithm. Thicker lines represent stronger interactions and only interactions with high confidence (score ≥0.7) are shown. AgNP (A, B), Cd2+ (C), and AgNP + Cd2+ (D, E).
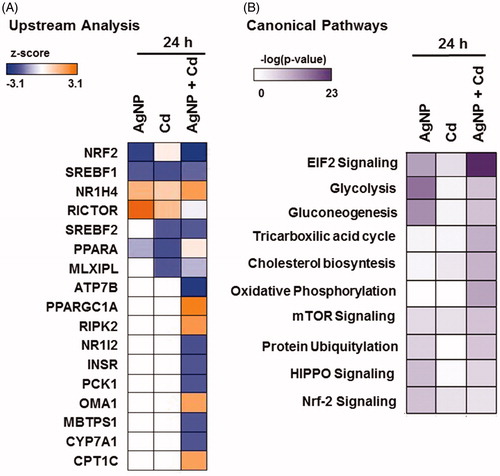
Pathway analysis was performed to identify upstream regulators (z-score >2) involved in the deregulation of proteins following exposure (). Significant changes in upstream regulators were only observed after 24 h of exposure to the three test contaminants. Inhibition of the transcription factor Nrf2 and activation of RICTOR (subunit of mTORC2) occurred following exposure to AgNP. Inhibition of the lipid homeostasis regulators PPAR-γ and SREBF1 was observed following exposure to Cd2+. Twelve upstream regulators were differentially altered in the response to AgNP + Cd2+ exposure: Seven were inhibited, including Nrf2 and PCK1, which is involved in gluconeogenesis; five were activated, including the lipid homeostasis-related proteins PPARGC1A, CPI1, and NR1H4. Finally, canonical pathway analysis (p ≤ 0.05) indicated that the affected signaling pathways were mainly associated with cell signaling, glucose and lipid metabolism, and oxidative stress-related responses ().
Figure 7. Ingenuity pathway analysis. (A) Upstream regulators (z score >2) in HepG2 cells exposed to silver nanoparticles (AgNP; RICTOR and NFE2L2), cadmium (Cd2+; PPAR-α and SREBF1), and AgNP + Cd2+ (ATP7B, MBTPS1, PCK1, NFE2L2, NR1I2, INSR, CYP7A1, OMA1, CPT1C, RIPK2, NR1H4, and PPARGC1A) for 24 h. (B) Canonical pathway analysis (p value ≤0.05) in cells exposed to AgNP, Cd2+, and AgNP + Cd2+ for 24 h.
Discussion
Toxicity associated with Nrf2 inactivation
Oxidative stress results from the imbalance of pro-oxidants and antioxidant defenses; cells respond by increasing the expression and activity of antioxidant proteins, and by activating pathways related to survival and stress adaptation (Holmström and Finkel Citation2014).
Downregulation of antioxidant enzymes such as superoxide dismutase and peroxiredoxin, observed after a 24-h exposure to all test contaminants (; Supplementary Table 4), may impair antioxidant cell responses and lead to increased levels of ROS. Thioredoxins were also downregulated after a 24-h exposure to AgNP and to AgNP + Cd2+ (; Supplementary Table 4). This enzyme has an important role in protein repair after oxidative damage, being responsible for reducing oxidized proteins, including peroxiredoxin (after hydrogen peroxide reduction). A 24-h exposure to AgNP and AgNP + Cd2+ hampered the antioxidant defense system (), also causing the downregulation of proteins involved in glutathione metabolism, including glutathione synthetase, glutathione-disulfide reductase, and glutathione S-transferase. Although AgNP and AgNP + Cd2+ exposures perturbed similar antioxidant defense proteins after a 24-h exposure, some proteins were downregulated to a greater extent in the AgNP + Cd2+ exposure (Supplementary Table 4). This may have contributed to the increase in ROS levels observed in the AgNP + Cd2+ experiment ().
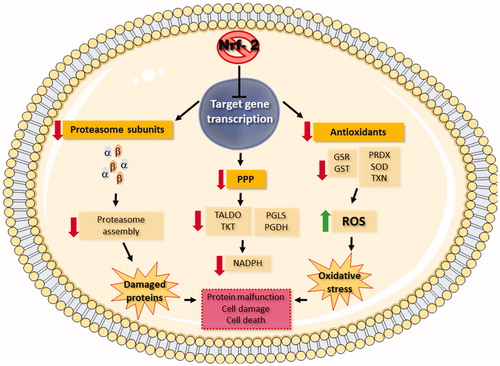
Nrf2 is a transcription factor that binds to the promoter region of antioxidant response elements of target genes and plays a role in cellular redox homeostasis (de Vries et al. Citation2008; Vriend and Reiter Citation2015). Under homeostatic conditions, Nrf2 is repressed by its negative regulator, KEAP1. When the intracellular environment becomes more oxidant, however, this complex dissociates and Nrf2 translocates into the nucleus, promoting the transcription of antioxidant defense-related genes (Itoh et al. Citation2003). The inactivation of Nrf2 was observed following exposure to AgNP and AgNP + Cd2+ (), and the Nrf2 canonical pathway was significantly affected by all test contaminants (), resulting in the downregulation of antioxidant defense proteins and, consequently, increased ROS levels. In addition to the antioxidant proteins, Nrf2 also regulates genes whose products are involved in the pentose phosphate pathway (PPP) (Mitsuishi et al. Citation2012). PPP generates ribose 5-phosphate, a substrate for nucleotide synthesis, and the reducing agent NADPH, which is necessary for recycling reduced glutathione. Therefore, Nrf2 inactivation in cells exposed to AgNP or AgNP + Cd2+ for 24 h may have been the cause of significant downregulation observed for PPP key enzymes (Supplementary Table 5), contributing to the high ROS levels that accumulated in these groups ().
Nrf2 also regulates the expression of proteasome subunit genes, which contribute to the removal of damaged proteins following oxidative insult (Chapple Siow, and Mann Citation2012; Lee et al. Citation2012). Moreover, the proteasome is involved in degradation of cellular proteins, regulating multiple cellular processes (Glickman and Ciechanover Citation2002). Therefore, inactivation of Nrf2 may also downregulate proteasome subunits after exposure to AgNP and, to a greater extent, to AgNP + Cd2+ (; Supplementary Table 6). This resulted in a significant alteration of protein ubiquitination () and, possibly, in increased toxicity. displays a schematic summary of Nrf2 downstream effects after a 24-h exposure to AgNP + Cd2+.
Figure 8. Principal outcomes of Nrf2 inactivation in HepG2 cells after a 24-h co-exposure to silver nanoparticles and cadmium (AgNP + Cd2+). Inhibition of Nrf2 prevented transcription of target genes, resulting in the downregulation of antioxidant defense proteins, pentose phosphate pathway (PPP) enzymes, and proteasome subunits (red arrows).
Changes in the protein ubiquitination canonical pathway () following the downregulation of ubiquitin, chaperone proteins, heat shock proteins, and thioredoxins (Supplementary Table 7) may have contributed to the effects observed, as proteins may not have been tagged for degradation in the proteasomes or repaired after exposure to AgNP + Cd2+.
Co-exposure to AgNP and Cd2+ deregulates mRNA translation-related proteins
Attenuation of mRNA translation, via phosphorylation of eIF2, is an initial cellular response to a wide range of stressors, including nutrient deprivation and accumulation of misfolded proteins. In this manner, cells conserve resources while a new gene expression program is adopted to prevent further damage (Baird and Wek Citation2012; Donnelly et al. Citation2013). The eIF2 canonical pathway was significantly altered after the 24-h exposures to AgNP and Cd2+ (), owing to the downregulation of ribosome subunits and proteins involved in translation initiation (; Supplementary Table 8). A different outcome, however, was observed following the combined exposure (AgNP + Cd2+). Although downregulation of ribosomal proteins and proteins involved in translation initiation also occurred, higher numbers of these proteins were upregulated ()); Supplementary Table 8). Moreover, more upregulated than downregulated proteins were observed (). Cells co-exposed to several contaminants may activate transcription and translation of key proteins in response to cellular stress. In particular, we observed upregulation of proteins normally required for reestablishment of energy status, such as those involved in oxidative phosphorylation, mitochondrial functioning, and lipid metabolism, although this response was not sufficient to avoid or attenuate an abnormal ADP/ATP imbalance and cell death ( and ). Deregulation of this pathway may have also resulted in reduced levels of proteins involved in antioxidant defense, proteasome activity, and protein repair, as discussed above.
Co-exposure to AgNP and Cd2+ induces metabolic adaptation in HepG2 cells
Cancer cell lines are metabolically adapted for rapid growth under hypoxic and acidic conditions, using glycolysis as the main biochemical pathway to synthesize ATP (Warburg effect) even in the presence of oxygen and functional mitochondria (Rodríguez-Enríquez et al. Citation2001; Liberti and Locasale Citation2016). HepG2 cells can utilize different routes of energy conversion, allowing them to employ glycolysis alongside oxidative phosphorylation (Kamalian et al. Citation2015).
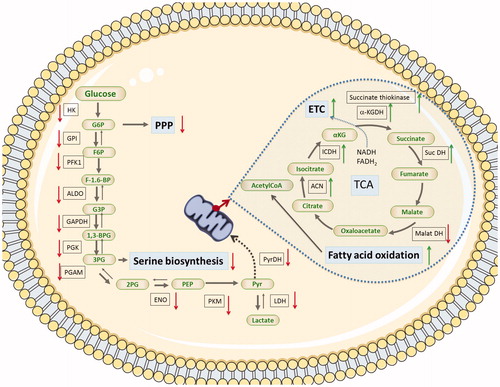
Downregulation of proteins involved in glycolysis (; Supplementary Table 9) may have resulted in the ADP/ATP ratio imbalance observed after exposure to AgNP + Cd2+, despite the upregulation of proteins related to oxidative phosphorylation (; Supplementary Table 10). The less-toxic exposure to AgNP led only to minor ADP/ATP imbalance, even though downregulation of glycolytic proteins occurred in both groups.
Figure 9. Changes in HepG2 cellular energy metabolism after a 24-h co-exposure to silver nanoparticles and cadmium (AgNP + Cd2+). Co-exposure resulted in downregulation (red arrows) of glycolytic proteins and upregulation (green arrows) of oxidative phosphorylation and lipid metabolism proteins.
A 24-h exposure to AgNP + Cd2+, but not to AgNP, resulted in a decrease in MTT metabolism (), a process that depends on the activity of cellular dehydrogenases, including mitochondrial succinate dehydrogenase. It is, therefore, possible that unaltered succinate dehydrogenase activity (as observed in the AgNP group) maintains the ADP/ATP balance.
In hepatocytes and HepG2 cells, under ideal nutritional conditions, ATP production occurs mainly through glucose oxidation (Iyer et al. Citation2010). Under conditions of nutrient deprivation, however, fatty acids can be oxidized to obtain ATP, through β-oxidation and the tricarboxylic acid cycle (Houten and Wanders Citation2010; Iyer et al. Citation2010; Carracedo, Cantley, and Pandolfi Citation2013). Lipid metabolism-related proteins were upregulated after exposure to AgNP + Cd2+ (; Supplementary Table 11), suggesting that the cells may have used an alternative nutrient to supply the metabolic demand, such as the lipids present in the FBS-enriched culture medium.
Peroxisome proliferator-activated receptor gamma coactivator 1-α (PPARGC1A) and bile acid receptor (NR1H4 or FXR) increase transcriptional activity of the nuclear receptor PPARγ, resulting in metabolic adaptation in response to nutrient deprivation, by inducing expression of genes related to glucose and lipid homeostasis (Mukherjee et al. Citation1997; Pineda Torra et al. Citation2003). These co-factors were activated in the cells exposed to AgNP + Cd2+ for 24 h (), suggesting that co-exposure to AgNP and Cd2+ can result in metabolic adaptation. Activation of the β-oxidation regulator carnitine O-palmitoyltransferase 1 (CPT1C) (Rinaldi et al. Citation2015) and inactivation of NR1I2, an inhibitor of β-oxidation (Moreau et al. Citation2008), were also observed (). In addition, canonical pathway analysis suggested that glycolysis and gluconeogenesis in the AgNP- and AgNP + Cd2+-exposed cells were altered, following downregulation of proteins related to these pathways (). Taken together, these data support the hypothesis that co-exposure to AgNP and Cd2+ induces a metabolic adaptation in HepG2 cells. Even so, the ADP/ATP ratio remained perturbed in cells exposed to AgNP + Cd2+. As mentioned earlier, a 24-h exposure to AgNP + Cd2+ resulted in a decrease in succinate dehydrogenase activity. Therefore, it is possible that metabolites produced by β-oxidation and the tricarboxylic acid cycle (NADH, FADH2, and acetyl-CoA) were not efficiently used by the mitochondrial respiratory chain to restore ADP/ATP homeostasis.
Conclusions
Our results provide information about the toxicological interaction of AgNP and Cd ions in HepG2 cells, as well as some insights into the possible underlying toxicity mechanisms. Co-exposure for 24 h to AgNP and Cd2+ induced, in general, more toxic responses than individual exposures to AgNP or Cd2+. The total proteome profile of HepG2 cells changed substantially after 24 h of exposure to AgNP + Cd2+. The increased levels of oxidative stress may have been the result of downregulation of reducing agents and the antioxidant defense system following inhibition of Nrf2 activity, which may also have played a role in downregulating proteasome subunits. Another hallmark of the toxicity induced by AgNP + Cd2+ was the upregulation of oxidative phosphorylation and lipid metabolism-related proteins, suggesting that a metabolic adaptation occurred, as HepG2 cells usually produce ATP mainly by glycolysis, and alternative nutrients, such as lipids, may have been recruited to reestablish a homeostatic ADP/ATP ratio. While cells exposed to AgNP or Cd2+ exhibited downregulation of translation-related proteins, cells co-exposed to both were characterized by both upregulation and downregulation of these proteins, resulting in a notable alteration of the eIF2 canonical pathway. This may have resulted in the downregulation of glycolytic, antioxidant, and proteasome proteins, triggering metabolic adaptation, although the adaptation was not sufficient to restore ADP/ATP homeostasis and avoid cell death.
SUPPLEMENTARY TABLE 3
Download MS Excel (200.9 KB)SUPPLEMENTARY TABLE 2
Download MS Excel (21 KB)SULPLEMENTARY TABLE 1
Download MS Excel (594.8 KB)Supplementary Figures 1-3 and Tables 4-11
Download MS Word (111.6 KB)Disclosure statement
No potential conflict of interest was reported by the authors.
Additional information
Funding
References
- Arbuckle, T. E., C. L. Liang, A.-S. Morisset, M. Fisher, H. Weiler, C. M. Cirtiu, M. Legrand, K. Davis, A. S. Ettinger, and W. D. Fraser. 2016. “Maternal and Fetal Exposure to Cadmium, Lead, Manganese and Mercury: The MIREC Study.” Chemosphere 163: 270–282. doi:10.1016/j.chemosphere.2016.08.023.
- Baird, T., and R. Wek. 2012. “Eukaryotic Initiation Factor 2 Phosphorylation and Translational Control in Metabolism.” Advances in Nutrition 3 (3): 307–321. doi:10.3945/an.112.002113.
- Capaldo, A., F. Gay, R. Scudiero, F. Trinchella, I. Caputo, M. Lepretti, A. Marabotti, C. Esposito, and V. Laforgia. 2016. “Histological Changes, Apoptosis and Metallothionein Levels in Triturus Carnifex (Amphibia, Urodela) Exposed to Environmental Cadmium Concentrations.” Aquatic Toxicology 173: 63–73. doi:10.1016/j.aquatox.2016.01.009.
- Carracedo, A., L. C. Cantley, and P. P. Pandolfi. 2013. “Cancer Metabolism: Fatty Acid Oxidation in the Limelight.” Nature Reviews Cancer 13 (4): 227–232. doi:10.1038/nrc3483.
- Chapple, S. J., R. C. M. Siow, and G. E. Mann. 2012. “Crosstalk between Nrf2 and the Proteasome: Therapeutic Potential of Nrf2 Inducers in Vascular Disease and Aging.” International Journal of Biochemistry and Cell Biology 44 (8): 1315–1320. doi:10.1016/j.biocel.2012.04.021.
- Cleveland, D., S. E. Long, P. L. Pennington, E. Cooper, M. H. Fulton, G. I. Scott, T. Brewer, J. Davis, E. J. Petersen, and L. Wood. 2012. “Pilot Estuarine Mesocosm Study on the Environmental Fate of Silver Nanomaterials Leached from Consumer Products.” Science of the Total Environment 421–422: 267–272. doi:10.1016/j.scitotenv.2012.01.025.
- Cuypers, A., Plusquin, M., Remans, T. Jozefczak, M. Keunen, E. Gielen, H. Opdenakker, K. Nair, A. R. Munters, E. Artois. T. J., et al.. 2010. “Cadmium Stress: An Oxidative Challenge.” Biometals 23 (5): 927–940. doi:10.1007/s10534-010-9329-x.
- de Vries, H. E., M. Witte, D. Hondius, A. J. Rozemuller, B. Drukarch, J. Hoozemans, and J. van Horssen. 2008. “Nrf2-Induced Antioxidant Protection: A Promising Target to Counteract ROS-Mediated Damage in Neurodegenerative Disease?.” Free Radical Biology and Medicine 45 (10): 1375–1383. doi:10.1016/j.freeradbiomed.2008.09.001.
- Della Torre, C., T. Balbi, G. Grassi, G. Frenzilli, M. Bernardeschi, A. Smerilli, P. Guidi, L. Canesi, M. Nigro, F. Monaci, et al. 2015. “Titanium Dioxide Nanoparticles Modulate the Toxicological Response to Cadmium in the Gills of Mytilus Galloprovincialis.” Journal of Hazardous Materials 297: 92–100. doi:10.1016/j.jhazmat.2015.04.072.
- Deville, S., B. Baré, J. Piella, K. Tirez, P. Hoet, M. P. Monopoli, K. A. Dawson, V. F. Puntes, and I. Nelissen. 2016. “Interaction of Gold Nanoparticles and Nickel(II) Sulfate Affects Dendritic Cell Maturation.” Nanotoxicology 10 (10): 1395–1403. doi:10.1080/17435390.2016.1221476.
- Donnelly, N., A. M. Gorman, S. Gupta, and A. Samali. 2013. “The eIF2α kinases: Their Structures and functions.” Cellular and Molecular Life Sciences 70 (19): 3493–3511. doi:10.1007/s00018-012-1252-6.
- Ferreira, J. L., M. N. Lonné, T. A. França, N. R. Maximilla, T. H. Lugokenski, P. G. Costa, G. Fillmann, F. A. Antunes Soares, F. R. de la Torre, J. M. Monserrat. 2014. “Co-Exposure of the Organic Nanomaterial Fullerene C60 with Benzo[a]Pyrene in Danio rerio (Zebrafish) Hepatocytes: Evidence of Toxicological Interactions.” Aquatic Toxicology 147: 76–83. doi:10.1016/j.aquatox.2013.12.007.
- Franceschini, A., D. Szklarczyk, S. Frankild, M. Kuhn, M. Simonovic, A. Roth, J. Lin, P. Minguez, P. Bork, C. Von Mering, and L. J. Jensen. 2013. “STRING v9.1: Protein-Protein Interaction Networks, with Increased Coverage and Integration.” Nucleic Acids Research 41 (D1): D808–D815. doi:10.1093/nar/gks1094.
- Furman, O., S. Usenko, and B. L. T. Lau. 2013. “Relative Importance of the Humic and Fulvic Fractions of Natural Organic Matter in the Aggregation and Deposition of Silver Nanoparticles.” Environmental Science & Technology 47 (3): 1349–1356. doi:10.1021/es303275g.
- Glickman, M. H., and A. Ciechanover. 2002. “The Ubiquitin-Proteasome Proteolytic Pathway: Destruction for the Sake of Construction.” Physiological Reviews 82 (2): 373–428. doi:10.1152/physrev.00027.2001.
- Gliga, A. R., S. Skoglund, I. O. Wallinder, B. Fadeel, and H. L. Karlsson. 2014. “Size-Dependent Cytotoxicity of Silver Nanoparticles in Human Lung Cells: The Role of Cellular Uptake, Agglomeration and Ag Release.” Particle and Fibre Toxicology 11 (1): 11. doi:10.1186/1743-8977-11-11.
- Goldoni, M., and C. Johansson. 2007. “A Mathematical Approach to Study Combined Effects of Toxicants in Vitro: Evaluation of the Bliss Independence Criterion and the Loewe Additivity Model.” Toxicology in Vitro 21 (5): 759–769. doi:10.1016/j.tiv.2007.03.003.
- Govindasamy, R., and A. A. Rahuman. 2012. “Histopathological Studies and Oxidative Stress of Synthesized Silver Nanoparticles in Mozambique Tilapia (Oreochromis mossambicus).” Journal of Environmental Sciences 24 (6): 1091–1098.
- Guo, M., X. Xu, X. Yan, S. Wang, S. Gao, and S. Zhu. 2013. “In Vivo Biodistribution and Synergistic Toxicity of Silica Nanoparticles and Cadmium Chloride in Mice.” Journal of Hazardous Materials 260: 780–788. doi:10.1016/j.jhazmat.2013.06.040.
- Han, X., R. Gelein, N. Corson, P. Wade-Mercer, J. Jiang, P. Biswas, J. N. Finkelstein, A. Elder, and G. Oberdörster. 2011. “Validation of an LDH Assay for Assessing Nanoparticle Toxicity.” Toxicology 287 (1–3): 99–104. doi:10.1016/j.tox.2011.06.011.
- Holmström, K. M., and T. Finkel. 2014. “Cellular Mechanisms and Physiological Consequences of Redox-Dependent Signalling.” Nature Reviews Molecular Cell Biology 15 (6): 411–421. doi:10.1038/nrm3801.
- Houten, S. M., and R. J. A. Wanders. 2010. “A General Introduction to the Biochemistry of Mitochondrial Fatty Acid β -Oxidation.” Journal of Inherited Metabolic Disease 33 (5): 469–477.
- Itoh, K., N. Wakabayashi, Y. Katoh, T. Ishii, T. O'Connor, and M. Yamamoto. 2003. “Keap1 Regulates Both Cytoplasmic-Nuclear Shuttling and Degradation of Nrf2 in Response to Electrophiles.” Genes to Cells 8 (4): 379–391.
- Iyer, V. V., H. Yang, M. G. Ierapetritou, and C. M. Roth. 2010. “Effects of Glucose and Insulin on HepG2-C3A Cell Metabolism.” Biotechnology and Bioengineering 107 (2): 347–356. doi:10.1002/bit.22799.
- Kamalian, L., A. E. Chadwick, M. Bayliss, N. S. French, M. Monshouwer, J. Snoeys, and B. K. Park. 2015. “The Utility of HepG2 Cells to Identify Direct Mitochondrial Dysfunction in the Absence of Cell Death.” Toxicology in Vitro 29 (4): 732–740. doi:10.1016/j.tiv.2015.02.011.
- Lee, S., E. Hur, G. I. G. Ryoo, K. A. Jung, J. Kwak and M. K. Kwak. 2012. “Involvement of the Nrf2-Proteasome Pathway in the Endoplasmic Reticulum Stress Response in Pancreatic??-Cells.” Toxicology and Applied Pharmacology 264 (3): 431–438. doi:10.1016/j.taap.2012.08.021.
- Liberti, M. V., and J. W. Locasale. 2016. “The Warburg Effect: How Does It Benefit Cancer Cells?.” Trends in Biochemical Sciences 41 (3): 211–218. doi:10.1016/j.tibs.2015.12.001.
- Maurer-Jones, M. A., I. L. Gunsolus, C. J. Murphy, and C. L. Haynes. 2013. “Toxicity of Engineered Nanoparticles in the Environment.” Analytical Chemistry 85 (6): 3036–3049. doi:10.1021/ac303636s.
- Miranda, R. R., A. G. Bezerra, C. A. O. Ribeiro, M. A. F. Randi, C. L. Voigt, L. Skytte, K. L. Rasmussen, F. Kjeldsen, and F. F. Neto. 2017. “Toxicological Interactions of Silver Nanoparticles and Non-Essential Metals in Human Hepatocarcinoma Cell Line.” Toxicology in Vitro 40: 134–143. doi:10.1016/j.tiv.2017.01.003.
- Mitsuishi, Y., K. Taguchi, Y. Kawatani, T. Shibata, T. Nukiwa, H. Aburatani, M. Yamamoto, and H. Motohashi. 2012. “Nrf2 Redirects Glucose and Glutamine into Anabolic Pathways in Metabolic Reprogramming.” Cancer Cell 22 (1): 66–79.
- Moreau, A., M. J. Vilarem, P. Maurel, and J. M. Pascussi. 2008. “Xenoreceptors CAR and PXR Activation and Consequences on Lipid Metabolism, Glucose Homeostasis, and Inflammatory Response.” Molecular Pharmaceutics 5 (1): 35–41. doi:10.1021/mp700103m.
- Mukherjee, R., L. Jow, G. E. Croston, and J. R. Paterniti. 1997. “Identification, Characterization, and Tissue Distribution of Human Peroxisome Proliferator-Activated Receptor (PPAR) Isoforms PPARgamma2 versus PPARgamma1 and Activation with Retinoid X Receptor Agonists and Antagonists.” The Journal of Biological Chemistry 272 (12): 8071–8076.
- Navarro, E., F. Piccapietra, B. Wagner, F. Marconi, R. Kaegi, N. Odzak, L. Sigg, and R. Behra. 2008. “Toxicity of Silver Nanoparticles to Chlamydomonas reinhardtii.” Environmental Science & Technology 42 (23): 8959–8964. doi:10.1021/es801785m.
- Pineda Torra, I., T. Claudel, C. Duval, V. Kosykh, J.-C. Fruchart, and B. Staels. 2003. “Bile Acids Induce the Expression of the Human Peroxisome Proliferator-Activated Receptor α Gene via Activation of the Farnesoid X Receptor.” Molecular Endocrinology 17 (2): 259–272. doi:10.1210/me.2002-0120.
- Rinaldi, C., T. Schmidt, A. J. Situ, J. O. Johnson, P. R. Lee, K.-L. Chen, L. C. Bott, R. Fadó, G. H. Harmison, S. Parodi, et al. 2015. “Mutation in CPT1C Associated with Pure Autosomal Dominant Spastic Paraplegia.” JAMA Neurology 72 (5): 561–570. doi:10.1001/jamaneurol.2014.4769.
- Rodríguez-Enríquez, S., O. Juárez, J. S. Rodríguez-Zavala, and R. Moreno-Sánchez. 2001. “Multisite Control of the Crabtree Effect in Ascites Hepatoma Cells.” European Journal of Biochemistry 268 (8): 2512–2519.
- Schwämmle, V., I. R. León, and O. N. Jensen. 2013. “Assessment and Improvement of Statistical Tools for Comparative Proteomics Analysis of Sparse Data Sets with Few Experimental Replicates.” Journal of Proteome Research 12 (9): 3874–3883. doi:10.1021/pr400045u.
- Taverner, T., Y. V. Karpievitch, A. D. Polpitiya, J. N. Brown, A. R. Dabney, G. A. Anderson, and R. D. Smith. 2012. “DanteR: An Extensible R-Based Tool for Quantitative Analysis of -Omics Data.” Bioinformatics (Oxford, England) 28 (18): 2404–2406.
- Vance, M. E., T. Kuiken, E. P. Vejerano, S. P. McGinnis, M. F. Hochella, D. Rejeski, and M. S. Hull. 2015. “Nanotechnology in the Real World: Redeveloping the Nanomaterial Consumer Products Inventory.” Beilstein Journal of Nanotechnology 6: 1769–1780. doi:10.3762/bjnano.6.181.
- Vriend, J., and R. J. Reiter. 2015. “The Keap1-Nrf2-Antioxidant Response Element Pathway: A Review of Its Regulation by Melatonin and the Proteasome.” Molecular and Cellular Endocrinology 401: 213–220. doi:10.1016/j.mce.2014.12.013.
- Wildt, B. E., A. Celedon, E. I. Maurer, B. J. Casey, A. M. Nagy, S. M. Hussain, and P. L. Goering. 2016. “Intracellular Accumulation and Dissolution of Silver Nanoparticles in L-929 Fibroblast Cells Using Live Cell Time-Lapse Microscopy.” Nanotoxicology 10 (6): 710. doi:10.3109/17435390.2015.1113321.
- Zhang, C., Z. Hu, and B. Deng. 2016. “Silver Nanoparticles in Aquatic Environments: Physiochemical Behavior and Antimicrobial Mechanisms.” Water Research 88: 403–427. doi:10.1016/j.watres.2015.10.025.