
Abstract
Silver nanoparticles (AgNPs) have been reported to penetrate the central nervous system (CNS) and induce neurotoxicity. However, there is a paucity of understanding of the toxicity of AgNPs and their effect on the blood-brain barrier (BBB) including the underlying molecular mechanism(s) of action. Such information is important for the formulation of new strategies for delivery of biological therapeutics to central nervous system (CNS) targets. Using an in vitro BBB model and mass spectrometry-based proteomics, we investigated alterations in the proteomes of brain endothelial cells and astrocytes at different time points after AgNPs exposure (24 and 48 h). Our data showed that several proteins involved in neurodisorders and neurodegeneration were significantly upregulated in endothelial cells (e.g. 7-dehydrocholesterol reductase, zinc transporters 1 and 6), while proteins responsible for maintaining brain homeostasis were significantly downregulated (e.g anti-oxidative proteins glutathione peroxidase 1 and glutathione peroxidase 4). Many inflammatory pathways were significantly upregulated at 24 h post-AgNPs exposure (C9 pathway), while at 48 h proteins involved in BBB damage and anti-inflammatory responses were upregulated (quinoneoxidoreductase1 and glutamate cysteine ligase catalytic subunit) suggesting that by the later time point, cellular protection pathways had been activated to rescue the cells from AgNPs-induced toxicity. Our study suggests that in the initial stage of exposure, AgNPs exerted direct cellular stress on the endothelial cells by triggering a pro-inflammatory cascade. This study provides detailed insight into the toxic potency of AgNPs on in vitro BBB model and adds to the understanding of the adaptive role of BBB with regards to AgNPs-mediated toxicity.
1. Introduction
Nanotechnology is generally regarded as a rapidly growing field involving biotechnology and nanomaterials with diverse applications at the nanometer scale (Chen and Schluesener Citation2008). Nanomaterials are designed to exhibit unique properties with advantages in fields such as biomedical, optical, electronic engineering and manufacturing. Materials at the nanoscale levels exhibit increased structural integrity as well as unique properties, which make them desirable for commercial or medical applications(Bouwmeester et al. Citation2009; Tolaymat et al. Citation2010; Rai, Yadav, and Gade Citation2009).
The unique property of nanoparticles is due to their relatively large surface area and high fraction of surface atoms resulting in increased in vivo activity (Lara et al. Citation2011; Xu et al. Citation2015; AshaRani et al. Citation2009). Silver nanoparticles (AgNPs) are by far the most frequently used nanomaterial in consumer products and medicine due to their potent antimicrobial properties. In vitro studies have found low toxic potential of AgNPs towards mammalian cells (Bouwmeester et al. Citation2009; Tolaymat et al. Citation2010; Rai, Yadav, and Gade Citation2009; Ahamed, Alsalhi, and Siddiqui Citation2010; Chen and Schluesener Citation2008). However, despite their widespread usage, there are many concerns regarding the effects of long-term exposure to AgNPs (Christensen et al. Citation2010; Sharma Citation2009). Although the applications and benefits of these engineered nanomaterials have been studied extensively (Hoet, Bruske-Hohlfeld, and Salata Citation2004; Thomas and Sayre Citation2005), numerous studies have demonstrated that these metallic nanoparticles may have potentially adverse impacts on the environment and health safety (Maynard Citation2014; Ahamed, Alsalhi, and Siddiqui Citation2010; Rahman et al. Citation2009; Sharma Citation2009; Verano-Braga et al. Citation2014). The impact of these metallic nanoparticles on human health needs attention by the research community and various techniques, including quantitative proteomics and advanced microscopy, have been applied to assess their impact (Verano-Braga et al. Citation2014).
The blood-brain barrier (BBB) separates the blood from the brain interstitial fluid and is created and maintained primarily by capillary endothelial cells which line the inner walls of microvessels in the central nervous system. These capillary endothelial cells, surrounded by astrocyte cell projections called astrocytic feet providing biochemical support, are tightly connected by tight junctions that protect the brain by exhibiting barrier-like characteristics, thus tightly regulating the flow of molecules across the sheets of endothelial cells (Thomsen, Burkhart, and Moos Citation2015). It has been reported that frequent exposure to AgNPs from products and from the environment leads to an accumulation of AgNPs in the body and subsequently in the brain after crossing the BBB (Tang et al. Citation2009, Citation2010). On the other hand, a few studies have raised doubt about the potential of AgNPs to cross the BBB and concluded that AgNPs-induced neurotoxicological effects may occur via secondary molecules e.g. silver ions, released from the AgNPs present in the periphery (Hadrup and Lam Citation2014; Mirsattari et al. Citation2004). In vitro studies on various mammalian cells report that AgNPs induce major cytotoxic actions leading to increased cellular apoptosis and cell death (Miethling-Graff et al. Citation2014; Verano-Braga et al. Citation2014; Miranda et al. Citation2018). Other cellular responses, including changes in minor metabolic pathways and protein post-translational modifications, remain largely uninvestigated and may reveal novel actions of nanoparticle toxicity. With respect to AgNPs-induced neurotoxicity, morphological and histochemical investigations on rat brains have shown that AgNPs injected into the systemic blood supply can lead to enhanced cellular dysfunction, changes in astrocyte morphology, increased neuronal inflammation and degeneration with or without increased BBB permeability (Sharma et al. Citation2009b, Citation2009a; Dan et al. Citation2018). However, a comprehensive understanding of how AgNPs induce BBB failure and toxicity at the cellular and molecular levels remains largely unexplored. In this context, it is important to know any consequences of human exposure to AgNPs, and the nature of any molecular mechanisms that might be activated in the presence of these nanoparticles. The present study aims at analyzing the effects of AgNPs exposure on an in vitro model of the BBB. This model is comprised of human brain cerebral microvascular endothelial cells (hCMEC/D3) and human astrocytes (HA) growing as static model. We exposed the in vitro BBB to well characterized AgNPs (50 nm) and the cellular responses of the in vitro BBB were evaluated using quantitative proteomics and transmission electron microscopy (TEM) in a time-course experiment.
2. Materials and methods
2.1. Reagents
Trypsin was obtained from Promega (Fitchburg, MI). The TMT 10-plex reagents were purchased from ThermoFisher Scientific (USA). Ammonia solution (25%) was bought from Merck (Darmstadt, Germany). Tris buffer was obtained from Plus One, GE Healthcare (Denmark). dl-dithiothreitol (DTT), urea, iodoacetamide (IAA), and triethylammonium bicarbonate buffer (TEAB) were obtained from Sigma (Germany). AgNPs, polyvinyl pyrolidone (PVP)-stabilized 50 nm nominal diameter, NanoXactTM (aqueous suspension, 0.02 mg/mL) were purchased from Nanocomposix (USA). The plastic disposable cuvettes were obtained from VWR (Denmark). Formvar/carbon-coated copper grids, 300 mesh, were supplied by Electron Microscopy Sciences (USA). Immortalized human brain capillary endothelial cell line (hCMEC/D3) was purchased from Millipore (USA). Primary astrocytes were purchased from ScienCell (USA). EndoGRO-MV Complete Media kit supplemented with fibroblast growth factor was obtained from Millipore (USA, Cat no: SCME004 and GF003AF-MG). Astrocyte Medium was purchased from Gibco (Thermofisher Scientific, USA). Rabbit polyclonal antibody against Claudin-5 – # ab15106 was bought from Abcam, UK; Mouse monoclonal antibody against ZO-1– # 33-9100 was purchased from Thermofisher Scientific, USA; Goat anti mouse conjugated to Alexa Fluor® 568– # A11004 was purchased from Lifetechnologies, USA; Goat anti rabbit conjugated to Alexa Fluor® 488– # Abcam150077 was purchased from Abcam, UK;. Transwell inserts for the in vitro BBB formation were purchased from Corning lifesciences (USA).
2.2. Protein corona formation
Nanoparticles (NP) were incubated in human plasma for 2 h at 4 °C and the resulting NP-protein complexes were washed 3 times in PBS by centrifugation (10 000 rcf, 10 min) in order to remove excess plasma from the sample. After washing, nanoparticles were resuspended in EndoGRO™ Media at the stock concentration (0.02 mg/mL) and stored at 4 °C until use.
2.3. Dynamic light scattering (DLS)
Suspensions of nanoparticles (both bare and precoated with protein corona) at 0.02 mg/mL in Milli Q water were sonicated for 5 min and then transferred into the plastic disposable cuvettes. The DLS measurements were performed using DelsaMax Pro core (Beckman Coulter, USA). To investigate the stability and zeta potential of AgNPs in the exposure culture media, AgNPs were incubated in the exposure culture media used for the hCMEC/D3 for 24 h and 48 h time points. The measurements were done by using_DelsaMax Pro (Beckman Coulter, USA) and performed in triplicate using 1 mL of each suspension at room temperature.
2.4. Viability assay (MTS)
Cell viability was determined using MTS [3-(4, 5-dimethylthiazol-2-yl)-5-(3-carboxymethoxyphenyl)-2-(4-sulfophenyl)-2H-tetrazolium, inner salt] assay with a CellTiter 96 Aqueous One Solution Cell Proliferation Assay kit (Promega, Madison, WI) according to the manufacturer’s instructions. (Yan et al. Citation2018) After exposure to AgNPs (24 h and 48 h), cells were washed three times in PBS and the MTS reagent was added in HBSS buffer (20 μl and 100 µl, respectively) to wells. Cells were then incubated for 30 min at 37 °C. The absorbance reading was done at 490 nm using a FLUOstar Omega plate reader (Germany).
2.5. Quantification of Ag+ and AgNPs in the exposure culture media by ICP-MS
Quantification of Ag+ and AgNPs was done by inductively coupled plasma mass spectrometry-ICP-MS (Bruker820-MS + SPS 3 autosampler). AgNPs (10 μg/ml) were incubated in the exposure culture media for 24 and 48 h prior to analysis. After the incubation the samples were centrifuged at 10 000 g for 10 min and supernatants were analyzed to assess the dissolved AgNPs compared to the total amount. 200 μl HNO3 and 100 μl H2O2 (both ICP-MS grade) were added to the samples. ICP-MS grad HCl was added to the samples to remove excess H2O2 and samples were left to react overnight prior to ICP-MS.
2.6. Cell cultures
hCMEC/D3 cells were grown in EndoGRO-MV Complete media kit supplemented with FGF-2 (Fibroblast growth factor-2) at 1 ng/mL concentration. Human primary astrocytes were cultured in Gibco astrocyte medium supplemented with N2 supplement and fetal bovine serum (FBS) (10% v/v). Cells were grown at T-75 culture flasks precoated for 1 h at 37 °C with rat tail collagen type I (219 μg/ml) and poly-l-lysine (15 μg/ml) for hCMEC/D3 and astrocytes, respectively. Both cell lines were cultured at 37 °C, 5% CO2 and passaged according to the suppliers’ protocols. hCMEC/D3 cells were used in experiments at passage numbers from 25 to 32, while astrocytes were used at passage numbers from 2 to 5, as recommended by the suppliers. Four biological replicates per condition and two time points were used to study the time-dependent consequences of AgNPs exposure to the cells. For every time point studied, controls were included with no exposure to AgNPs.
2.7. Establishment of the in vitro BBB model
An in vitro BBB model based on contact co-cultures was established as previously reported with slight modifications in the cell seeding numbers (Daniels et al. Citation2013). Briefly, astrocytes were seeded at a density of 6.0 × 10³ cells/cm2 on the basal side of Transwell membrane filters which had been precoated with poly l-lysine (15 μg/ml) on the basal side. The astrocytes were allowed to attach for 24 h. Then, hCMEM/D3 cells were seeded to the apical side of the filters, which had been precoated with collagen type 1 (219 μg/ml) on that side. The cell seeding density for hCMEM/D3 cells was 104 cells/cm2. In order to allow for formation of tight junctions, the co-cultures were maintained for 8 days at 37 °C, 5% CO2. Depending on the experiment, different tissue culture formats with the polycarbonate-based Transwell inserts were used.
2.8. Immunofluorescence
Blood brain barrier detection was done using immunofluorescence staining protein ZO-1 and claudin-5. The co-culture were grown in 12-well tissue culture Transwell inserts from Corning (polycarbonate (PC) coated with rat-tail collagen type I (apical side) and poly-l-lysine (basal side). Staining was done with or without AgNPs treatment. Cells were washed in ice cold PBS and fixed with 4% formaldehyde for 15 min. This was followed by three PBS washes. Fixed cells were blocked with 3% goat serum in PBS (blocking buffer) at room temperature (RT) for 45 min and incubated overnight at 4 °C with mouse monoclonal primary antibody prepared in blocking buffer (1:100). The following day, cells were again washed with PBS and incubated for 1 h at RT with Alexa Fluor® 568 conjugated goat anti-mouse secondary antibody (1:1000). Thereafter, cells were rinsed, dried and mounted with DAPI in prolonged gold anti-fade mounting media (Invitrogen). Mounted slides were visualized with nikon-andor spinning disk confocal microscope after overnight drying. Cell stained with only secondary antibodies served as negative control.
2.9. Transepithelial/transendothelial electrical resistance measurements
For transepithelial/transendothelial electrical resistance (TEER) measurements, co-cultures were grown in 6-well tissue culture Transwell inserts from Corning (polycarbonate (PC) coated with rat-tail collagen type I (apical side) and poly-l- lysine (basal side). Measurements were done manually every 2–3 days and after AgNPs incubation for 24 h and 48 h, using an epithelial voltohmmeter (EVOM) coupled to an Endohm-6 measurement chamber (World Precision Instruments, USA). The equipment was calibrated prior to use. All measurements were done in a sterile environment. For each experiment, at least 2 replicates were measured. The electrodes were rinsed with culture medium and inserted into both Transwell chambers. Results were corrected against Transwell inserts without cells, and the resistance was multiplied by the effective surface area of the filter membrane (Srinivasan et al. Citation2015).
The cell-specific resistance (RTISSUE), in units of Ω, can be obtained as: RTISSUE(Ω) = RTOTAL − RBLANK. The final TEER measurement is reported as in the following: TEERREPORTED = RTISSUE (Ω)× Membrane (M)AREA(cm2). Results are expressed as means ± S.E.M.
2.10. Intracellular trafficking of AgNPs visualized with transmission electron microscopy (TEM)
After AgNPs treatment for 24 h and 48 h, the endothelial cells and astrocytes were visualized with TEM (Hejbol et al. Citation2017). The TEM experiments were done directly on the cells growing on both sides of the membrane. On the eighth and ninth day from the time of AgNPs exposure, 2% glutaraldehyde in 0.04 M phosphate buffer, pH 7.4 was used to fix the cells for 60 min at 20 °C. The cells were washed in 0.1 M phosphate buffer for 10 min and the membrane was then removed from the insert and cut into small pieces by scalpel.
The membrane pieces were post-fixed with 1% osmium tetroxide in 0.1 M phosphate buffer for 60 min at 4 °C, dehydrated through a graded series of alcohol and acetone at 4–20 °C, and embedded in Epon for 90 min at 20 °C. Ultra-thin sections were cut from the Epon block on a Leica Ultracut UCT ultramicrotome (USA), examined and photographed using JEM 1400 Plus microscope (JEOL, Germany) coupled to Quemesa digital camera (Olympus, UK). Images were acquired and processed using iTEM (Olympus, UK) and Fiji (NIH, USA) software.
2.11. BBB exposure to nanoparticles
AgNPs (10 µg/ml) were introduced into the apical chamber of the dish containing the BBB 8 days after initiation of the cell cultures. Co-cultures were then incubated with nanoparticles for 24 h and 48 h using appropriate controls (without nanoparticles) to study the effect of AgNPs exposure on the BBB. At the end of exposure, the medium was removed from both the sides of the membrane and cells were washed three times with cold PBS. Next, 1 mL of ice-cold PBS supplemented with phosphatase and protease inhibitors (ProtoSTOP and PhosSTOP, Roche, Switzerland) was added and both cell types were harvested using cell scrapers. Cell suspensions were transferred to 1.5 mL eppendorf tubes, centrifuged for 5 min at 600 g and the supernatant was discarded. Ice-cold PBS supplemented with phosphatase and protease inhibitors was added again to the cell pellets; cells were centrifuged for 5 min at 600 g and the pellets were frozen at −80 °C until further analysis.
2.12. Protein extraction and digestion
Protein extraction and digestion has been described previously (Jensen et al. Citation2017). Cell pellets were lysed and reduced in 6 M Urea, 2 M Thiourea, 10 mM TCEP, 20 mM triethylammonium bicarbonate (TEAB) (pH 8) supplemented with ProtoSTOP and PhosSTOP for 2 h at room temperature. The samples were diluted 10 times with 20 mM TEAB followed by sonication on ice to assist lysis. Protein concentrations were measured by amino acid analysis (AAA) as described previously (Laursen et al. Citation2008). 200 µg of proteins were alkylated in 20 mM iodoacetamide (IAA) for 40 min in the dark. Proteins were digested with trypsin (50:1 (w/w) protein: trypsin overnight at 25 °C with constant shaking. The reaction was quenched by adding formic acid to 5% concentration followed by centrifuge at 14 000 g for 15 min to separate peptides from debris. The pellet was discarded and the peptides were lyophilized in a speed-vac and quantified again by amino acid analyzer.
2.13. TMT 10-plex labeling, desalting and purification of samples
A total of 100 µg of tryptic peptides per sample were used for the TMT 10-plex labeling. The labeling was performed according to manufacturer's instructions. Labeled peptides of each experimental condition were mixed in equal quantities and dried down prior to desalting and purification. The purification and desalting of the digested peptides were done using the OASIS HLB column (Waters, USA) and the eluted peptides were lyophilized and subsequently resuspended in 0.1% formic acid.
2.14. High pH fractionation and reversed-phase nanoLC-ESI-MS/MS
The proteome samples were fractionated by high pH reverse-phase LC. An UltiMate 3000 LC system (Thermo Scientific, Germering, Germany) equipped with an Acquity CSH C18 column (300 µm × 100 mm, 1.7 µm) was employed for the fractionation. Peptides were eluted with a stepped gradient from 4% to 48% B with 2% steps height and 3 min step length, followed by 80% B step (phase A: 20 mM ammonium formate, adjusted to pH 9.6 by NH4OH; phase B: 80% acetonitrile 20% 20 mM ammonium formate, adjusted to pH 9.6 by NH4OH), and pooled into 8 fractions. High pH fractions were dried in a SpeedVac after adding 1 µL of dimethylsulfoxide and re-dissolved in 0.1% FA in water. Fractions were analyzed by LC-MS using a Q-Exactive HF mass spectrometer (Thermo Scientific, Bremen, Germany) coupled with UltiMate 3000 nanoflow LC system (Thermo Scientific, Germering, Germany). Samples were preconcentrated for 10 min on the trap column (µ-Precolumn C18 PepMap100, 5 µm, 300 µm i.d. × 5 mm, 100 Å, Thermo Scientific) at 2% B. Then peptides were eluted from the analytical column (EASY-Spray PepMap RSLC C18, 2 µm, 75 µm i.d. × 500 mm, 100 Å, Thermo Scientific) using the following gradient: 2–5% B in 5 min, 5–30% B in 93 min, 30–45% B in 14 min at a flow rate of 270 nL/min. The column was washed at 95% B for 10 min and equilibrated to the start concentration of mobile phase B. The analytical column and precolumn were heated to 50 °C. Mobile phases were as follows: (A) 0.1% FA in water; (B) 95% ACN, 0.1% FA in water.
Mass spectrometry measurements were performed using data-dependent acquisition (DDA) mode (Top 12). Electrospray high voltage was set to 2.0 kV. Electrospray capillary temperature was 275 °C. MS1 settings were as follows: mass range 300–1400 m/z, resolving power – 120 000 at m/z 200, maximum injection time was set to 100 ms, the automatic gain control (AGC) target for MS1 was 3.0e6, the dynamic exclusion was set to 30 s. Precursor ions were isolated using a m/z window of 1.4 Th followed by their fragmentation using higher-energy collision dissociation (HCD) with normalized collision energy (NCE) of 34. Fragment ions were measured with resolving power of 60 000 at m/z 200. Maximum injection time during MS/MS was 110 ms with AGC target value of 1.0e5.
2.15. Proteomics data analysis of MS/MS
Raw data files were processed using Thermo Proteome Discoverer 2.1.1.21 (Thermo Fisher Scientific). Database search against SwissProt human database (version 2017.01) was performed by Mascot (version 2.6) search engine. Trypsin was used as digestion enzymes, allowing up to two missed cleavage sites. A precursor mass tolerance of 10 ppm and a product ion mass tolerance of 0.02 Da were used. Fixed modifications included carbamidomethylation of cysteines. Dynamic modifications contained methionine oxidation, N-terminal acetylation, TMT 6-plex modification of N-termini and lysine. False discovery rates (FDR) were calculated using Percolator algorithm (q-value < 0.01) on PSM and peptide levels. Proteins were filtered to 0.01 FDR using a target-decoy approach. Reporter ion intensities were log2-transformed and normalized in each channel using the median. The R Rollup function from Inferno RDN package was used to build protein intensities from peptides.(Polpitiya et al. Citation2008) Protein regulations were determined using the Limma-Ranked Product approach (Schwammle, Leon, and Jensen Citation2013). Only proteins with adjusted p-values ≤ 0.1 were considered deregulated.
The raw data and analysis results were deposited to the ProteomeXchange Consortium (http://proteomecentral.proteomexchange.org) via the PRIDE (Vizcaino et al. Citation2013) partner repository with the dataset identifier PXD009197 . The complete list of identified and deregulated proteins is provided as supplementary information.
2.16. Bioinformatics analysis of protein networks and affected pathways
To decipher the role of significantly regulated proteins, CluePedia and ClueGO, Cytoscape plug-ins, were used within the Cytoscape framework with default parameters to find the biological networks and interrelations of the functional groups as described previously (Bindea et al. Citation2009; Bindea, Galon, and Mlecnik Citation2013).
2.17. Statistical analysis of MTS assay
MTS assay was carried out in triplicate and the results were analyzed using one way ANOVA (multiple comparisons) with prism 7 software. The data were presented as the mean value ± SD. To assess the level between exposure and respective controls, p values < 0.05 were considered statistically significant.
3. Results and discussion
3.1. Characterization of nanoparticles
Dynamic light scattering (DLS) experiments were done to measure the sizes of spherical PVP- stabilized AgNPs. The diameters of these AgNPs were 55.7 ± 2.3 nm (). For protein corona formation, the PVP-coated AgNPs were mixed with 10% human plasma in 50 ml falcon tubes and incubated for 2 h on rotation at 4 °C. DLS revealed an increase in the size of the nanoparticles, to 87.1 ± 2.6 nm (). Time dependent analysis of AgNP stability in the exposure culture media at 24 h and 48 h showed that the size of the particles were still intact ranging from 82 to 87 nm respectively (). The nanoparticles were well-dispersed and no aggregation was observed upon addition to the cell culture media. According to the information provided by the manufacturer, the diameter (based on TEM) and the zeta potential of spherical PVP-stabilized AgNPs in Milli Q water was equal to 47 ± 4 nm () and −33 mV, respectively
Figure 1. Characterization of PVP-coated AgNPs. (A) Representative dynamic light scattering (DLS) profiles of 50 nm bare AgNPs and (B) AgNPs after protein corona formation. (C,D) AgNPs stability in the exposure culture media at 24 h and 48 h. Transmission electron microscope (TEM) images of 50 nm AgNPs provided by the manufacturer (E).
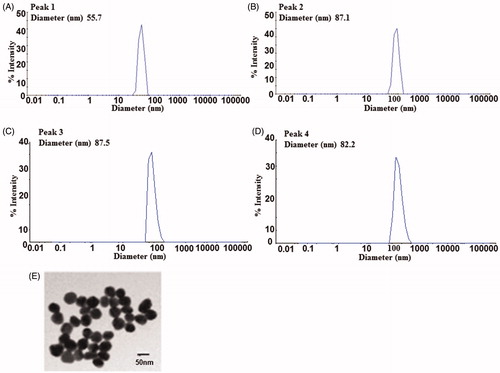
Zeta potential measurements were obtained to evaluate surface charges and stabilities of AgNPs. The surface charge values for the naked PVP coated AgNPs with no protein corona was (ζ = −34 mV) and for the PVP coated AgNPs with protein corona formation incubated in the exposure culture media for 24 and 48 h time points were found to be (ζ = −9 mV) and (ζ = −14 mV) respectively. The slight reduction in the ζ- potential of the AgNPs in the exposure culture media is in accordance with published data suggesting that when the ζ-potential approaches zero there is a reduction in the interparticle repulsion as well as in the stability of the dispersion. (Jurasin et al. Citation2016). The ICP-MS results also showed that the ionic release of Ag+ from the AgNPs was less than 10% indicating that the AgNPs were relatively stable in the exposure culture media with time.
3.2 Immunocytochemical staining of junctional (TJ) proteins claudin-5 and zonula occludens-1 (ZO-1)
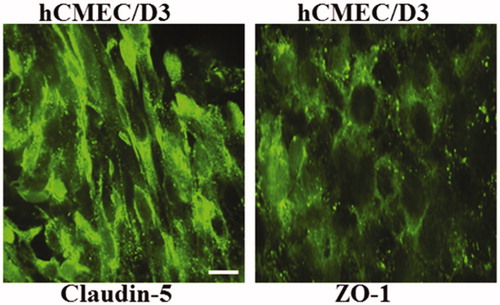
Expression of TJ proteins at intercellular junctions is best observed when the cells exhibit maximum confluency. Immunofluorescence analysis of BBB endothelial cell monolayer revealed an expression of claudin-5 and ZO-1 revealing tight junction integrity of the blood brain barrier. No difference was observed in the expression level of ZO-1 with or without AgNPs exposure (). No immunoreactivity was observed in the negative control (data not shown).
Figure 2. Expression of ZO-1 and Claudin-5 in hCMEC/D3 cells. hCMEC/D3 and astrocytes cells were grown in co-culture on transwell membranes and stained for Claudin-5 and ZO-1 at day 8. Scale bar 10 µm.
3.3 Evaluation of BBB permeability through TEER measurements
TEER is a simple method of testing the integrity of an in vitro BBB in a Transwell culture system. This established technique was used to assess whether AgNPs disrupt the cell barrier permeability. Addition of AgNPs to the apical (upper) compartment of the membrane insert (10 µg/ml) did not significantly reduce TEER; the TEER value was found to be 69.5 ± 5.2 Ωcm2 before and after the addition of the AgNPs. Similar values have also been reported by other groups for BBB models based on the same cell lines (Eigenmann et al. Citation2013; Forster et al. Citation2008).
3.4 Time dependent changes in cellular viability upon AgNPs exposure
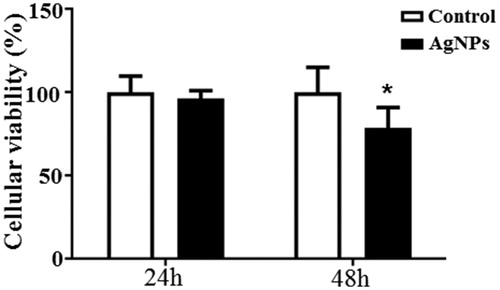
To investigate the cytotoxic effect of AgNPs in hCMEC/D3 cells we measured the cell viability using the MTS assay 24 and 48 h after AgNPs exposure. 50 nm AgNPs (10 μg/mL) did not alter the cells viability in 24 h time period compared to the control. However we observed a significant decline of 20% in the cellular viability of the AgNP treated cells at 48 h time period ().
Figure 3. MTS assay in hCMEC/D3 cells exposed for 24 h and 48 h. Values in % compared to control group. Data are presented as the mean + sd of four independent replicates. Asterisks indicate effects in comparison to control (*p < 0.05).
3.5. AgNP triggers changes in the in vitro BBB at the proteome level after 24 h of exposure
Dissolution of AgNP to Ag+ is a known phenomenon occurring in various solutions. In order to assess to what degree cells were exposed to AgNP and Ag+, we performed ICP-MS of the solution used in the exposure experiments. The results showed that the majority of AgNPs were stable in the time course of the experiments with minimal release of Ag+ (). For a deeper understanding of the effect of AgNPs on the in vitro BBB, the proteomes of the human endothelial cells and astrocytes were studied with quantitative proteomics ().
Figure 4. Measurements of dissolved silver from AgNP in the exposure media after 24 and 48 h time points by ICP-MS. Ag + concentrations were measured after spinning down the AgNPs from the media solution. Values are given as ppm. Data are presented as the mean + SD of three independent replicates. p < 0.05.
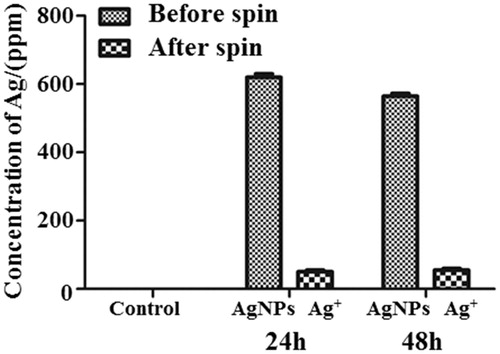
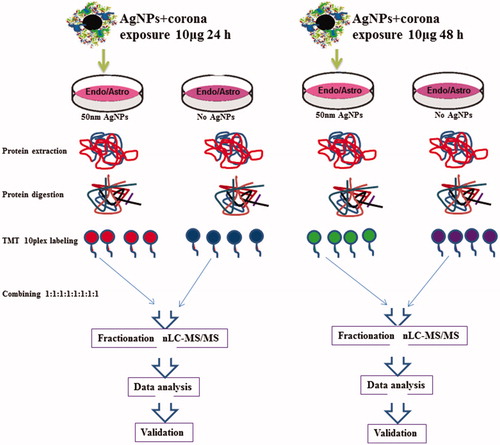
Figure 5. Proteomics work flow. BBB cells (endothelial cells and astrocytes) were treated with 50 nm AgNPs (10 μg/ml). Untreated cells were used as controls. Proteins were digested with trypsin and labeled with TMT 10-plex. The samples were combined in equal amounts and subjected to high pH fractionation. Each of the 8 fractions collected was subjected to nLC-MS/MS analysis.
After 24 h of exposure to AgNPs, mass spectrometry-based analyses of endothelial cells quantified a total of 5947 proteins in which 100 unique proteins were upregulated and 111 proteins were downregulated compared to the control groups. After 48 h exposure to AgNPs, a total 6125 proteins were quantified, in which 15 proteins were upregulated and 15 proteins were downregulated. Thus, we observed a change in expression levels of multiple proteins at 24 h, but by 48 h most of these proteins were expressed at control levels. In the case of the astrocyte proteome, we quantified 3034 and 2850 proteins after 24 h and 48 h AgNPs exposure, respectively. Interestingly, no differentially regulated proteins were found in the astrocyte proteome at either time point. This indicates either insignificant transcytosis between the cell types or greater tolerance of astrocytes to the AgNPs.
3.6. Effects of AgNPs on the blood brain barrier endothelial cell proteome after 24 h of exposure
The major effects of AgNPs were observed in BBB endothelial cells at the 24 h exposure time point. Several protein pathways associated with neuroinflammation and degeneration were upregulated while anti-oxidative proteins were found to be downregulated (). Several metallothioneins (MTs) (MT2A, MT1E, MT1M) were found to be upregulated in response to AgNPs exposure (top panel). Upregulation of MTs in response to increased cellular concentrations of metal ions has been identified as a mechanism of controlling metal ion concentration. Brain cells are highly susceptible to metal toxicity from high metal concentrations, and MTs play a major role in protecting the brain by neutralizing the toxic effects of metals (Bobilya et al. Citation2008; Juarez-Rebollar et al. Citation2017). It has been demonstrated that increased accumulation of AgNPs in cells leads to inflammation and oxidative stress resulting in activation of MT-mediated antioxidant defense mechanisms which attenuate the damage caused by the cellular presence of silver ions and AgNPs (Luther et al. Citation2012).
Figure 6. Reactome and wikipathway analysis of endothelial cells exposed for 24 h to 50 nm AgNPs. Pathways and proteins shaded in red are upregulated and pathways shaded in green are downregulated respectively. ▲ represents reactome reactions. ● represents reactome pathways. ▼ represents wikipathways.
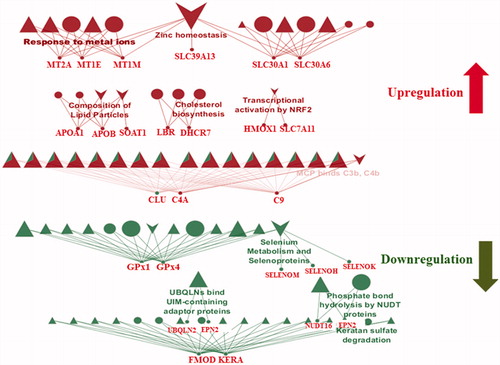
Other pathways affected by AgNPs exposure were the cholesterol biosynthesis and lipid homeostasis pathways, which were both upregulated. Upregulation of these pathways has been associated with Alzheimer’s disease (AD) and other neurodegenerative diseases. It has been reported that cholesterol levels constantly increase during the clinical progression of Alzheimer’s disease (Zhang and Liu Citation2015; Cutler et al. Citation2004). The upregulation of 7-dehydrocholesterol reductase (DHCR7), an important enzyme in cholesterol synthesis, leads to increased production of cholesterol and alterations in cholesterol metabolism, leading to various brain diseases (Zhang et al. Citation2018; Hughes et al. Citation2013; Witsch-Baumgartner, Loffler, and Utermann Citation2001). Cellular exposure to AgNPs induces increased turnover of DHCR7, which in turn deregulates cholesterol metabolism (Goedeke and Fernandez-Hernando Citation2014). This suggests that AgNPs exposure may result in activation of similar pathways to those active pathways reported under conditions of neurotoxicity and neurodegeneration. Other proteins affected by AgNPs exposure is that of ABC (ATP-binding cassette) transporters involved in lipid homeostasis. Human ABC transporters are found in different cell types including the endothelial cells of the BBB and brain parenchymal cells. They transport molecules across lipid membranes and mediate a critical role in cellular homeostasis (TER Beek, Guskov, and Slotboom Citation2014; Abuznait and Kaddoumi Citation2012). In many recent studies, ABC transporters have been implicated in several CNS and non-CNS related diseases (Abuznait and Kaddoumi Citation2012; Pereira et al. Citation2018; Weiss et al. Citation2009). Alteration in the expression and functional activity of ABC transporters may contribute to the aggregation of amyloid β-peptide (Aβ) in the brain and/or endothelial cells, leading to increased risk of developing AD by failure to protect the BBB (Nicolazzo and Mehta Citation2010; Abuznait et al. Citation2011; Rapposelli, Digiacomo, and Balsamo Citation2009). In this context, we may add that AgNPs-induced toxicity alters the level of the ABC transporters in the BBB, which can in turn be a risk factor for neurodegenerative diseases.
ZNT1 and ZNT6, members of the Zn transporters protein family, were also found to be upregulated after AgNPs exposure. These proteins have also been associated with many neurological diseases including AD (Olesen et al. Citation2016; Szewczyk Citation2013; Rafalo-Ulinska et al. Citation2016; Zhang et al. Citation2008). Furthermore, researchers working on a mouse model of AD have found that increased levels of ZNT1 and ZNT6 levels in the AD transgenic mouse brain are closely associated with plaque formation, a common symptom of AD (Zhang et al. Citation2010). We may suspect that the upregulation of these proteins may be due to the increased accumulation of AgNPs in the cells. In this context, it can be speculated that ZNTs are required to control AgNPs influx and maintain cellular homeostasis.
Another interesting finding of this study was the inhibition of keratan sulfate degradation. Keratan sulfate (KS) is an extracellular polysaccharide classified as a member of the glycosaminoglycans. Keratan sulfate has been reported to induce toxicity during axonal regeneration, and its removal from the brain is seen as a protective mechanism for brain cells. The presence of keratan sulfate may enhance the inflammation process, leading to increase oxidative stress and toxicity (Cui et al. Citation2013; Silver and Miller Citation2004).
We also observed that the anti-oxidative proteins glutathione peroxidase (Gpx1) and glutathione peroxidase (Gpx4), known for their protective roles against oxidative stress, were downregulated. Expression of Gpx1 and Gpx4 has been shown to be reduced in a mouse model of AD and Parkinson disease (PD) (Zhang et al. Citation2016; Porcellotti et al. Citation2015). Studies have shown that reduced levels of Gpx1 and Gpx4 lead to neurotoxicity-mediated neurodegeneration (Zemolin et al. Citation2012; Yoo et al. Citation2010; Bellinger et al. Citation2011). It has also been shown that the generation of ROS leads to increased oxidative stress and that low levels of antioxidants can further exacerbate the situation (Veronesi et al. Citation2005). Increased AgNPs accumulation may lead to increased toxicity in cells at the initial stage, resulting in a decline of the anti-oxidant defense mechanism.
Consistent with other published findings on AgNPs exposure at 24 h, we also found upregulation of other proteins, such as alpha-2-macroglobulin (α2M) and complement component C9 (C9), which are released upon BBB damage (Cucullo et al. Citation2003; Lindsberg et al. Citation1996; Kanoh and Ohtani Citation1997). α2M, an acute-phase 720-kDa glycoprotein protein and a major component of the innate immune system, has been associated with cerebrospinal fluid (CSF) markers of neuronal injury in AD (Varma et al. Citation2017). We suggest that increased AgNPs accumulation in the endothelial cells may trigger counterbalancing “BBB protective” cascades by initiating the release of α2M. Increased inflammation of the BBB has been observed in neurological diseases including AD and we observed the activation of pro-inflammatory factors including complement activation protein (C9), which would keep the BBB inflamed (Montagne, Zhao, and Zlokovic Citation2017; Rus et al. Citation2006; Gao et al. Citation2017; Takano, Elimam, and Cybulsky Citation2013). It has been reported previously that C9 enters the brain upon BBB failure (Rus and Niculescu Citation2001). These results may indicate that upon AgNPs exposure, the inflamed BBB becomes prone to C9 entry and C9 may play an important role in brain inflammation. Another interesting finding was the downregulation of proteins like ubiquilin 2 (UBQLN2) and espin 2 (EPN2) after 24 h of AgNPs exposure. These proteins are typically responsible for maintaining homeostasis in cells by binding and delivering misfolded proteins to the proteasome for degradation (Lee and Brown Citation2012; Rothenberg and Monteiro Citation2010). Reduction in copy numbers of these proteins can lead to the increased accumulation of misfolded proteins inside the cells and increased depositions of misfolded proteins have been implicated in several neurodegenerative diseases (Hjerpe et al. Citation2016; Moore et al. Citation2005). Overall, our findings point at an array of AgNP-induced toxicity effects that altogether can be responsible for or add to various cellular dysfunctions.
We observed that C9, a protein associated with the innate immune system was upregulated after 24 h exposure to AgNPs, whereas it was found to be absent after 48 h exposure. This suggests an increase in complement system mediated inflammation during the 24 h time period confirming the toxicological response after 24 h exposure to AgNPs.
On the basis of our findings at the 24 h time point, we analyzed various pathways for changes in response to AgNPs-induced neurotoxicity. Strikingly, many of the deregulated pathways share similarity to changes observed for neurodegenerative diseases such as AD and PD. However, more studies are needed to determine whether AgNPs exposure can be linked as a risk factor for the occurrence of neurodegenerative diseases such as AD and PD.
3.7. Effect of AgNPs on the blood brain barrier endothelial cell proteome after 48 h of exposure
To observe the late effects of AgNPs exposure, BBB cells were incubated with AgNPs for 48 h. Analysis of the endothelial cell proteome revealed alterations in pathways involved in cellular mechanisms of protection from AgNPs-induced toxicity. The late response of the endothelial cells was characterized by the production of various antioxidant proteins (). It is known that antioxidants proteins have beneficial effects on the BBB damage responses and play a major role in its recovery from damage (Du et al. Citation2016; Janyou et al. Citation2017; Jumnongprakhon et al. Citation2015; Lim et al. Citation2016; Mendes Arent et al. Citation2014; Benvenisti-Zarom and Regan Citation2007). Antioxidant proteins like nuclear factor-like 2 protein (Nrf2) and heme oxygenase-1 (HMOX-1) have been defined as oxidative-sensor proteins. It has been reported that HMOX-1 is expressed at low levels in the brain under normal conditions, but is induced by oxidative stress via Nrf2-regulated transcriptional activation. Increased HMOX-1 expression helps in attenuating cell loss, blood-brain barrier breakdown, inflammation and neurological deficits in a mouse model of intracerebral hemorrhage. Nrf2 knockout in that same model prevented any benefit from increased HMOX-1 expression and worsened injury (Iniaghe et al. Citation2015; Chen-Roetling et al. Citation2017).
Figure 7. Reactome and wikipathway analysis of endothelial cells exposed for 48 h to 50 nm AgNPs. Pathways and proteins shaded in red are upregulated and pathways shaded in green are downregulated respectively. ▲ symbol represents reactome reactions. ● symbol represents reactome pathways. ▼ symbol represents wikipathways.
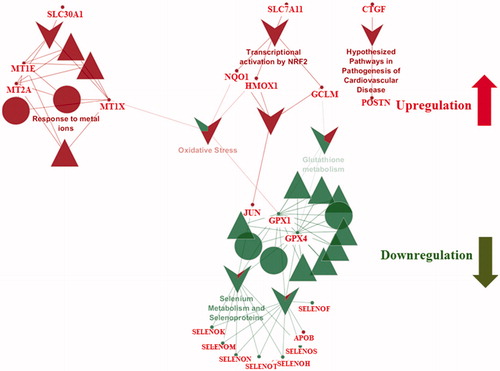
Other anti-inflammatory proteins found to be in high abundance after 48 h AgNPs exposure were quinoneoxidoreductase-1(NQO1) and glutamate-cysteine ligase catalytic subunit (GCLM) (). The anti-oxidant proteins were significantly upregulated after 48 h AgNPs exposure compared to its expression at 24 h exposure. The anti-oxidant proteins NQO1 and GCLM are also reported to be involved in endogenous cellular stress responses and to protect cells from ROS-induced damage and cell death (Du et al. Citation2016; Lin et al. Citation2017; Zhang, Davies, and Forman Citation2015). Thus, increased production of these proteins after AgNPs exposure may indicate the activation of various oxidative and inflammatory injury response cascades in response to AgNPs., NQO1 expression was elevated after 48 h AgNPs exposure. This suggests that at the earlier 24 h time point, the cellular recover machinery was still in an early stage of activation. Surprisingly, of these anti-stress proteins, we saw upregulation of only one, HMOX-1, at the initial stage of the AgNPs exposure (24 h). This may be due to the fact that the tightly regulated anti-oxidative mechanisms can be compromised due to the sudden AgNPs exposure. We also observed upregulation of pathways responsible for inflammation which indicates that the cellular response machinery acts in a time-dependent manner.
3.8. Insignificant effect of AgNPs on astrocytes
Since astrocytes play a major role in the functioning of the BBB, we were interested in studying the astrocyte proteome after exposure to AgNPs for different time periods (Kumosa, Zetterberg, and Schouenborg Citation2018; Banks, Kovac, and Morofuji Citation2018; Moura, Almeida, and Sarmento Citation2017). It has been reported that astrocytes have a prominent function in metal metabolism in the brain (Dringen et al. Citation2007). Astrocytes accumulate different metals and protect the brain from metal-derived toxicity (Hoepken et al. Citation2004; Tiffany-Castiglion and Qian Citation2001). The ability of astrocytes to store toxic metals is due to the upregulation of proteins involved in metal storage and proteins that protect the astrocytes from metal-induced toxicity (Hoepken et al. Citation2004; Geppert et al. Citation2012). The absence of observable changes to the astrocyte proteome after AgNPs exposure might be due to reduced levels of AgNPs entering the astrocytes from the endothelial cells. It is possible that the endothelial cells were able to accumulate and/or export most of the AgNPs within themselves ().
Figure 8. Intracellular trafficking of 50 nm AgNPs in endothelial cells and astrocytes. Transmission electron microscopy (TEM) shows that AgNPs accumulated in endothelial cells (A,E) and in astrocytes (B,F) after 24 and 48 h exposure. The controls of endothelial cells and astrocytes are displayed as panel (C,G) and (D,H), respectively. Scale bar 1 µm.
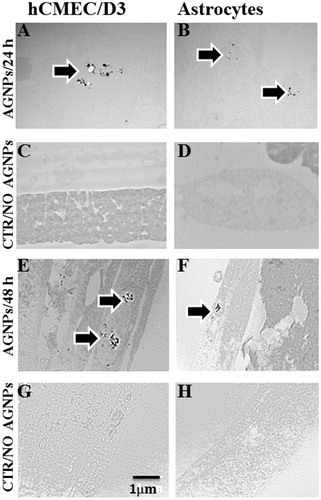
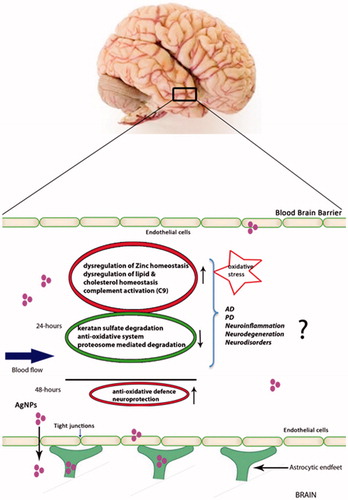
Figure 9. Schematic representation of AgNPs entry into the brain. AgNPs pass through the BBB from the blood and enter the brain, affecting the BBB proteome. Figure displays various cellular pathways upregulated and downregulated in endothelial cells in response to AgNPs exposure.
3.9. Intracellular trafficking of the AgNPs in the BBB
Accumulation and transport of the AgNPs through the BBB was studied by transmission electron microscopy (TEM). This technique allows the study of possible transcytosis of AgNPs from the endothelial cells to the astrocytes. TEM data showed that at 24 and 48 h time point, AgNPs had accumulated in endothelial cells, as they were identified inside vacuoles dispersed in the cytoplasm ().
The astrocyte TEM data also revealed that AgNPs added to the apical surfaces of endothelial cells migrated into and accumulated inside the astrocytes, but there were smaller numbers of AgNPs-containing vacuoles in astrocytes than in endothelial cells. It may be noted that only small numbers of AgNPs were able to enter the astrocytes through the endothelial cells. (). No signals of AgNP were observed in the negative controls (). These findings may explain why changes in the endothelial cell proteome were seen after AgNPs addition, but not in the astrocyte proteome.
4. Conclusion
We have highlighted various pathways of AgNPs-induced neurotoxicity in this in vitro BBB cell model. Deep proteomics analysis was combined with complementary analytical techniques to study the effects of exposure of our BBB model to 50 nm silver nanoparticles. The results indicate that cellular responses to AgNPs exposure are time-dependent . At the initial stage of the AgNPs exposure, we observed activation of several pro-oxidative pathways followed by downregulation of anti-inflammatory and anti-oxidative pathways. At the later stage of AgNPs exposure, we saw upregulation of proteins responsible for protective effects during BBB damage. This study shows for the first time that there may be a novel cellular mechanism by which the BBB reverts back to the steady state from the inflamed state after initial damage. This study adds valuable knowledge about cellular behavior of the BBB upon exposure to AgNPs in a time-dependent manner. Additional studies using mouse models are required to obtain detailed information about the effect of AgNPs on blood brain barrier in vivo.
TNAN-2018-0119-File012.xlsx
Download MS Excel (791.1 KB)Acknowledgements
The authors wish to thank Andrea Henze PhD, Muhammed Rumann, PhD and Renata Miranda, PhD for their assistance. The assistance of Dr Aleksandra Rojek, Odense University Hospital, with TEM sample processing and imaging is gratefully acknowledge. Thanks also goes to Torben Christensen from the Biology workshop for his technical help in the construction of the in vitro BBB model and Pia Klingenberg Haussmann from the Department of Physics, Chemistry and Pharmacy, SDU for the assistance in ICP-MS experiments.We gratefully acknowledge the VILLUM center for bioanalytical sciences for their support in the project. The authors also like to acknowledge the Danish Molecular Biomedical Imaging Center (DaMBIC, University of Southern Denmark) for the use of the bioimaging facilities.
Disclosure statement
The authors declare that there are no conflicts of interest.
Additional information
Funding
Related Research Data
References
- Abuznait, A. H., C. Cain, D. Ingram, D. Burk, and A. Kaddoumi. 2011. “Up-regulation of P-glycoprotein Reduces Intracellular Accumulation of Beta Amyloid: Investigation of P-glycoprotein as a Novel Therapeutic Target for Alzheimer's Disease.” Journal of Pharmacy and Pharmacology 63 (8):1111. doi:10.1111/j.2042-7158.2011.01309.x.
- Abuznait, A. H., and A. Kaddoumi. 2012. “Role of ABC Transporters in the Pathogenesis of Alzheimer's Disease.” ACS Chemical Neuroscience 3 (11):820–831.
- Ahamed, M., M. S. Alsalhi, and M. K. Siddiqui. 2010. “Silver Nanoparticle Applications and Human Health.” Clinica et Chimica Acta 411 (23-24):1841–1848. doi:10.1016/j.cca.2010.08.016.
- Asharani, P. V., G. Low Kah Mun, M. P. Hande, and S. Valiyaveettil. 2009. “Cytotoxicity and Genotoxicity of Silver Nanoparticles in Human Cells.” ACS Nano 3 (2):279–290.
- Banks, W. A., A. Kovac, and Y. Morofuji. 2018. “Neurovascular Unit Crosstalk: Pericytes and Astrocytes Modify Cytokine Secretion Patterns of Brain Endothelial Cells.” Journal of Cerebral Blood Flow & Metabolism 38 (6):1104–1118. doi:10.1177/0271678X17740793.
- Bellinger, F. P., M. T. Bellinger, L. A. Seale, A. S. Takemoto, A. Raman, T. Miki, A. Manning-Bog, M. J. Berry, L. R. White, and G. W. Ross. 2011. “Glutathione Peroxidase 4 Is Associated with Neuromelanin in Substantia Nigra and Dystrophic Axons in Putamen of Parkinson's Brain.” Molecular Neurodegeneration 6 (1):8. doi:10.1186/1750-1326-6-8.
- Benvenisti-Zarom, L., and R. F. Regan. 2007. “Astrocyte-specific Heme Oxygenase-1 Hyperexpression Attenuates Heme-mediated Oxidative Injury.” Neurobiology of Disease 26 (3):688–695. doi:10.1016/j.nbd.2007.03.006.
- Bindea, G., J. Galon, and B. Mlecnik. 2013. “CluePedia Cytoscape Plugin: Pathway Insights Using Integrated Experimental and in Silico Data.” Bioinformatics 29 (5):661–663. doi:10.1093/bioinformatics/btt019.
- Bindea, G., B. Mlecnik, H. Hackl, P. Charoentong, M. Tosolini, A. Kirilovsky, W.-H. Fridman, F. Pagès, Z. Trajanoski, and J. Galon. 2009. “ClueGO: a Cytoscape Plug-in to Decipher Functionally Grouped Gene Ontology and Pathway Annotation Networks.” Bioinformatics 25 (8):1091–1093. doi:10.1093/bioinformatics/btp101.
- Bobilya, D. J., N. A. Gauthier, S. Karki, B. J. Olley, and W. K. Thomas. 2008. “Longitudinal Changes in Zinc Transport Kinetics, Metallothionein and Zinc Transporter Expression in a Blood-Brain Barrier Model in Response to a Moderately Excessive Zinc Environment.” The Journal of Nutritional Biochemistry 19 (2):129–137. doi:10.1016/j.jnutbio.2007.06.014.
- Bouwmeester, H., S. Dekkers, M. Y. Noordam, W. I. Hagens, A. S. Bulder, C. De Heer, S. E. TEN Voorde, S. W. Wijnhoven, H. J. Marvin, and A. J. Sips. 2009. “Review of Health Safety Aspects of Nanotechnologies in Food Production.” Regulatory Toxicology and Pharmacology: RTP 53 (1):52–62.
- Chen, X., and H. J. Schluesener. 2008. “Nanosilver: A Nanoproduct in Medical Application.” Toxicology Letters 176 (1):1–12.
- Chen-Roetling, J., P. Kamalapathy, Y. Cao, W. Song, H. M. Schipper, and R. F. Regan. 2017. “Astrocyte Heme Oxygenase-1 Reduces Mortality and Improves Outcome after Collagenase-induced Intracerebral Hemorrhage.” Neurobiology of Disease 102:140–146. doi:10.1016/j.nbd.2017.03.008.
- Christensen, F. M., H. J. Johnston, V. Stone, R. J. Aitken, S. Hankin, S. Peters, and K. Aschberger. 2010. “Nano-silver - feasibility and Challenges for Human Health Risk Assessment Based on Open Literature.” Nanotoxicology 4 (3):284–295. doi:10.3109/17435391003690549.
- Cucullo, L., N. Marchi, M. Marroni, V. Fazio, S. Namura, and D. Janigro. 2003. “Blood-brain Barrier Damage Induces Release of alpha2-Macroglobulin.” Molecular & Cellular Proteomics: MCP 2 (4):234–241.
- Cui, H., C. Freeman, G. A. Jacobson, and D. H. Small. 2013. “Proteoglycans in the Central Nervous System: Role in Development, Neural Repair, and Alzheimer's Disease.” Intrnational Union of Biochemistry and Molecular Biology: Life 65 (2):108–120. doi:10.1002/iub.1118.
- Cutler, R. G., J. Kelly, K. Storie, W. A. Pedersen, A. Tammara, K. Hatanpaa, J. C. Troncoso, and M. P. Mattson. 2004. “Involvement of Oxidative Stress-induced Abnormalities in Ceramide and Cholesterol Metabolism in Brain Aging and Alzheimer's Disease.” Proceedings of the National Academy of Sciences 101 (7):2070–2075.
- Dan, M., H. Wen, A. Shao, and L. Xu. 2018. “Silver Nanoparticle Exposure Induces Neurotoxicity in the Rat Hippocampus without Increasing the Blood-Brain Barrier Permeability.” Journal of Biomedicine Nanotechnology 14 (7):1330–1338.
- Daniels, B. P., L. Cruz-Orengo, T. J. Pasieka, P. O. Couraud, I. A. Romero, B. Weksler, J. A. Cooper, T. L. Doering, and R. S. Klein. 2013. “Immortalized Human Cerebral Microvascular Endothelial Cells Maintain the Properties of Primary Cells in an in Vitro Model of Immune Migration across the Blood Brain Barrier.” Journal of Neuroscience Methods 212 (1):173–179. doi:10.1016/j.jneumeth.2012.10.001.
- Dringen, R.,. G. M. Bishop, M. Koeppe, T. N. Dang, and S. R. Robinson. 2007. “The Pivotal Role of Astrocytes in the Metabolism of Iron in the Brain.” Neurochemical Research 32 (11):1884–1890.
- Du, F., X. Wang, B. Shang, J. Fang, Y. Xi, A. Li, and Y. Diao. 2016. “Gastrodin Ameliorates Spinal Cord Injury via Antioxidant and anti-inflammatory Effects.” Acta Biochimica Polonica 63 (3):589–593.
- Eigenmann, D. E., G. Xue, K. S. Kim, A. V. Moses, M. Hamburger, and M. Oufir. 2013. “Comparative Study of Four Immortalized Human Brain Capillary Endothelial Cell Lines, hCMEC/D3, hBMEC, TY10, and BB19, and Optimization of Culture Conditions, for an in Vitro Blood-brain Barrier Model for Drug Permeability Studies.” Fluids and Barriers of the CNS 10 (1):33. doi:10.1186/2045-8118-10-33.
- Forster, C., M. Burek, I. A. Romero, B. Weksler, P. O. Couraud, and D. Drenckhahn. 2008. “Differential Effects of Hydrocortisone and TNFalpha on Tight Junction Proteins in an in Vitro Model of the Human Blood-brain Barrier.” The Journal of Physiology 586:1937–1949. doi:10.1113/jphysiol.2007.146852.
- Gao, M., Q. Dong, H. Yao, Y. Lu, X. Ji, M. Zou, Z. Yang, M. Xu, and R. Xu. 2017. “Systemic Administration of Induced Neural Stem Cells Regulates Complement Activation in Mouse Closed Head Injury Models.” Science Reports 7:45989.
- Geppert, M., M. C. Hohnholt, S. Nurnberger, and R. Dringen. 2012. “Ferritin up-regulation and Transient ROS Production in Cultured Brain Astrocytes after Loading with Iron Oxide Nanoparticles.” Acta Biomaterialia 8 (10):3832–3839. doi:10.1016/j.actbio.2012.06.029.
- Goedeke, L., and C. Fernandez-Hernando. 2014. “MicroRNAs: a Connection between Cholesterol Metabolism and Neurodegeneration.” Neurobiology of Disease 72:48–53. doi:10.1016/j.nbd.2014.05.034.
- Hadrup, N., and H. R. Lam. 2014. “Oral Toxicity of Silver Ions, Silver Nanoparticles and Colloidal Silver–a Review.” Regulatory Toxicology and Pharmacology 68 (1):1–7. doi:10.1016/j.yrtph.2013.11.002.
- Hejbol, E. K., J. Sellathurai, P. D. Nair, and H. D. Schroder. 2017. “Injectable Scaffold Materials Differ in Their Cell Instructive Effects on Primary Human Myoblasts.” Journal of Tissue Engineering 8:1–11. doi:10.1177/2041731417717677.
- Hjerpe, R.,. J. S. Bett, M. J. Keuss, A. Solovyova, T. G. Mcwilliams, C. Johnson, I. Sahu, et al. 2016. “UBQLN2 Mediates Autophagy-Independent Protein Aggregate Clearance by the Proteasome.” Cell 166 (4):935–949. doi:10.1016/j.cell.2016.07.001.
- Hoepken, H. H., T. Korten, S. R. Robinson, and R. Dringen. 2004. “Iron Accumulation, Iron-Mediated Toxicity and Altered Levels of Ferritin and Transferrin Receptor in Cultured Astrocytes during Incubation with Ferric Ammonium Citrate.” Journal of Neurochemistry 88 (5):1194–1202. doi:10.1046/j.1471-4159.2003.02236.x.
- Hoet, P. H., I. Bruske-Hohlfeld, and O. V. Salata. 2004. “Nanoparticles - known and Unknown Health Risks.” Journal of Nanobiotechnology 2 (1):12.
- Hughes, T. M., C. Rosano, R. W. Evans, and L. H. Kuller. 2013. “Brain Cholesterol Metabolism, Oxysterols, and Dementia.” Journal of Alzheimer's Disease : JAD 33 (4):891–911.
- Iniaghe, L. O., P. R. Krafft, D. W. Klebe, E. K. I. Omogbai, J. H. Zhang, and J. Tang. 2015. “Dimethyl Fumarate Confers Neuroprotection by Casein Kinase 2 Phosphorylation of Nrf2 in Murine Intracerebral Hemorrhage.” Neurobiology of Disease 82:349–358. doi:10.1016/j.nbd.2015.07.001.
- Janyou, A.,. P. Wicha, J. Jittiwat, A. Suksamrarn, C. Tocharus, and J. Tocharus. 2017. “Dihydrocapsaicin Attenuates Blood Brain Barrier and Cerebral Damage in Focal Cerebral Ischemia/Reperfusion via Oxidative Stress and Inflammatory.” Science Reports 7:10556.
- Jensen, P., C. L. Myhre, P. S. Lassen, A. Metaxas, A. M. Khan, K. L. Lambertsen, A. A. Babcock, B. Finsen, M. R. Larsen, and S. J. Kempf. 2017. “TNFalpha Affects CREB-mediated Neuroprotective Signaling Pathways of Synaptic Plasticity in Neurons as Revealed by Proteomics and Phospho-Proteomics.” Oncotarget 8:60223–60242.
- Juarez-Rebollar, D., C. Rios, C. Nava-Ruiz, and M. Mendez-Armenta. 2017. “Metallothionein in Brain Disorders.” Oxidative Medicine and Cellular Longevity 2017:5828056.
- Jumnongprakhon, P., P. Govitrapong, C. Tocharus, D. Pinkaew, and J. Tocharus. 2015. “Melatonin Protects Methamphetamine-Induced Neuroinflammation through NF-kappaB and Nrf2 Pathways in Glioma Cell Line.” Neurochemical Research 40 (7):1448–1456. doi:10.1007/s11064-015-1613-2.
- Jurasin, D. D., M. Curlin, I. Capjak, T. Crnkovic, M. Lovric, M. Babic, D. Horak, I. Vinkovic Vrcek, and S. Gajovic. 2016. “Surface Coating Affects Behavior of Metallic Nanoparticles in a Biological Environment.” Beilstein Journal of Nanotechnology 7:246–262. doi:10.3762/bjnano.7.23.
- Kanoh, Y., and H. Ohtani. 1997. “Levels of Interleukin-6, CRP and Alpha 2 Macroglobulin in Cerebrospinal Fluid (CSF) and Serum as Indicator of blood-CSF Barrier damage.” Biochemistry and Molecular Biology International 43 (2):269–278.
- Kumosa, L. S., V. Zetterberg, and J. Schouenborg. 2018. “Gelatin Promotes Rapid Restoration of the Blood Brain Barrier after Acute Brain Injury.” Acta Biomaterialia 65:137–149. doi:10.1016/j.actbio.2017.10.020.
- Lara, H. H., E. N. Garza-Trevino, L. Ixtepan-Turrent, and D. K. Singh. 2011. “Silver Nanoparticles Are Broad-spectrum Bactericidal and Virucidal Compounds.” Journal of Nanobiotechnology 9 (1):30. doi:10.1186/1477-3155-9-30.
- Laursen, I., P. Hojrup, G. Houen, and M. Christiansen. 2008. “Characterisation of the 1st SSI Purified MBL Standard.” Clinica Chimica Acta; International Journal of Clinical Chemistry 395 (1-2):159–161.
- Lee, D. Y., and E. J. Brown. 2012. “Ubiquilins in the Crosstalk Among Proteolytic Pathways.” Biological Chemistry 393 (6):441–447.
- Lim, J. L., S. M. van der Pol, F. di Dio, B. van Het Hof, G. Kooij, H. E. de Vries, and J. van Horssen. 2016. “Protective Effects of Monomethyl Fumarate at the Inflamed Blood-brain Barrier.” Microvascular Research 105:61–69. doi:10.1016/j.mvr.2015.12.003.
- Lin, C. C., C. C. Yang, L. D. Hsiao, S. Y. Chen, and C. M. Yang. 2017. “Heme Oxygenase-1 Induction by Carbon Monoxide Releasing Molecule-3 Suppresses Interleukin-1beta-Mediated Neuroinflammation.” Frontiers in Molecular Neuroscience 10:387.
- Lindsberg, P. J., J. Ohman, T. Lehto, M. L. Karjalainen-Lindsberg, A. Paetau, T. Wuorimaa, O. Carpen, M. Kaste, and S. Meri. 1996. “Complement Activation in the Central Nervous System following Blood-brain Barrier Damage in Man.” Annals of Neurology 40 (4):587–596. doi:10.1002/ana.410400408.
- Luther, E. M., M. M. Schmidt, J. Diendorf, M. Epple, and R. Dringen. 2012. “Upregulation of Metallothioneins after Exposure of Cultured Primary Astrocytes to Silver Nanoparticles.” Neurochemical Research 37 (8):1639–1648. doi:10.1007/s11064-012-0767-4.
- Maynard, A. D. 2014. “Old Materials, new Challenges?.” Nature Nanotechnology 9 (9):658.
- Mendes Arent, A., L. F. DE Souza, R. Walz, and A. L. Dafre. 2014. “Perspectives on Molecular Biomarkers of Oxidative Stress and Antioxidant Strategies in Traumatic Brain Injury.” Biomed Research International 2014:1. doi:10.1155/2014/723060.
- Miethling-Graff, R., R. Rumpker, M. Richter, T. Verano-Braga, F. Kjeldsen, J. Brewer, J. Hoyland, H. G. Rubahn, and H. Erdmann. 2014. “Exposure to Silver Nanoparticles Induces Size- and Dose-dependent Oxidative Stress and Cytotoxicity in Human Colon Carcinoma Cells.” Toxicology in Vitro 28 (7):1280–1289. doi:10.1016/j.tiv.2014.06.005.
- Miranda, R. R., V. Gorshkov, B. Korzeniowska, S. J. Kempf, F. F. Neto, and F. Kjeldsen. 2018. “Co-exposure to Silver Nanoparticles and Cadmium Induce Metabolic Adaptation in HepG2 Cells.” Nanotoxicology 12 (7):781–795. doi:10.1080/17435390.2018.1489987.
- Mirsattari, S. M., R. R. Hammond, M. D. Sharpe, F. Y. Leung, and G. B. Young. 2004. “Myoclonic Status Epilepticus Following Repeated Oral Ingestion of Colloidal Silver.” Neurology 62 (8):1408–1410.
- Montagne, A., Z. Zhao, and B. V. Zlokovic. 2017. “Alzheimer's Disease: A Matter of Blood-Brain Barrier Dysfunction?” The Journal of Experimental Medicine 214 (11):3151–3169. doi:10.1084/jem.20171406.
- Moore, D. J., A. B. West, V. L. Dawson, and T. M. Dawson. 2005. “Molecular Pathophysiology of Parkinson's disease.” Annual Review of Neuroscience 28:57–87.
- Moura, R. P., A. Almeida, and B. Sarmento. 2017. “The Role of Non-Endothelial Cells on the Penetration of Nanoparticles through the Blood Brain Barrier.” Progress in Neurobiology 159:39–49. doi:10.1016/j.pneurobio.2017.09.001.
- Nicolazzo, J. A., and D. C. Mehta. 2010. “Transport of Drugs across the Blood-Brain Barrier in Alzheimer's Disease.” Therapeutic Delivery 1 (4):595–611.
- Olesen, R. H., T. M. Hyde, J. E. Kleinman, K. Smidt, J. Rungby, and A. Larsen. 2016. “Obesity and Age-Related Alterations in the Gene Expression of Zinc-transporter Proteins in the Human Brain.” Translational Psychiatry 6 (6):e838. doi:10.1038/tp.2016.83.
- Pereira, C. D., F. Martins, J. Wiltfang, E. S. O. A. B. da Cruz, and S. Rebelo. 2018. “ABC Transporters Are Key Players in Alzheimer's Disease.” Journal of Alzheimer's Disease: JAD 61 (2):463–485.
- Polpitiya, A. D., W. J. Qian, N. Jaitly, V. A. Petyuk, J. N. Adkins, D. G. Camp 2nd, G. A. Anderson, and R. D. Smith. 2008. “DAnTE: a Statistical Tool for Quantitative Analysis of -omics Data.” Bioinformatics (Oxford, England) 24 (13):1556–1558.
- Porcellotti, S., F. Fanelli, A. Fracassi, S. Sepe, F. Cecconi, C. Bernardi, A. Cimini, M. P. Ceru, and S. Moreno. 2015. “Oxidative Stress during the Progression of beta-Amyloid Pathology in the Neocortex of the Tg2576 Mouse Model of Alzheimer's Disease.” Oxidative Medicine and Cellular Longevity 2015:1. doi:10.1155/2015/967203.
- Rafalo-Ulinska, A., J. Piotrowska, A. Kryczyk, W. Opoka, M. Sowa-Kucma, P. Misztak, G. Rajkowska, et al. 2016. “Zinc Transporters Protein Level in Postmortem Brain of Depressed Subjects and Suicide Victims.” Journal of Psychiatric Research 83:220–229. doi:10.1016/j.jpsychires.2016.09.008.
- Rahman, M. F., J. Wang, T. A. Patterson, U. T. Saini, B. L. Robinson, G. D. Newport, R. C. Murdock, J. J. Schlager, S. M. Hussain, and S. F. Ali. 2009. “Expression of Genes Related to Oxidative Stress in the Mouse Brain after Exposure to Silver-25 Nanoparticles.” Toxicology Letters 187 (1):15–21. doi:10.1016/j.toxlet.2009.01.020.
- Rai, M., A. Yadav, and A. Gade. 2009. “Silver Nanoparticles as a New Generation of Antimicrobials.” Biotechnology Advances 27 (1):76–83.
- Rapposelli, S., M. Digiacomo, and A. Balsamo. 2009. “P-gp Transporter and Its Role in Neurodegenerative Diseases.” Current Topics in Medicinal Chemistry 9 (2):209–217.
- Rothenberg, C., and M. J. Monteiro. 2010. “Ubiquilin at a Crossroads in Protein Degradation Pathways.” Autophagy 6 (7):979–980.
- Rus, H., C. Cudrici, S. David, and F. Niculescu. 2006. “The Complement System in Central Nervous System Diseases.” Autoimmunity 39 (5):395–402. doi:10.1080/08916930600739605.
- Rus, H., and F. Niculescu. 2001. “The Complement System in Central Nervous System Diseases.” Immunologic Research 24 (1):79–86.
- Schwammle, V., I. R. Leon, and O. N. Jensen. 2013. “Assessment and Improvement of Statistical Tools for Comparative Proteomics Analysis of Sparse Data Sets with Few Experimental Replicates.” Journal of Proteome Research 12:3874–3883. doi:10.1021/pr400045u.
- Sharma, V. K. 2009. “Aggregation and Toxicity of Titanium Dioxide Nanoparticles in Aquatic Environment–a Review.” Journal of Environmental Science and Health Part A, Toxic/Hazardous Substances and Environmental Engineering 44 (14):1485–1495. doi:10.1080/10934520903263231.
- Sharma, H. S., S. F. Ali, S. M. Hussain, J. J. Schlager, and A. Sharma. 2009a. “Influence of Engineered Nanoparticles from Metals on the Blood-brain Barrier Permeability, cerebral Blood Flow, Brain Edema and Neurotoxicity. An Experimental Study in the Rat and Mice Using Biochemical and Morphological Approaches.” Journal of Nanoscience and Nanotechnology 9 (8):5055–5072. doi:10.1166/jnn.2009.GR09.
- Sharma, H. S., S. F. Ali, Z. R. Tian, S. M. Hussain, J. J. Schlager, P. O. Sjoquist, A. Sharma, and D. F. Muresanu. 2009b. “Chronic Treatment with Nanoparticles Exacerbate Hyperthermia Induced Blood-brain Barrier Breakdown, cognitive Dysfunction and Brain Pathology in the Rat. Neuroprotective Effects of Nanowired-antioxidant Compound H-290/51.” Journal of Nanoscience and Nanotechnology 9 (8):5073–5090. doi:10.1166/jnn.2009.GR10.
- Silver, J., and J. H. Miller. 2004. “Regeneration beyond the Glial Scar.” Nature Reviews. Neuroscience 5 (2):146–156.
- Srinivasan, B., A. R. Kolli, M. B. Esch, H. E. Abaci, M. L. Shuler, and J. J. Hickman. 2015. “TEER Measurement Techniques for in Vitro Barrier Model Systems.” Journal of Laboratory Automation 20 (2):107–126.
- Szewczyk, B. 2013. “Zinc Homeostasis and Neurodegenerative Disorders.” Frontiers in Aging Neuroscience 5:33.
- Takano, T., H. Elimam, and A. V. Cybulsky. 2013. “Complement-Mediated Cellular Injury.” Seminars in Nephrology 33 (6):586–601. doi:10.1016/j.semnephrol.2013.08.009.
- Tang, J., L. Xiong, S. Wang, J. Wang, L. Liu, J. Li, F. Yuan, and T. Xi. 2009. “Distribution, translocation and Accumulation of Silver Nanoparticles in Rats.” Journal of Nanoscience and Nanotechnology 9 (8):4924–4932. doi:10.1166/jnn.2009.1269.
- Tang, J., L. Xiong, G. Zhou, S. Wang, J. Wang, L. Liu, J. Li, et al. 2010. “Silver Nanoparticles Crossing through and Distribution in the Blood-Brain Barrier in Vitro.” Journal of Nanoscience and Nanotechnology 10 (10):6313–6317. doi:10.1166/jnn.2010.2625.
- TER Beek, J., A. Guskov, and D. J. Slotboom. 2014. “Structural Diversity of ABC Transporters.” The Journal of General Physiology 143 (4):419–435.
- Thomas, K., and P. Sayre. 2005. “Research Strategies for Safety Evaluation of Nanomaterials, Part I: Evaluating the Human Health Implications of Exposure to Nanoscale Materials.” Toxicological Sciences 87 (2):316–321. doi:10.1093/toxsci/kfi270.
- Thomsen, L. B., A. Burkhart, and T. Moos. 2015. “A Triple Culture Model of the Blood-Brain Barrier Using Porcine Brain Endothelial Cells, Astrocytes and Pericytes.” Plos One 10 (8):e0134765. doi:10.1371/journal.pone.0134765.
- Tiffany-Castiglion, E., and Y. Qian. 2001. “Astroglia as Metal Depots: Molecular Mechanisms for Metal Accumulation, Storage and Release.” Neurotoxicology 22:577–592. doi:10.1016/S0161-813X(01)00050-X.
- Tolaymat, T. M., A. M. EL Badawy, A. Genaidy, K. G. Scheckel, T. P. Luxton, and M. Suidan. 2010. “An Evidence-based Environmental Perspective of Manufactured Silver Nanoparticle in Syntheses and Applications: A Systematic Review and Critical Appraisal of Peer-reviewed Scientific Papers.” Science of the Total Environment 408 (5):999–1006. doi:10.1016/j.scitotenv.2009.11.003.
- Varma, V. R., S. A. N. Varma, Y. T. J. Hohman, S. Seddighi, R. Casanova, A. Beri, E. B. Dammer, et al. 2017. “Alpha-2 Macroglobulin in Alzheimer's Disease: a Marker of Neuronal Injury through the RCAN1 Pathway.” Molecular Psychiatry 22 (1):13–23. doi:10.1038/mp.2016.206.
- Verano-Braga, T., R. Miethling-Graff, K. Wojdyla, A. Rogowska-Wrzesinska, J. R. Brewer, H. Erdmann, and F. Kjeldsen. 2014. “Insights into the Cellular Response Triggered by Silver Nanoparticles Using Quantitative Proteomics.” ACS Nano 8 (3):2161–75. doi:10.1021/nn4050744.
- Veronesi, B., O. Makwana, M. Pooler, and L. C. Chen. 2005. “Effects of Subchronic Exposures to Concentrated Ambient Particles. VII. Degeneration of Dopaminergic Neurons in Apo E-/- Mice.” Inhalation Toxicology 17 (4-5):235–241. doi:10.1080/08958370590912888.
- Vizcaino, J. A., R. G. Cote, A. Csordas, J. A. Dianes, A. Fabregat, J. M. Foster, J. Griss, et al. 2013. “The PRoteomics IDEntifications (PRIDE) Database and Associated Tools: Status in 2013.” Nucleic Acids Research 41:D1063–D1069. doi:10.1093/nar/gks1262.
- Weiss, N., F. Miller, S. Cazaubon, and P. O. Couraud. 2009. “The Blood-brain Barrier in Brain Homeostasis and Neurological Diseases.” Biochimica Biophysica Acta 1788 (4):842–857. doi:10.1016/j.bbamem.2008.10.022.
- Witsch-Baumgartner, M., J. Loffler, and G. Utermann. 2001. “Mutations in the Human DHCR7 Gene.” Human Mutation 17 (3):172–182.
- Xu. L., M. Dan, A. Shao, X. Cheng, C. Zhang, R. A. Yokel, T. Takemura, N. Hanagata, M. Niwa, and D. Watanabe. 2015. “Silver Nanoparticles Induce Tight Junction Disruption and Astrocyte Neurotoxicity in a Rat Blood-brain Barrier Primary Triple Coculture Model.” International Journal of Nanomedicine 10:6105–6118.
- Yan, X., H. Shen, H. Jiang, D. Hu, J. Wang, and X. Wu. 2018. “YXQ-EQ Induces Apoptosis and Inhibits Signaling Pathways Important for Metastasis in Non-Small Cell Lung Carcinoma Cells.” Cellular Physiology and Biochemistry 49 (3):911–919. doi:10.1159/000493223.
- Yoo, M. H., X. Gu, X. M. Xu, J. Y. Kim, B. A. Carlson, A. D. Patterson, H. Cai, V. N. Gladyshev, and D. L. Hatfield. 2010. “Delineating the Role of Glutathione Peroxidase 4 in Protecting Cells against Lipid Hydroperoxide Damage and in Alzheimer's Disease.” Antioxidants & Redox Signaling 12 (7):819–827. doi:10.1089/ars.2009.2891.
- Zemolin, A. P., D. F. Meinerz, M. T. de Paula, D. O. Mariano, J. B. Rocha, A. B. Pereira, T. Posser, and J. L. Franco. 2012. “Evidences for a Role of Glutathione Peroxidase 4 (GPx4) in Methylmercury Induced Neurotoxicity in Vivo.” Toxicology 302 (1):60–67. doi:10.1016/j.tox.2012.07.013.
- Zhang, H., K. J. A. Davies, and H. J. Forman. 2015. “Oxidative Stress Response and Nrf2 Signaling in Aging.” Free Radical Biology &Amp; Medicine 88 (Pt B):314–336.
- Zhang, J., and Q. Liu. 2015. “Cholesterol Metabolism and Homeostasis in the Brain.” Protein &Amp; Cell 6 (4):254–264.
- Zhang, L. H., X. Wang, M. Stoltenberg, G. Danscher, L. Huang, and Z. Y. Wang. 2008. “Abundant Expression of Zinc Transporters in the Amyloid Plaques of Alzheimer's Disease Brain.” Brain Research Bulletin 77 (1):55–60. doi:10.1016/j.brainresbull.2008.03.014.
- Zhang, L. H., X. Wang, Z. H. Zheng, H. Ren, M. Stoltenberg, G. Danscher, L. Huang, M. Rong, and Z. Y. Wang. 2010. “Altered Expression and Distribution of Zinc Transporters in APP/PS1 Transgenic Mouse Brain.” Neurobiology of Aging 31 (1):74–87. doi:10.1016/j.neurobiolaging.2008.02.018.
- Zhang, X., C. Lv, Y. An, Q. Liu, H. Rong, L. Tao, Y. Wang, Y. Wang, and R. Xiao. 2018. “Increased Levels of 27-Hydroxycholesterol Induced by Dietary Cholesterol in Brain Contribute to Learning and Memory Impairment in Rats.” Molecular Nutrition & Food Research 62
- Zhang, X., Y.-L. Ye, H. Zhu, S.-N. Sun, J. Zheng, H.-H. Fan, H.-M. Wu, S.-F. Chen, W.-H. Cheng, and J.-H. Zhu. 2016. “Selenotranscriptomic Analyses Identify Signature Selenoproteins in Brain Regions in a Mouse Model of Parkinson's Disease.” PLoS One 11 (9):e0163372. doi:10.1371/journal.pone.0163372.