
Abstract
The effects of two graphene-based materials (GBMs), few-layers graphene (FLG) and graphene oxide (GO), were studied in the aeroterrestrial green microalga Trebouxia gelatinosa. Algae were subjected to short- and long-term exposure to GBMs at 0.01, 1 and 50 μg mL − 1. GBMs internalization after short-term exposures was investigated with confocal microscopy, Raman spectroscopy and TEM. Potential negative effects of GBMs, compared to the oxidative stress induced by H2O2, were verified by analyzing chlorophyl a fluorescence (ChlaF), expression of stress-related genes and membrane integrity. Effects of up to 4-week-long exposures were assessed analyzing growth dynamics, ChlaF and photosynthetic pigments. GBMs were not observed in cells but FLG was detected at the interface between the cell wall and plasma membrane, whereas GO was observed adherent to the external wall surface. FLG caused the down-regulation of the HSP70-1 gene, with the protein levels remaining stable, whereas GO had no effect. In comparison, H2O2 produced dose- and time-dependent effects on ChlaF, gene expression and HSP70 protein level. Long-term exposures to GBMs did not affect growth dynamics, ChlaF or photosynthetic pigment contents, indicating that the few observed short-term effects were not dangerous on the long-term. Results suggest that interactions between FLG and plasma membrane were harmless, activating a down-regulation of the HSP70-1 gene similar to that induced by H2O2. Our work shows that studying GBMs effects on non-model organisms is important since the results of model green microalgae are not representative of the whole taxonomic group.
Introduction
Graphene is a two-dimensional, single layer sheet of carbon atoms organized in a hexagon-structure (Novoselov et al. Citation2012), that drew much attention in the research and industrial world since its discovery for its exceptional properties, such as high mechanical strength, electronic and thermal conductivity, and impermeability to gases (Gogotsi Citation2015; Ferrari et al. Citation2015). The importance of graphene and graphene-based materials (GBMs; Bianco et al. Citation2013) on everyday life is rising exponentially, because the unique characteristics of GBMs allow the production of composite materials, suitable for the most diverse applications (Ciriminna et al. Citation2015; Fadeel et al. Citation2018). The estimated annual production of graphene will increase from around 120 tons in 2015 to 1000 tons by 2019, with investments for ∼400 million $ by 2020 (Ghaffarzadeh Citation2016).
From the environmental point of view, the large-scale production of GBMs, the wearing out of graphene-enriched products, and the poor disposal of the derived waste might result in a significant release of GBMs in terrestrial and aquatic habitats, as already occurred for other materials such as plastics (Horton et al. Citation2017; Law Citation2017). Although the importance of this subject has been recognized in many occasions (Hu and Zhou Citation2013; Kulkarni Citation2015; Hazeem et al. Citation2017), the potential effects of GBMs on living organisms are still not sufficiently understood (Jastrzębska and Olszyna Citation2015). So far, the ecotoxicity of GBMs has been tested mostly on bacteria and animals (Montagner et al. Citation2016), but in our opinion special attention should be given to photoautotrophs, as these are responsible for primary production in both aquatic and terrestrial ecosystems (Haeder et al. Citation2014; Pan et al. Citation2014) – a negative effect of GBMs on primary producers could have quite critical consequences for the environment.
Green microalgae have frequently been used as target organisms for testing the toxicity of different types of nanoparticles (Bondarenko et al. Citation2013; Suppi et al. Citation2015; Roy et al. Citation2016; Oukarroum et al. Citation2017). Some studies, based mostly on short-term exposure (Pretti et al. Citation2014; Nogueira et al. Citation2015; Tang et al. Citation2015), have actually focused on the effects of GBMs, but no consistent toxicity trends can be inferred. In general, the microalgae used in these tests (e.g. Chlorella vulgaris, Scenedesmus obliquus and Raphidocelis subcapitata, see Nogueira et al. Citation2015; Ouyang et al. Citation2015; Zhang et al. Citation2018), are model species from freshwater environments, whereas no aeroterrestrial microalga has been tested so far, to the best of our knowledge.
Aeroterrestrial microalgae are a small group of polyphyletic origin, naturally occurring on wet soils, rocks, bark and man-made materials, with relevance to the nutrient cycling and biodiversity richness of terrestrial environments (Karsten et al. Citation2007; Freystein and Reisser Citation2010; Lüttge and Büdel Citation2010). Some of them (e.g. the genus Trebouxia, with c. 30 species) form stable symbiotic associations with fungi through lichenization (Muggia et al. Citation2016). Furthermore, they generally live under harsher, more variable environmental conditions than their aquatic counterparts, which are not exposed to the abrupt changes in radiation and temperature typical of aeroterrestrial habitats (Gorbushina and Broughton Citation2009). Most aeroterrestrial microalgae can in fact survive high UV-radiation levels, temperature extremes and prolonged periods without liquid water (Yancey et al. Citation1982; Potts Citation1994), often being desiccation tolerant (Holzinger and Karsten Citation2013). Their ability to cope with environmental stresses depends on a variable mixture of tolerance vs avoidance mechanisms (Bertuzzi et al. Citation2017). From this point of view, aeroterrestrial microalgae represent a very interesting subject for ecotoxicological studies, because they could reveal new tolerance mechanisms that might be genetically engineered into other, more sensitive organisms.
Here we tested two GBMs, few-layers graphene (FLG) and graphene oxide (GO) (selected as reference materials in the framework of the European Graphene-Flagship, Bianco and Prato Citation2015), on a representative species of the genus Trebouxia, T. gelatinosa Archibald. Short- and long-term exposures to GBMs were implemented to mimic the interactions of an aeroterrestrial microalga with the mineral fraction of its environment, with the aim of verifying (i) if cellular internalization of GBMs occurred and (ii) the effects of FLG and GO on T. gelatinosa ultrastructure, physiology and expression of stress-related genes.
Materials and methods
GBM preparation and characterization
FLG was prepared by the ball-milling treatment, according to León et al. (Citation2016). A mixture of graphite (7.5 mg of SP-1 graphite powder, from Bay Carbon, USA), and melamine (22.5 mg of 1,3,5-triazine-2,4,6-triamine, from Sigma-Aldrich, D) was ball-milled at 100 rpm for 30 min using a Retsch PM 100 (Retsch Technology, D) planetary mill. The resulting solid mixture was dispersed in 20 mL bi-distilled water and sonicated for 1 minute. Melamine was afterwards eliminated by dialysis. The precipitate, i.e. poorly exfoliated graphene, was removed from the liquid fraction after stabilization for 5 days. After physico-chemical characterization, the FLG water dispersion was used in a first series of experiments whereas other aliquots were lyophilized until use. This latter material, when resuspended in distilled water, did not show any difference with the original liquid fraction, as shown by a further physico-chemical characterization (data available upon request).
GO produced by oxidation of carbon fibers (GANF Helical-Ribbon Carbon Nanofibres, GANF®) with sodium nitrate in sulfuric acid at 0 °C was purchased from Grupo Antolin Ingeniería (Burgos, E).
Thermogravimetric analysis (TGA) of both GBMs were performed with a TGA Q50 (TA Instruments, USA) at 10 °C per minute under nitrogen atmosphere, from 100 °C to 800 °C.
Zeta potentials of FLG and GO were performed using a BIC 90Plus analyzer (Brookhaven Instruments, USA) at 25 °C. Materials were dissolved in MilliQ water adjusting the pH to the different levels.
Raman analysis of both GBMs was performed with an inVia Raman Microscope (Renishaw, UK). The dispersions were drop-cast onto a Si wafer and dried on a hot plate. At least 30 Raman measurements on both materials were collected in different locations at 532 nm with a 100× objective and an incident power of 1% (1 mW µm−2).
Quantitative elemental analyses of FLG and GO were performed with a LECO CHNS-932 (LECO Corporation, USA) elemental analyzer for C, H, N and O, and with an Optima 8000 inductive coupled plasma - atomic emission spectrometer (PerkinElmer, USA), equipped with an S10 Autosampler for Cd, Cr, Cu, Pb, Mn, K. The content of toxic elements was checked in 1.0 mL of FLG suspension (0.09 mg mL−1) or 0.5 mL of GO suspension (0.5 mg mL−1) mixed with 5 mL of freshly prepared Aqua Regia, heated at boiling point for one hour, then diluted to 10 mL with MilliQ water and filtered through a GHP Acrodisc (Pall Corporation, USA) syringe filter (pore size: 0.45 μm). The limits of detection (LOD) are listed in Supplementary Table S1.
GBMs were also characterized with a JEM 2100 (JEOL Ltd, JP) high-resolution transmission electron microscope (HRTEM). Stable dispersions of both materials were drop-cast on nickel grids (3 mm, 200 mesh), dried under vacuum, and observed at an accelerating voltage of 200 kV. Lateral dimension distribution of GBMs was calculated with Fiji software.
Cultures of T. gelatinosa apophotobiont
Trebouxia gelatinosa isolated following Yamamoto et al. (Citation2002) from Flavoparmelia caperata (L.) Hale was grown and subcultured every 4 weeks on solid Trebouxia Medium (TM; 1.5% agar) (Ahmadjian Citation1973) in Microbox Junior 40 vessels (Duchefa Biochemie, NL). The vessels were turned upside down and placed in a thermostatic chamber at 18 ± 1 °C, 20 ± 2 μmol photons m−2 s−1 and a light/dark regime of 14/10 h. Reference algal material was cryo-conserved according to Dahmen et al. (Citation1983).
Due to the external coat of mucilaginous substances, T. gelatinosa forms dense aggregates (‘nomen omen’). For the experiments, in order to disaggregate these clusters and obtain homogeneous suspensions, cells from 4- week-old colonies suspended in distilled water were gently extruded from a syringe through a sterile 40 µm sieve.
Experimental design
The effects of GBMs were investigated by subjecting the algae to short- vs. long-term exposures. In the former, GBM internalization, modification of gene expression profiles, and membrane damage were analyzed. In the latter, the effects of two different GBM exposure modalities were assessed by studying growth dynamics (in terms of absolute cell number per colony or total chlorophyl content) on solid media. In both series of experiments, the maximum quantum efficiency of PSII photochemistry (Fv/Fm) was measured as a proxy of algal vitality. Three standard GBM concentrations were tested, i.e. 0.01, 1, and 50 µg mL−1. Since these concentrations reflect the expected range of GBMs released into the environment (Doudrick et al. Citation2012), they should also be ecologically relevant.
Short-term exposure to GBMs
Suspensions of disaggregated cells were poured into thirteen 1.5 mL Eppendorf tubes (samples) with pierced lids; one sample was left untreated (pre-treatment), whereas the other twelve were spin-centrifuged to separate the cells from the supernatant (1.3 mL), which was discarded. From then on, treatments were conducted in the dark to avoid photo-oxidative stress and to dark adapt the samples, a condition required to measure Fv/Fm immediately after the treatment (see infra). To the samples were then added 1.3 mL of aqueous suspensions of FLG or GO to the final concentration of 50 µg mL−1, or of distilled water (negative control). Hydrogen peroxide (H2O2) at a final concentration of 0.05 M, 0.5 M, 0.8 M was added to other samples as a positive control, as GBMs are known to cause oxidative stress at cell level (Yan et al. Citation2013). These H2O2 concentrations, as well as the exposure times, had been defined in a series of preliminary experiments, showing that H2O2 concentrations lower than those applied here do not cause damage to T. gelatinosa. The samples were then placed on a shaker and each sample was removed for the analyses after 10 or 30 min. The procedure was repeated six times and for each repetition three biological replicates were processed. After the short-term exposures, sub-aliquots of the samples were collected for the GBM internalization assessment, whereas the remaining material was vacuum filtered over (i) polytetrafluoroethylene (PTFE) membranes (25 mm diameter, pore size 0.1 µm, Merck, D) for membrane damage assessment or (ii) cellulose acetate (CA) membranes for Fv/Fm measurements. The latter were then shock-frozen in liquid N2 and stored at −80 °C for gene expression and protein level assessments.
In-vivo GBMs internalization assessment
Confocal laser scanning microscopy (CLSM): Sub-aliquots (10 μL) of algal suspensions prepared as described above were placed on PolysineTM Microscope Adhesion Slides (Thermo Fisher Scientific, USA), and observed in-vivo with a CLSM Nikon C1-si (Nikon, JP). To visualize GBM sheets, the microscope was used in reflection mode (Bramini et al. Citation2016) – samples were illuminated with a 514 nm laser set at an intensity of 0.2% (for FLG) and 0.5% (for GO), since the two types of GBMs have different light reflection capacity. Reflected light was detected by a 525/50 band pass filter. Algal cells were visualized with a 488 nm laser (12% intensity), acquiring chlorophyll autofluorescence with a 650 long pass filter (λ > 650 nm). One to three fields were acquired for each replicate (n = 4). A variable number of focal planes (stacks), depending on algal abundance and dimension of the GBM sheets, were acquired for each field. In total, more than 1300 cells were analyzed. Acquisitions were elaborated with the Nikon EZ-C1 FreeViewer software (Nikon, JP) and with the ImageJ 1.46r (NIH, USA) freeware suite. A unification algorithm (Z-projection) was applied to merge stacks into bi-dimensional images, and 3 D reconstructions were obtained with the ImageJ 3 D viewer plug-in.
Raman spectroscopy: A sub-aliquot (10 μL) of algal suspensions prepared as above was vacuum filtered on a CA membrane (10 µm pore size), and the algae were gently washed with 50 mL of distilled water to remove the floating GBMs. Algal cells were then immediately resuspended with 500 µL of distilled water, and three drops of 40 µL each were poured on PolysineTM Microscope Adhesion Slides (Thermo Fisher Scientific, USA), which were put into a 50 mL Falcon tube and immediately frozen in liquid N2, and freeze-dried for 24 h. Raman spectra were recorded with an inVia Raman Microscope (Renishaw, UK) equipped with a 532 nm point-based laser. At first, confocal mode was used to collect Raman spectra at defined x,y coordinates and at different depths within the samples. However, during the acquisition of a series of spectra at the same coordinates, cells were progressively destroyed by the laser. To overcome this, samples were measured with a fixed exposure time of 1 s using the objective 50×, 10 accumulations and three different laser power densities (0.6, 3 and 6 mW µm−2) to penetrate at different levels into the cell.
Transmission electron microscopy (TEM): Samples exposed to GO or to FLG at 50 µg mL−1 plus controls were fixed with a solution of 2% paraformaldehyde, 2.5% glutaraldehyde, 0.1 M sucrose in phosphate buffered saline (PBS) at pH 7.2 for 90 min at room temperature. The cells were then rinsed in PBS with 0.1 M sucrose (60 min). The samples were post-fixed in 2% OsO4 and 0.1 M sodium cacodylate buffer pH 7.4 for 2 h. They were then washed three times for 15 min with the buffer and dehydrated in a graded series of ethanol (30, 50, 70, 80, 90, 96 and 100%) for no less than 20–30 min for each step. The samples were embedded in epoxy resin (Epon 812, TAAB) according to the manufacturer’s instructions and 80 nm thick sections were collected on copper mesh grids, using an EM UC6 ultramicrotome (Leica, D), for observation with a JEM-1011 electron microscope operating at 100 kV and equipped with an ORIUS SC1000 CCD camera (Gatan, USA). For each experimental condition, at least 10 images from three samples were acquired at a maximum magnification of 15,000×.
RNA isolation, cDNA synthesis and qRT-PCR
RNA was extracted following Banchi et al. (Citation2018) from one sample per treatment, which was obtained by randomly pooling three replicates per treatment, each one from an independent experiment (n = 6). The expression of eight different transcripts, four coding for antioxidant enzymes and four for stress-related proteins was measured by qRT-PCR following Banchi et al. (Citation2018). The primers used are listed in Supplementary Table S2.
Proteins isolation and HSP70 immunodetection
From three pooled replicates of T. gelatinosa, frozen culture protein isolation and HSP70 immunodetection were performed according to Banchi et al. (Citation2018).
Assessment of membrane damage
This was evaluated measuring potassium (K+) release. Suspensions of disaggregated algae were gently washed with MilliQ water through a vacuum filtration system to remove ions derived from the culture medium and a suspension was prepared as described above. This was then subdivided into samples that were supplemented with FLG or GO to a final concentration of 50 µg mL−1, and gently shaken on an orbital shaker for 30 or 60 min together with control samples without GBM. After treatment, GBM-exposed and control samples were vacuum filtered on PTFE membranes. 1.0 mL of pre-exposure samples containing only algal cells was mixed with 1 mL of HNO3 (69.5% v/v), heated for one hour, diluted to 10.0 mL with MilliQ water, filtered through a GHP Acrodisc syringe filter (pore size 0.45 μm) and analyzed by ICP-OES. A calibration curve was obtained by diluting a standard solution for ICP-OES analyses (Sigma-Aldrich, USA) in the 0–10 mg L−1 range. The precision of the measurements was always less than 5%, as determined using relative standard deviation. LOD at 766.49 nm was 0.010 mg L−1. Potassium concentrations were expressed on silica-dry mass of algal material.
Long-term exposure to GBMs
Effect of GBMs on growth dynamics
Suspensions of disaggregated algae (10−4 cells mL−1) were prepared according to OECD (Citation2011) protocol no. 201, opportunely modified because T. gelatinosa typically grows on solid substrata. The suspensions were supplemented with GBMs to the final concentrations of 0.01, 1, or 50 µg mL−1 and shaken for 30 min. Afterwards, the suspensions were filtered on PTFE membranes, laid on solid BBM at the bottom of Microbox Junior 40 vessels. Seven inoculated membranes corresponding to three concentrations of each of the two GBMs, plus one negative control, (i.e. untreated algae without GBM) were introduced into each vessel. All of these vessels were kept in a thermostatic chamber as described above. The growth dynamics were followed by counting cells either immediately after vacuum-filtration (T0) or after 2, 4, 8 and 16 days (T1–4), directly on each membrane. Eighteen randomly selected fields per membrane, representing 2.3% of the total area, were examined at 200 × with a Zeiss Axioplan (Zeiss, D) light microscope. This experiment was repeated three times. The high hydrophobicity of FLG did not allow to count the cell density of colonies exposed to 50 µg mL−1.
Comparison of two alternative GBMs exposure modalities
Disaggregated cells were exposed to FLG or GO following two different modalities: in the first treatment (‘deposited’, D), the graphene suspension was vacuum-filtered on PTFE membranes, let to dry out and then 50 µL of algal suspension were filtered onto the deposited graphene. In the second treatment (‘shaken’, S), a suspension of algal cells and graphene was prepared, shaken for 30 min and directly vacuum-filtered onto PTFE membranes.
Seven inoculated membranes corresponding to the six treatments (0.01S, 1S, 50S, 0.01 D, 1 D, 50D) of one type of GBM, plus one negative control (i.e. untreated algae without GBM) were laid onto solid BBM in Microbox Junior 40 vessels, and kept in growth chambers as described above. The 4-week-old colonies were then used to measure ChlaF emission, and subsequently to extract their photosynthetic pigments.
The influence of melamine on algal growth was tested in parallel experiment by exposing 50 µL of an algal cell suspension to 0.01 or 0.5 µg mL−1 melamine, corresponding to the quantity present in the 1 and 50 μg mL−1 FLG suspensions. These were deposited by vacuum filtration onto CA membranes and let grow alongside control samples as previously described.
Measurement of total pigments contents
Photosynthetic pigments were measured spectrophotometrically following Tretiach et al. (Citation2007) using crude extracts in dimethyl sulfoxide (DMSO, Merck, D, 1.2–5 mL per colony according to preliminary tests). The absorbance of the supernatant was measured at 750, 665, 658 and 480 nm using a Jenway 7315 UV/VIS spectrophotometer (Bibby, UK). Chlorophyll and total carotenoid content were calculated according to Wellburn (Citation1994).
Chlorophyll a fluorescence measurements (ChlaF)
ChlaF measurements were acquired on a Handy-PEA photosynthetic efficiency analyzer (Hansatech, UK) according to Banchi et al. (Citation2018), using algal samples after a 30 min dark adaptation period before or after the short-term exposures, or at the end of the long-term exposures. ChlaF measurements on the former cells were conducted on a mixture of old and young cells (as the colony was resuspended and shaken before filtering on the membrane), those on the latter were conducted on the uppermost layer of intact colonies, which mostly consist of young cells. This explains possible differences between the respective Fv/Fm values.
Statistics
Descriptive statistics were performed using R 3.2.0 (R Development Core Team Citation2015). The non-parametric Kruskal–Wallis test and Wilcoxon non-paired test were both applied to verify the significance of differences for ChlaF, K+ leakage, total pigments and culture growth dynamics. A one-way ANOVA followed by a Fisher's LSD post-hoc test was applied to verify significant differences between the relative abundancy of transcripts and HSP70 protein content in treated versus control samples. Figures were produced with Sigmaplot 10.0 (Systat Software, USA), with values generally expressed as means ± standard deviation.
Results
GBM characterization
In both GBMs Cd, Cr, Cu and Pb were below LOD. The concentrations of K and Mn were respectively 1.4 and 0.3 mg g−1 in FLG and 1.8 and 4.2 mg g−1 in GO. The value of %N in FLG () corresponds to a melamine content of 0.84 wt %. These results agree with those of the TGA analyses for both materials - a weight loss of 6.4% was observed in the case of FLG, corroborating the low quantity of oxygen groups generated by the exfoliation process, while a weight loss of 46% was obtained from TGA analysis of GO ().
Figure 1. Physico-chemical characterization of tested materials, few-layer graphene (FLG) and graphene oxide (GO): thermogravimetric analysis (a); average Raman spectra (b); elemental analysis (c); lateral size distribution of sheets (n = 100) (d); representative TEM images of FLG (e, bar = 200 nm) and GO (f, bar = 500 nm) sheets.
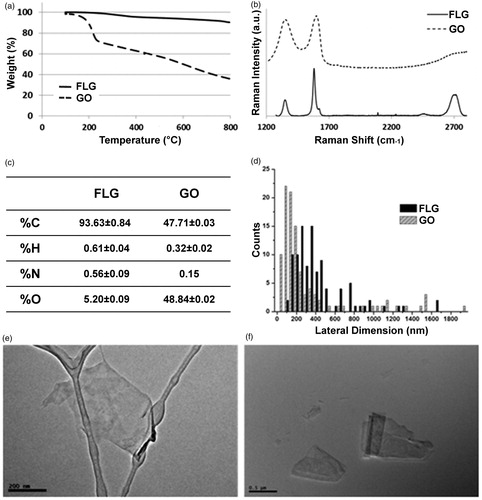
Regarding zeta potential, GO showed good stability at pH from 6 to 12, while FLG values suggest lower stability (ASTM Citation1985, Supplementary Figure S1). These results are in agreement with the oxidation level of the different graphene materials (Krishnamoorthy et al. Citation2013).
The differences between the Raman spectra of FLG and GO underline the contrast between these derivatives (). FLG shows the two most intense peaks of graphene, the G band and the 2 D peak, which appear at ∼ 1580 cm−1 and 2700 cm−1, respectively. The average I(2D)/I(G) ratio is 0.49, consistent with few-layer graphene, usually assigned an I(2D)/I(G) < 1 (Ferrari et al. Citation2006; Mogera et al. Citation2015). When graphene is affected by defects, a peak appears at ∼1345 cm−1 (D band). In this case, the average spectrum of FLG shows an I(D)/I(G) ratio of about 0.36, confirming a low level of defects, which are attributable to the edges of the micrometer sheets (Torrisi et al. Citation2012). The average Raman spectrum of GO, in contrast, shows broad D and G bands. In addition, a bump can be observed in this spectrum instead of the usual 2 D band common to graphene structures.
TEM analysis showed higher lateral dimensions for FLG sheets compared to GO sheets. Lateral size distributions of both GBMs are shown in (n = 100), with representative TEM images of FLG and GO in and , respectively.
Effects of short-term exposure to GBMs
GBM internalization assessment
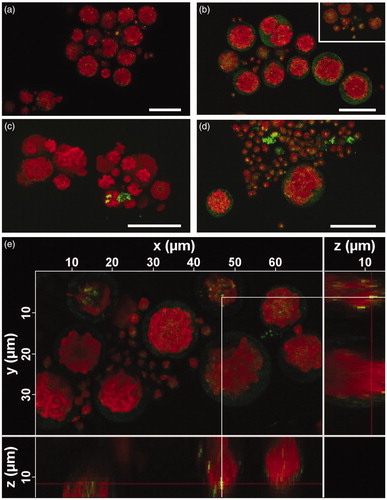
The cell wall of T. gelatinosa observed at CLSM reflected a faint light when illuminated by the laser (), especially with the setup used for the visualization of GO (). In the autospores (diam. < 7 μm), light was reflected also from a single defined spot, not present in adult cells, which was observed in both controls and treated samples (). The light-reflecting spots of the cell walls made impossible to distinguish very small GBM sheets (≲500 nm), possibly present within the cells. On the other hand, larger GBM sheets were clearly distinguishable by the more intense light reflection () and were repeatedly observed adhering to the cell walls (). FLG sheets were also observed within the cell wall (), but never in the cytoplasm of the cells.
Figure 2. Cells of Trebouxia gelatinosa observed by confocal laser scanning microscopy in reflection mode. Cells before the short-term exposure observed with FLG setting (a) and GO setting (b); after the 30-minute-long exposure to 50 µg mL−1 FLG (c) or GO (d); 3D reconstruction of cells after the 30-minute-long exposure to 50 µg mL−1 FLG with FLG setting (e). Red signal: autofluorescence of chlorophylls; weak green signal reflected by algal cell walls (b,d); strong green signal reflected by FLG (c,e) or GO (d) sheets.
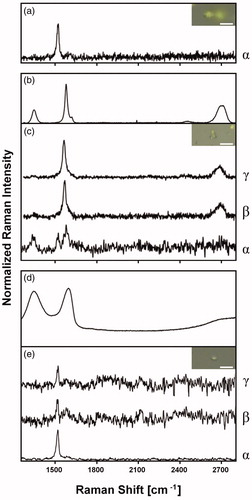
In the Raman spectra of GBM-free algae two peaks were observed, at ∼1200 and ∼1525 cm−1 (), corresponding to β-carotene (Samek et al. Citation2010), an accessory photosynthetic pigment typical of oxygenic photoautotrophs. In the samples exposed to FLG, the typical Raman bands of this nanomaterial () were observed together with the peak of β-carotene, indicating their co-occurrence in the same measurement spot (). The Raman bands of FLG became more prominent when the power density was increased to 3 or 6 mW µm−2 in the same cell point (), which could indicate that FLG was present at deeper levels within the cytoplasm. No typical Raman bands of GO () were observed at any power density in any part of the samples that had been treated with this nanomaterial, when properly rinsed in distilled water ().
Figure 3. Raman spectra and respective Raman images (bar = 10 µm) of Trebouxia gelatinosa after short-term exposure to 50 µg mL−1 GBMs. Representative Raman spectrum of GBMs-free algae (a); few-layers graphene (FLG) (b); water-washed, FLG-exposed algae (c); graphene oxide (GO) (d); water-washed, GO-exposed algae (e). Power density (mW µm−2): 0.6 (α); 3.0 (β); 6.0 (γ).
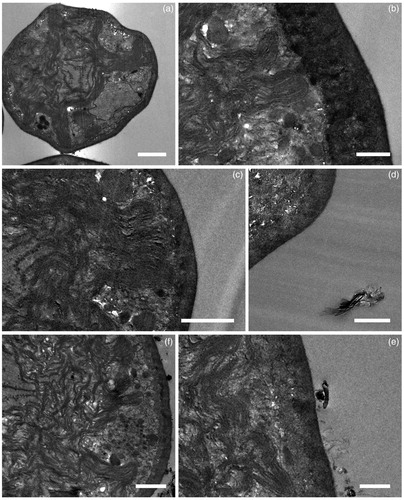
TEM images of T. gelatinosa () revealed that this round-shaped alga has a very thick cell wall, c. 180 nm across in young autospores and up to 900 nm in mature cells. The cytoplasm is rather scarce in this species, in comparison to other green algae, as most of the cellular volume is occupied by a prominent, multi-lobed chloroplast, with pyrenoid bodies of gelatinosa type (Friedl Citation1989). In GBM treated algae, no plasmolysis was observed, the ultrastructure was fully preserved and neither sheets nor aggregates were detected in the cytoplasm or in the chloroplast, independently of cell age. In particular, FLG was not observed adhering to the cell-walls being mostly dispersed in the resin (). Conversely, GO was frequently observed also adhering to the external surface of the cell wall ().
Figure 4. Micrographs of Trebouxia gelatinosa observed by TEM. Samples resuspended for 30 min in distilled H2O (a,b) and 50 μg mL−1 FLG (c,d) or GO (e,f). Bar = 1000 nm in (a,c–f); 500 nm in (b,f).
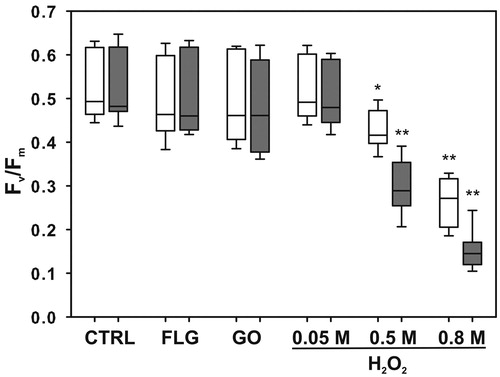
Effects of short-term exposure to GBMs and H2O2 on the maximum quantum yield of primary photochemistry (Fv/Fm)
Fv/Fm values measured in control samples just resuspended in water (0.514 ± 0.068) did not change significantly after the 10- or 30-minute-long shaking (0.522 ± 0.075 and 0.518 ± 0.079, respectively), suggesting that cell viability was not affected. No significant differences were observed in samples exposed to FLG or GO (). Samples exposed to H2O2 concentrations above 0.05 M instead had significantly lower Fv/Fm (). At 0.5 M and 0.8 M, it decreased to 80% (p = 0.00132) and 50% (p = 4.5e-06) of the control values, respectively, after 10 min exposure, and further to 50% (p = 6.3e-06) and 30% (p = 6.6e-09), respectively, after 30 min exposure.
Figure 5. Maximum quantum yield of PSII photochemistry (Fv/Fm) measured in Trebouxia gelatinosa resuspended for 10 (white bars) and 30 (gray bars) min in distilled H2O (CTRL), H2O2 solutions (0.05 M, 0.5 M and 0.8 M) and GBMs suspensions (FLG or GO; 50 μg mL−1). Boxplots report median, 25°–75° percentiles (boxes) and non-outlier minimum and maximum (whiskers). *p ≤ 0.05, **p ≤ 0.01, (n = 18).
Effects of GBMs and H2O2 on expression of stress-related genes
Samples exposed to GBMs for 10 min did not modify the expression level of any of the measured gene (), whereas 30 min exposure to FLG significantly affected the transcription level of HSP70-1, which was reduced to 35% of the control value ().
Figure 6. Fold change in the expression of 8 transcripts obtained with qRT-PCR in cultures of Trebouxia gelatinosa treated with H2O2 (0.05 M, 0.5 M and 0.8 M) or GBMs (FLG or GO; 50 μg mL−1) compared to the respective controls (dotted line) after 10 (a) and 30 (b) min of exposure. APX: ascorbate peroxidase; CAT: catalase; GR: gluthatione reductase; Mn-SOD: manganese superoxide dismutase; DRP11: desiccation related proteins 11; HSC70: heat shock cognate 70; HSP70-1: heat shock protein 70 1; LHCII: chlorophyll a-b binding protein of the light harvesting complex II. *p ≤ 0.05, **p ≤ 0.01 (n = 3).
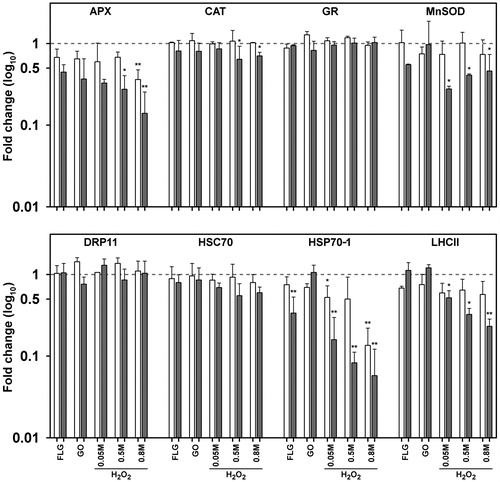
Samples exposed to H2O2 had their APX and HSP70 transcripts levels progressively reduced; after 30 min at 0.8 M, APX and HSP70 decreased to ∼35% and to 15% of their control values, respectively (). Similarly, the transcription levels of CAT and LHCII after 30 min at the highest H2O2 concentration were significantly reduced to 65% and 20%, respectively. GR, HSC70 and DRP11 remained steady, independently of the H2O2 concentrations (). Conversely, H2O2 had an opposite effect on the Mn-SOD transcription levels, i.e. the strongest (down to ∼25%) and lowest decreases (down to ∼60%) were observed at the lowest and at the highest H2O2 concentrations, respectively (). HSP70-1 showed the most severe decrease amongst all the considered transcripts, so that at the highest H2O2 concentration transcription was effectively completely inhibited (1%).
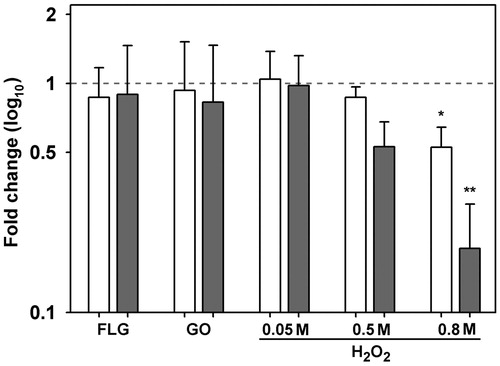
Effects of GBMs and H2O2 on HSP70 protein levels
The level of HSP70 protein was not affected by any GBM treatment, while a significant decrease was detected at 0.8 M H2O2 after both exposure times ().
Figure 7. Levels of HSP70 protein in Trebouxia gelatinosa exposed to various concentrations of H2O2 (0.05 M, 0.5 M and 0.8 M) and GBMs (FLG or GO; 50 μg mL−1) compared to the respective controls after 10 (white bars) and 30 (gray bars) min of exposure. *p ≤ 0.05, **p ≤ 0.01 (n = 3).
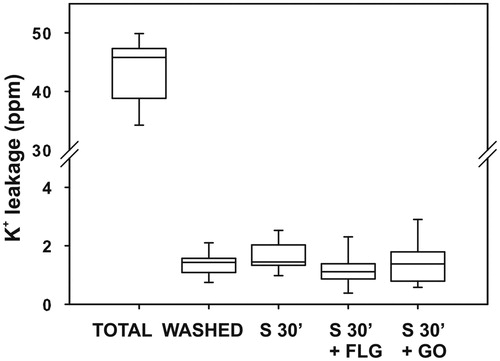
Assessment of membrane damage by potassium leakage
Control samples released 2.5% of the total K+ content. No statistically significant increase was observed in samples after 30 min () or 60 min treatment (Supplementary Figure S2), suggesting that no damage occurred to the cell membranes during short-term exposure to either GBM.
Figure 8. Potassium (K+) leakage in Trebouxia gelatinosa. Total K+ content of pre-exposure samples (TOTAL); K+ leakage from control samples washed but not shaken (WASHED); samples washed and shaken for 30 min without GBMs (S 30’) and with 50 μg mL−1 FLG (S 30’+FLG) or GO (S 30’+GO) (n = 9).
Effect of GBMs exposure on algae growth dynamics
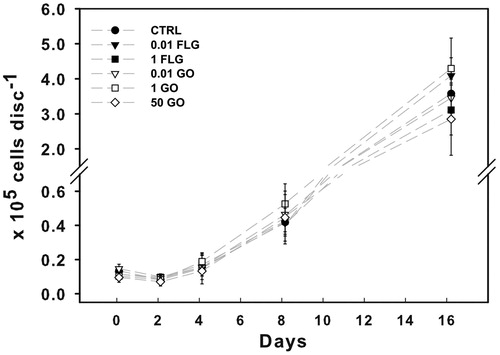
The control population of Trebouxia gelatinosa inoculated on PTFE membranes grew with an exponential rate. It remained steady until the fourth day after the inoculation (1.5 ± 0.9 × 10⁻⁴ cells disc−1; ) and then increased 3 and 25 fold after 8 and 16 days from inoculation, respectively. There were no statistical differences among treatments at the same collection time. Zoosporo- or gametogenesis were observed in control as well as in treated colonies, although cell release was relatively more frequent in the former.
Figure 9. Growth dynamics of Trebouxia gelatinosa grown for up to 16 days over PTFE membranes on solid Trebouxia Medium without (CTRL) or with FLG or GO at 0.01, 1 or 50 μg mL−1 (n = 3).
Effects of long-term exposure to GBMs on Fv/Fm and total pigment content
Mean Fv/Fm value measured in control samples was 0.691 ± 0.005 suggesting that the algae were healthy at the end of the 4-week growth period. Samples grown for the same time-period in close contact to GBMs or in contact with melamine showed no significant differences when compared to the respective control samples (Supplementary Figure S3, S4).
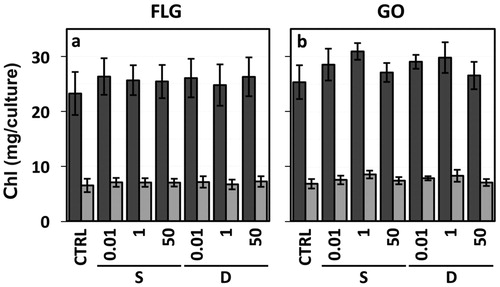
Total chlorophyl and carotenoid content in the 4-week-old T. gelatinosa cultures was 29.7 ± 5.1 and 6 ± 1.1 µg culture−1, respectively, and neither was affected by the exposure modality. This was also the case when comparing the chlorophyll and carotenoid content of GBM or melamine treated samples towards the respective control samples ( and Supplementary Table S3,S4). No statistically significant differences were detected independently of the GBM or melamine concentrations, suggesting that no damage occurred during long-term exposure.
Figure 10. Chlorophyll a (dark gray bars) and b (light gray bars) content measured in 4-week-old colonies of Trebouxia gelatinosa. The cells were exposed to FLG (a) and GO (b) at 0, 0.01, 1, 50 µg mL−1 (CTRL, 0.01, 1, 50 respectively), through the ‘shaken’ and ‘deposit’ treatments (S and D, respectively) (n = 7).
Discussion
GBM internalization
The bioavailability level should always be considered when assessing the environmental toxicity of nanomaterials. A first step is to understand if the nanomaterials can be internalized into a cell, tissue or organ. In our study, small sheets of FLG, but not GO, were observed by CLSM between the cell wall and plasma membrane. Nevertheless, a precise localization was difficult because the dimension of the observed FLG sheets was close to the limit of measurability by that technique (0.5 μm) (), also considering the cell wall thickness of T. gelatinosa. The minimal lateral size dimension of sheets for both GBM batches was ≤ 100 nm (), so that Raman spectroscopy and TEM were used to verify if the smallest sheets crossed the plasma membrane. Raman is commonly used to determine the nature and location of GBMs, i.e. if the sheets are inside a tissue or even inside a cell (Huang et al. Citation2012). In our case it allowed to detect FLG but not GO at a deeper level than the external surface of the cell wall, as the peaks of β-carotene and FLG appeared together (). However, considering that in T. gelatinosa the thylakoid membranes in chloroplasts can be spatially very close (<35 nm) to the plasma membrane (), Raman could not confirm FLG internalization. Furthermore, neither FLG nor GO sheets were observed inside the cells by TEM. Taking all these results together, we suggest that GBMs are not internalized, either actively or passively, either in mature or young T. gelatinosa cells, although small sheets (≤ 500 nm) of FLG, but not of GO, can reach the cell-wall/plasma membrane interface.
Studies by Hu et al. (Citation2014) and Ouyang et al. (Citation2015) reported GBM internalization into the aquatic microalgae Chlorella pyrenoidosa and C. vulgaris. These species differ from T. gelatinosa in the thickness and composition of the cell wall, which varies from ∼ 900 nm in the latter (Archibald Citation1975 and our direct measurements) to only ∼ 20 nm in Chlorella species (Northcote et al. Citation1958; Yamamoto et al. Citation2004), where it represents a weaker barrier to GBM internalization. The cell wall of T. gelatinosa consists of five layers of different composition, ranging from highly packed cellulosic fibrils, to a web of polysaccharides and sporopollenin (König and Peveling Citation1984). Moreover, T. gelatinosa develops a sticky, gelatinous sheath 1.5–2 μm thick outside the cell wall (Archibald Citation1975; Casano et al. Citation2015) that forms an adhesive surface (see ) for the oxygen-rich functional groups spread over the graphene lattice of GO (Amirov et al. Citation2017), thus preventing its internalization.
Short- and long-term exposure
In accordance with the internalization results, short-term exposure to GBMs had no negative effect on the viability of T. gelatinosa, since no permanent or transient effects were observed on Fv/Fm. This is a reliable physiological trait commonly used to verify the status of photosynthetic organisms subjected to stress factors (Murchie and Lawson Citation2013). Exposure to GBMs affected the photosynthetic efficiency in other green microalgae of freshwater environments such as Scenedesmus obliquus and Nitzschia palea, because of mechanical damage, shading effects and/or enhanced ROS production (Du et al. Citation2016; Garacci et al. Citation2017). In our case, the only significant change was the down-regulation of the HSP70-1 transcript () after 30 min of FLG exposure, suggesting a functional interaction with the alga. The presence of FLG at the interface between cell wall and plasma membrane could have activated the signal pathways leading to changes in HSP70-1 expression. This could involve receptors at the plasma membrane level, starting a signal cascade involving intracellular changes in calcium ions. The induction of Ca2+/calmodulin genes followed by transcriptional changes of different HSPs, including HSP70, has already been observed in plants (Wu et al. Citation2012; Zeng et al. Citation2015). The reason for HSP70-1 down-regulation is still unknown, since its transcription is usually triggered by stress factors such as thermal shock, drought, salinity, and acidity (Wang et al. Citation2004; Yu et al. Citation2015; Rana et al. Citation2018). Interestingly, HSP70-1 down-regulation at transcript level has been reported during desiccation (Candotto Carniel et al. Citation2016; Banchi et al. Citation2018) and at the protein level in the congeneric Trebouxia TR1 after exposure to the strong oxidant cumene hydroperoxide (del Hoyo et al. Citation2011). Accordingly, exposure to H2O2 induced a similar down-regulation of HSP70-1 and other stress-related genes (), although this effect did correspond to a decrease in the quantity of HSP70 protein (). Low correlation between mRNA abundance and protein level are common (Maier et al. Citation2009), and usually attributed to post-transcriptional regulation (Liu et al. Citation2016). FLG may have activated the same signaling cascade as H2O2, but only locally (i.e. at the cell wall – plasma membrane interface) and at a lower concentration in respect to those tested here (<0.05 M), and hence affecting only HSP70-1 expression.
Importantly, the plasma membrane was not affected by the presence of FLG or GO, as there was no K+ leakage from the cells after 30 or even 60 min exposure ( and Supplementary Figure S2); these results de facto exclude the occurrence of membrane damage during short-term exposures to GBMs, since the levels of K+ release observed were consistent with intact membranes (Tarhanen et al. Citation1997). Conversely, in other green algae such as Chlamydomonas reinhardtii and Raphidocelis subcapitata, GBM treatments caused membrane damage due to the overproduction of ROS (Nogueira et al. Citation2015; Martín-de-Lucía et al. Citation2018). These differences may be explained considering that (i) in other organisms the ROS unbalance was caused by decoupling of the electron transport chain in mitochondrial lamellae induced by internalized GBMs (Pelin et al. Citation2018), and (ii) Trebouxias are known to be tolerant to oxidative stress, having a strong constitutive antioxidant machinery able to scavenge an ‘oxidative burst’ within minutes after its insurgence (Kranner et al. Citation2008; Candotto Carniel et al. Citation2015). This was further confirmed by our preliminary tests implemented to define H2O2 concentrations sufficient to affect the algae physiology, which revealed the presence of an extracellular catalase whose activity can remove low concentrations of H2O2 before it can exert any negative effect.
The down regulation of HSP70-1 gene observed after short-term FLG exposures was not linked to other undetected effects which might have compromised the algal viability on the long-term. Indeed, on monitoring the growth of algae regularly for 16 days, no effect was detected on growth dynamics, independently of the GBM type or concentration used, with the sole exception of zoospore release, suggesting that GBMs slightly modified (but did not suppress) the generative pattern of the alga, perhaps interfering with light absorption. This is in contrast to the diverse effect of GBMs, especially GO, observed on C. vulgaris; Hu et al. (Citation2014) reported decreasing amounts of chlorophyl a content in samples treated with increasing GO concentrations. These results were however not confirmed by a later work of Hu et al. (Citation2015), which, on the contrary, documented a purported GO influence on cell division, positive after 24 h and negative after 96 h of exposure. Further different results were obtained by Haniff Wahid et al. (Citation2013), who intentionally coated cells of C. vulgaris within two GO layers. They reported a decrease of cell division rate, due to physical interference of the GO sheets, but not a reduction in viability. It cannot be excluded that these contradictory results might derive from differences in exposure conditions and tested materials, i.e. the presence of toxic contaminants. In particular, GO can be produced by treating FLG with potassium permanganate (KMnO4) (Amirov et al. Citation2017), and Mn ions are notoriously toxic for algae (Hauck et al. Citation2002). Here, we analyzed GBM content for phytotoxic elements, and determined that the concentrations of Mn2+ and Cd2+ were not relevant (Hauck et al. Citation2002), although they were actually higher in GO than in FLG. More recently, Candotto Carniel et al. (Citation2018) showed that GO produced by different companies have different acidic properties, with pH ranging from 3.3 to 4.2 at 100 μg mL−1, further corroborating the assumption that origin and characteristics of the tested materials are prominent factors affecting GBM nanotoxicity (Wick et al. Citation2014).
Conclusions
The two tested GBMs are not toxic to the aeroterrestrial green microalga Trebouxia gelatinosa because its thick cell wall effectively impede internalization, thus preventing interferences with the cytoplasm. A possible interaction of FLG (but not of GO) at the cell wall–plasma membrane interface, occurring after short-term exposure, did not actually lead to negative effects on the long-term.
Our results show that the study of GBM effects on non-model organisms is important and requires more effort, since the effects observed on the few model species studied so far might not be extended to the whole group of green algae, which are highly diverse. Hence, the information gained from this study suggests the need of extending the investigations to a broader spectrum of primary producers (including aeroterrestrial microalgae), in order to predict more precisely how the release of GBMs might affect the environment.
Supplemental Material
Download MS Word (449.2 KB)Acknowledgements
The authors like to thank Dr. Syrgiannis (Northwestern University, USA) for comments, Dr. Bidussi (University of Trieste, I) for help with ChlaF and K+ measurements, Prof. Dr. Bartels and Prof. Dr. Höhfeld (University of Bonn, D) for support to western blot analysis and for HSP70 antiserum and Prof. Tossi (University of Trieste, I) for revising the English language.
Disclosure statement
No potential conflict of interest was reported by the authors.
Additional information
Funding
Related Research Data
References
- Ahmadjian, V. 1973. Methods of isolation and culturing lichen symbionts and thalli. In: V. Ahmadjian and M.E. Hale, eds. The lichens. New York, NY: Academic Press, 653–660.
- Amirov, R. R., J. Shayimova, Z. Nasirova, and A. M. Dimiev. 2017. “Chemistry of Graphene Oxide. Reactions with Transition Metal Cations.” Carbon 116: 356–365. doi:10.1016/j.carbon.2017.01.095.
- ASTM (American Society for Testing and Materials). 1985. Zeta Potential of Colloids in Water and Waste Water Standard D. 4187–92. West Conshohocken: ASTM.
- Archibald, P. A. 1975. “Trebouxia de Pulmaly (Chlorophyceae, Chlorococcales) and Pseudotrebouxia Gen. nov. (Chlorophyceae, Chlorosarcinales).” Phycologia 14 (3): 125–137. doi:10.2216/i0031-8884-14-3-125.1.
- Banchi, E., F. Candotto Carniel, A. Montagner, F. Petruzzellis, G. Pichler, V. Giarola, D. Bartels, A. Pallavicini, and M. Tretiach. 2018. “Relation between Water Status and Desiccation-affected Genes in the Lichen Photobiont Trebouxia gelatinosa.” Plant Physiology and Biochemistry 129 (5): 189–197. doi:10.1016/j.plaphy.2018.06.004.
- Bertuzzi, S., L. Gustavs, G. Pandolfini, and M. Tretiach. 2017. “Heat Shock Treatments for the Control of Lithobionts: A Case Study with Epilithic Green Microalgae.” International Biodeterioration & Biodegradation 123: 236–243. doi:10.1016/j.ibiod.2017.06.023.
- Bianco, A., and M. Prato. 2015. “Safety Concerns on Graphene and 2D Materials: A Flagship Perspective.” 2D Materials 2.3: 1–3. doi:10.1088/2053-1583/2/3/030201.
- Bianco, A., Cheng, H. M. Enoki T., Y. Gogotsi, R. H. Hurt, N. Koratkar, T. Kyotani, M. Monthioux, et al. 2013. “All in the Graphene Family – a Recommended Nomenclature for Two-dimensional Carbon Materials.” Carbon 65: 1–6. doi:10.1016/j.carbon.2013.08.038.
- Bondarenko, O., K. Juganson, A. Ivask, K. Kasemets, M. Mortimer, and A. Kahru. 2013. “Toxicity of Ag, CuO and ZnO Nanoparticles to Selected Environmentally Relevant Test Organisms and Mammalian Cells in Vitro: a Critical Review.” Archives of Toxicology 87 (7): 1181–200. doi:10.1007/s00204-013-1079-4.
- Bramini, M., S. Sacchetti, A. Armirotti, A. Rocchi, E. Vázquez, V. León Castellanos, T. Bandiera, F. Cesca, and F. Benfenati. 2016. “Graphene Oxide Nanosheets Disrupt Lipid Composition, Ca2+ homeostasis, and Synaptic Transmission in Primary Cortical Neurons.” ACS Nano 10 (7): 7154–7171. doi:10.1021/acsnano.6b03438.
- Candotto Carniel, F., M. Gerdol, A. Montagner, E. Banchi, G. De Moro, C. Manfrin, L. Muggia, A. Pallavicini, and M. Tretiach. 2016. “New Features of Desiccation Tolerance in the Lichen Photobiont Trebouxia gelatinosa Are Revealed by a Transcriptomic Approach.” Plant Molecular Biology 91 (3): 319–339. doi:10.1007/s11103-016-0468-5.
- Candotto Carniel, F., D. Zanelli, S. Bertuzzi, and M. Tretiach. 2015. “Desiccation Tolerance and Lichenization: A Case Study with the Aeroterrestrial Microalga Trebouxia sp. (Chlorophyta).” Planta 242 (2): 493–505. doi:10.1007/s00425-015-2319-z.
- Candotto Carniel, F., D. Gorelli, F. Flahaut, L. Fortuna, C. Del Casino, G. Cai, M. Nepi, M. Prato, and M. Tretiach. 2018. “Graphene Oxide Impairs the Pollen Performance of Nicotiana tabacum and Corylus avellana Suggesting Potential Negative Effects on the Sexual Reproduction of Seed Plants.” Environmental Science: Nano 5: 1608–1617. doi:10.1039/c8en00052b.
- Casano, L. M., M. R. Braga, R. Álvarez, E. M. del Campo, and E. Barreno. 2015. “Differences in the Cell Walls and Extracellular Polymers of the Two Trebouxia Microalgae Coexisting in the Lichen Ramalina farinacea Are Consistent with Their Distinct Capacity to Immobilize Extracellular Pb.” Plant Science 236: 195–204. doi:10.1016/j.plantsci.2015.04.003.
- Ciriminna, R., N. Zhang, M. Q. Yang, F. Meneguzzo, Y. J. Xu, and M. Pagliaro. 2015. “Commercialization of Graphene-based Technologies: A Critical Insight.” Chemical Communications 51 (33): 7090–7095. doi:10.1039/C5CC01411E.
- Dahmen, H., T. Staub, and F. J. Schwinn. 1983. “Technique for Long-term Preservation of Phytopathogenic Fungi in Liquid Nitrogen.” Phytopathology 73 (2): 241–246. doi:10.1094/Phyto-73-241.
- Del Hoyo, A., R. Álvarez, E. M. del Campo, F. Gasulla, E. Barreno, and L. M. Casano. 2011. “Oxidative Stress Induces Distinct Physiological Responses in the Two Trebouxia Phycobionts of the Lichen Ramalina farinacea.” Annals of Botany 107 (1): 109–118. doi:10.1093/aob/mcq206.
- Doudrick, K., P. Herckes, and P. Westerhoff. 2012. “Detection of Carbon Nanotubes in Environmental Matrices Using Programmed Thermal Analysis.” Environmental Science & Technology 46 (22): 12246–12253. doi:10.1021/es300804f.
- Du, S., P. Zhang, R. Zhang, Q. Lu, L. Liu, X. Bao, and H. Liu. 2016. “Reduced Graphene Oxide Induces Cytotoxicity and Inhibits Photosynthetic Performance of the Green Alga Scenedesmus obliquus.” Chemosphere 164: 499–507. doi:10.1016/j.chemosphere.2016.08.138.
- Fadeel, B., Bussy, C. Merino S., E. Vázquez, E. Flahaut, F. Mouchet, L. Evariste, et al. 2018. “Safety Assessment of Graphene-based Materials: focus on Human Health and the Environment.” ACS Nano 12 (11): 10582–10620. doi:10.1021/acsnano.8b04758.
- Ferrari, A. C., F. Bonaccorso, V. Fal'ko, K. S. Novoselov, S. Roche, P. Bøggild, S. Borini., et al. 2015. “Science and Technology Roadmap for Graphene, Related Two-Dimensional Crystals, and Hybrid Systems.” Nanoscale 7 (11): 4598–4810. doi:10.1039/C4NR01600A.
- Ferrari, A. C., Meyer, J. C. Scardaci V., C. Casiraghi, M. Lazzeri, F. Mauri, S. Piscanec, D. Jiang, et al. 2006. “Raman Spectrum of Graphene and Graphene Layers.” Physical Review Letters 97 (18): 187401. doi:10.1103/PhysRevLett.97.187401.
- Freystein, K., and W. Reisser. 2010. Green biofilms on tree barks: more than just algae. In: J. Seckbach and M. Grube, eds. Symbioses and Stress: Joint Ventures in Biology. Dordrecht, D; Springer, 557–573.
- Friedl, T. 1989. “Comparative Ultrastructure of Pyrenoids in Trebouxia (Microthamniales, Chlorophyta).” Plant Systematics and Evolution 164 (1-4): 145–159. doi:10.1007/BF00940435.
- Garacci, M., M. Barret, F. Mouchet, C. Sarrieu, P. Lonchambon, E. Flahaut, L. Gauthier, J. Silvestre, and E. Pinelli. 2017. “Few Layer Graphene Sticking by Biofilm of Freshwater Diatom Nitzschia palea as a Mitigation to Its Ecotoxicity.” Carbon 113: 139–150. doi:10.1016/j.carbon.2016.11.033.
- Ghaffarzadeh, K. 2016. Graphene 2D Materials and Carbon Nanotubes: Markets Technologies and Opportunities 2016–2026 [online]. Available from: http://wwwidtechexcom/research/reports/graphene–2d–materials–and–carbon–nanotubes–markets–technologies–and–opportunities–2015–2025–000440asp?viewopt=desc [Accessed March 2018].
- Gogotsi, Y. 2015. “Not Just Graphene: the Wonderful World of Carbon and Related Nanomaterials.” MRS Bulletin 40 (12): 1110–1120. doi:10.1557/mrs.2015.272.
- Gorbushina, A. A., and W. J. Broughton. 2009. “Microbiology of the Atmosphere-rock Interface: how Biological Interactions and Physical Stresses Modulate a Sophisticated Microbial Ecosystem.” Annual Review of Microbiology 63 (1): 431–450. doi:10.1146/annurev.micro.091208.073349.
- Haeder, D. P., V. E. Villafane, and E. W. Helbling. 2014. “Productivity of Aquatic Primary Producers under Global Climate Change.” Photochemical & Photobiological Sciences 13: 1370–1392. doi:10.1039/C3PP50418B.
- Haniff Wahid, M., E. Eroglu, X. Chen, S. M. Smith, and C. L. Raston. 2013. “Entrapment of Chlorella vulgaris Cells within Graphene Oxide Layers.” RSC Advances 3 (22): 8180–8183. doi:10.1039/c3ra40605a.
- Hauck, M., A. Paul, C. Mulack, E. Fritz, and M. Runge. 2002. “Effects of Manganese on the Viability of Vegetative Diaspores of the Epiphytic Lichen Hypogymnia physodes.” Environmental and Experimental Botany 47 (2): 127–142. doi:10.1016/S0098-8472(01)00121-6.
- Hazeem, L. J., M. Bououdina, E. Dewailly, C. Slomianny, A. Barras, Y. Coffinier, S. Szunerits, and R. Boukherroub. 2017. “Toxicity Effect of Graphene Oxide on Growth and Photosynthetic Pigment of the Marine Alga Picochlorum sp. during Different Growth Stages.” Environmental Science and Pollution Research 24 (4): 4144–4152. doi:10.1007/s11356-016-8174-z.
- Holzinger, A., and U. Karsten. 2013. “Desiccation Stress and Tolerance in Green Algae: Consequences for Ultrastructure Physiological and Molecular Mechanisms.” Frontiers in Plant Sciences 4: 327. doi: doi:10.3389/fpls.2013.00327.
- Horton, A. A., A. Walton, D. J. Spurgeon, E. Lahive, and C. Svendsen. 2017. “Microplastics in Freshwater and Terrestrial Environments: Evaluating the Current Understanding to Identify the Knowledge Gaps and Future Research Priorities.” Science of the Total Environment 586: 127–141. doi:10.1016/j.scitotenv.2017.01.190.
- Hu, C., Q. Wang, H. Zhao, L. Wang, S. Guo, and X. Li. 2015. “Ecotoxicological Effects of Graphene Oxide on the Protozoan Euglena gracilis.” Chemosphere 128: 184–190. doi:10.1016/j.chemosphere.2015.01.040.
- Hu, X., and Q. Zhou. 2013. “Health and Ecosystem Risks of Graphene.” Chemical Reviews 113 (5): 3815–3385. doi:10.1021/cr300045n.
- Hu, X., K. Lu, L. Mu, J. Kang, and Q. Zhou. 2014. “Interactions Between Graphene Oxide and Plant Cells: Regulation of Cell Morphology, Uptake, Organelle Damage, Oxidative Effects and Metabolic Disorders.” Carbon 80: 665–676. doi:10.1016/j.carbon.2014.09.010.
- Huang, J., C. Zong, H. Shen, M. Liu, B. Chen, B. Ren, and Z. Zhang. 2012. “Mechanism of Cellular Uptake of Graphene Oxide Studied by Surface-enhanced Raman Spectroscopy.” Small 8 (16): 2577–2584. doi:10.1002/smll.201102743.
- Jastrzębska, A. M., and A. R. Olszyna. 2015. “The Ecotoxicity of Graphene Family Materials: Current Status, Knowledge Gaps and Future Needs.” Journal of Nanoparticles Research 17: 40. doi:10.1007/s11051-014-2817-0.
- Karsten, U., R. Schumann, and A. Mostaert. 2007. Aeroterrestrial algae growing on man-made surfaces. In: J. Seckbach eds. Algae and Cyanobacteria in Extreme Environments. Dordrecht, D; Springer, 583–597.
- Krishnamoorthy, K.,. M. Veerapandian, K. Yun, and S. J. Kim. 2013. “The Chemical and Structural Analysis of Graphene Oxide with Different Degrees of Oxidation.” Carbon 53: 38–49. doi:10.1016/j.carbon.2012.10.013.
- König, J., and E. Peveling. 1984. “Cell Walls of the Phycobionts Trebouxia and Pseudotrebouxia: Constituents and Their Localization.” The Lichenologist 16 (02): 129–144. doi:10.1017/S002428298400030X.
- Kranner, I., Beckett, R. Hochman A., and T. H. Nash III. 2008. “Desiccation-Tolerance in Lichens: A Review.” The Bryologist 111 (4): 576–593. doi:10.1639/0007-2745-111.4.576.
- Kulkarni, S. K., ed. 2015. Nanotechnology: Principles and Practices. Switzerland: Springer.
- Law, K. L. 2017. “Plastics in the Marine Environment.” Annual Review of Marine Science 9 (1): 205–229. doi:10.1146/annurev-marine-010816-060409.
- León, V., J. M. González-Domínguez, J. L. Fierro, M. Prato, and E. Vázquez. 2016. “Production and Stability of Mechanochemically Exfoliated Graphene in Water and Culture Media.” Nanoscale 8 (30): 14548–14555. doi:10.1039/C6NR03246J.
- Liu, Y., A. Beyer, and R. Aebersold. 2016. “On the Dependency of Cellular Protein Levels on mRNA Abundance.” Cell 165 (3): 535–550. doi:10.1016/j.cell.2016.03.014.
- Lüttge, U., and B. Büdel. 2010. “Resurrection Kinetics of Photosynthesis in Desiccation-Tolerant Terrestrial Green Algae (Chlorophyta) on Tree Bark.” Plant Biology 12 (3): 437–444. doi:10.1111/j.1438-8677.2009.00249.x.
- Maier, T., P. Güell, and L. Serrano. 2009. “Correlation of mRNA and Protein in Complex Biological Samples.” FEBS Letters 583 (24): 3966–3973. doi:10.1016/j.febslet.2009.10.036.
- Martín-de-Lucía, I., M. C. Campos-Mañas, A. Agüera, F. Leganes, F. Fernandez-Piñas, and R. Rosal. 2018. “Combined Toxicity of Graphene Oxide and Wastewater to the Green Alga Chlamydomonas reinhardtii.” Environmental Science: Nano 5: 1729–1744. doi:10.1039/C8EN00138C.
- Mogera, U., R. Dhanya, R. Pujar, C. Narayana, and G. U. Kulkarni. 2015. “Highly Decoupled Graphene Multilayers: Turbostraticity at Its Best.” The Journal of Physical Chemistry Letters 6 (21): 4437–4443. doi:10.1021/acs.jpclett.5b02145.
- Montagner, A., S. Bosi, E. Tenori, M. Bidussi, A. A. Alshatwi, M. Tretiach, M. Prato, and Z. Syrgiannis. 2016. “Ecotoxicological Effects of Graphene–based Materials.” 2D Materials 4 (1): 012001. doi:10.1088/2053-1583/4/1/012001.
- Montagner, A. 2017. Ecotoxicological effects of Graphene-Based Materials. Thesis (PhD). University of Trieste.
- Muggia, L., F. Candotto Carniel, and M. Grube. 2016. The Lichen Photobiont Trebouxia: Towards and Appreciation of Species Diversity and Molecular Studies. In: M. Grube, J. Seckbach and L. Muggia, eds. Algal and cyanobacteria symbioses. London, UK: World Scientific, 111–146.
- Murchie, E. H., and T. Lawson. 2013. “Chlorophyll Fluorescence Analysis: a Guide to Good Practice and Understanding Some New Applications.” Journal of Experimental Botany 64 (13): 3983–3998. doi:10.1093/jxb/ert208.
- Nogueira, P. F. M., D. Nakabayashi, and V. Zucolotto. 2015. “The Effects of Graphene Oxide on Green Algae Raphidocelis subcapitata.” Aquatic Toxicology 166: 29–35. doi:10.1016/j.aquatox.2015.07.001.
- Northcote, D. H., K. J. Goulding, and R. W. Horne. 1958. “The Chemical Composition and Structure of the Cell Wall of Chlorella pyrenoidosa.” Biochemical Journal 70 (3): 391–397. doi:10.1042/bj0700391.
- Novoselov, K. S., V. I. Fal′Ko, L. Colombo, P. R. Gellert, M. G. Schwab, and K. Kim. 2012. “A Roadmap for Graphene.” Nature 490 (7419): 192–200. doi:10.1038/nature11458.[10.1038/nature11458]
- OECD. 2011. Test No. 201: Freshwater Alga and Cyanobacteria, Growth Inhibition Test. Paris: Organisation for Economic Co-operation and Development. doi:10.1787/9789264069923-en.
- Oukarroum, A., W. Zaidi, M. Samadani, and D. Dewez. 2017. “Toxicity of Nickel Oxide Nanoparticles on a Freshwater Green Algal Strain of Chlorella vulgaris.” BioMed Research International 2017: 1. doi:10.1155/2017/9528180.
- Ouyang, S., X. Hu, and Q. Zhou. 2015. “Envelopment-internalization Synergistic Effects and Metabolic Mechanism of Graphene Oxide on Single-cell Chlorella vulgaris Are Dependent on the Nanomaterial Particle Size.” ACS Applied Materials & Interfaces 7 (32): 18104–18112. doi:10.1021/acsami.5b05328.
- Pan, S., H. Tian, S. R. S. Dangal, Z. Ouyang, B. Tao, W. Ren, C. Lu, and S. Running. 2014. “Modeling and Monitoring Terrestrial Primary Production in a Changing Global Environment: Toward a Multiscale Synthesis of Observation and Simulation.” Advances in Meteorology 2014: 1. doi:10.1155/2014/965936.
- Pelin, M., L. Fusco, C. Martín, S. Sosa, J. Frontiñán-Rubio, J. M. González-Domínguez, M. Durán-Prado, E. Vázquez, M. Prato, and A. Tubaro. 2018. “Graphene and Graphene Oxide Induce ROS Production in Human HaCaT Skin Keratinocytes: the Role of Xanthine Oxidase and NADH Dehydrogenase.” Nanoscale 10 (25): 11820–11830. doi:10.1039/c8nr02933d.
- Potts, M. 1994. “Desiccation Tolerance of Prokaryotes.” Microbiology and Molecular Biology Reviews 58 (4): 755–805. doi:10.1093/icb/45.5.800.
- Pretti, C., M. Oliva, R. D. Pietro, G. Monni, G. Cevasco, F. Chiellini, C. Pomelli, and C. Chiappe. 2014. “Ecotoxicity of Pristine Graphene to Marine Organisms.” Ecotoxicology and Environmental Safety 101: 138–145. doi:10.1016/j.ecoenv.2013.11.008.
- Rana, R. M., A. Iqbal, F. M. Wattoo, M. A. Khan, and H. Zhang. 2018. HSP70 Mediated Stress Modulation in Plants. In: A. A. A.Asea and P. Kaureds eds. Heat Shock Proteins and Stress. Cham, CH; Springer, 281–290.
- R Development Core Team 2015., R: A language and environment for statistical computing. Vienna, Austria: R Foundation for Statistical Computing,.
- Roy, R.,. A. Parashar, M. Bhuvaneshwari, N. Chandrasekaran, and A. Mukherjee. 2016. “Differential Effects of P25 TiO2 Nanoparticles on Freshwater Green Microalgae: Chlorella and Scenedesmus Species.” Aquatic Toxicology 176: 161–171. doi:10.1016/j.aquatox.2016.04.021.
- Samek, O., A. Jonáš, Z. Pilát, P. Zemánek, L. Nedbal, J. Tříska, P. Kotas, and M. Trtílek. 2010. “Raman Microspectroscopy of Individual Algal Cells: sensing Unsaturation of Storage Lipids in Vivo.” Sensors 10 (9): 8635–8651. doi:10.3390/s100908635.
- Suppi, S.,. K. Kasemets, A. Ivask, K. Künnis-Beres, M. Sihtmäe, I. Kurvet, V. Aruoja, and A. Kahru. 2015. “A Novel Method for Comparison of Biocidal Properties of Nanomaterials to Bacteria, Yeasts and Algae.” Journal of Hazardous Materials 286: 75–84. doi:10.1016/j.jhazmat.2014.12.027.
- Tang, Y., J. Tian, S. Li, C. Xue, C. Xue, D. Yin, and S. Yu. 2015. “Combined Effects of Graphene Oxide and Cd on the Photosynthetic Capacity and Survival of Mycrocystis aeruginosa.” Science of the Total Environment 532: 154–161. doi:10.1016/j.scitotenv.2015.05.081.
- Tarhanen, S., T. Holopainen, and J. Oksanen. 1997. “Ultrastructural Changes and Electrolyte Leakage from Ozone Fumigated Epiphytic Lichens.” Annals of Botany 80 (5): 611–621. doi:10.1006/anbo.1997.0480.
- Torrisi, F., Hasan, T., Wu, W. Sun, Z. Lombardo, A. Kulmala T. S. Hsieh G., S. Jung, et al. 2012. “Inkjet-Printed Graphene Electronics.” ACS Nano 6 (4): 2992–3006. doi:10.1021/nn2044609.
- Tretiach, M., P. Adamo, R. Bargagli, L. Baruffo, L. Carletti, P. Crisafulli, S. Giordano, P. Modenesi, S. Orlando, and E. Pittao. 2007. “Lichen and Moss Bags as Monitoring Devices in Urban Areas. Part I: Influence of Exposure on Sample Vitality.” Environmental Pollution 146 (2): 380–391. doi:10.1016/j.envpol.2006.03.046.
- Wang, S. B., Q. Hu, M. Sommerfeld, and F. Chen. 2004. “Cell Wall Proteomics of the Green Alga Haematococcus pluvialis (Chlorophyceae).” Proteomics 4 (3): 692–708. doi:10.1002/pmic.200300634.
- Wellburn, A. R. 1994. “The Spectral Determination of Chlorophylls a and b as Well as Total Carotenoids Using Various Solvents with Spectrophotometers of Different Resolution.” Journal of Plant Physiology 144 (3): 307–313. doi:10.1016/S0176-1617(11)81192-2.
- Wick, P., A. E. Louw-Gaume, M. Kucki, H. F. Krug, K. Kostarelos, B. Fadeel, K. A. Dawson., et al. 2014. “Classification Framework for Graphene-Based Materials.” Angewandte Chemie International Edition 53 (30): 7714–7718. doi:10.1002/anie.201403335.
- Wu, H. C., D. L. Luo, F. Vignols, and T. L. Jinn. 2012. “Heat Shock- induced Biphasic Ca2+ Signature and OsCaM1-1 Nuclear Localization Mediate Downstream Signalling in Acquisition of Thermotolerance in Rice (Oryza sativa L.).” Plant Cell & Environment 35 (9): 1543–1557. doi:10.1111/j.1365-3040.2012.02508.x.
- Yamamoto, M., M. Fujishita, A. Hirata, and S. Kawano. 2004. “Regeneration and Maturation of Daughter Cell Walls in the Autospore-forming Green Alga Chlorella vulgaris (Chlorophyta, Trebouxiophyceae).” Journal of Plant Research 117 (4): 257–264. doi:10.1007/s10265-004-0154-6.
- Yamamoto, Y.,. Y. Kinoshita, and I. Yoshimura. 2002. Photobiont culturing. In: I. Kranner, R.P. Beckett, and A. K. Varma, eds. Protocols in Lichenology. Culturing, Biochemistry, Ecophysiology and Use in Biomonitoring. Heidelberg, D: Springer, 34–42.
- Yan, L., Z. Gu, and Y. Zhao. 2013. “Chemical Mechanisms of the Toxicological Properties of Nanomaterials: generation of Intracellular Reactive Oxygen Species.” Chemistry - An Asian Journal 8 (10): 2342–2353. doi:10.1002/asia.201300542.
- Yancey, P., M. Clark, S. Hand, R. Bowlus, and G. Somero. 1982. “Living with Water Stress: evolution of Osmolyte Systems.” Science 217 (4566): 1214–1222. doi:10.1126/science.7112124.
- Yu, H. Y., T. Ziegelhoffer, J. Osipiuk, S. J. Ciesielski, M. Baranowski, M. Zhou, A. Joachimiak, and E. A. Craig. 2015. “Roles of Intramolecular and Intermolecular Interactions in Functional Regulation of the HSP70 J-Protein Co-chaperone Sis1.” Journal of Molecular Biology 427 (7): 1632–1643. doi:10.1016/j.jmb.2015.02.007.
- Zeng, H., L. Xu, A. Singh, H. Wang, L. Du, and B. W. Poovaiah. 2015. “Involvement of Calmodulin and Calmodulin-like Proteins in Plant Responses to Abiotic Stresses.” Frontiers in Plant Science 6: 600. doi:10.3389/fpls.2015.00600].
- Zhang, Y., T. Meng, X. Guo, R. Yang, X. Si, and J. Zhou. 2018. “Humic Acid Alleviates the Ecotoxicity of Graphene-family Materials on the Freshwater Microalgae Scenedesmus obliquus.” Chemosphere 197: 749–758. doi:10.1016/j.chemosphere.2018.01.051.