
Abstract
Inhalation of nanosized zinc oxide (ZnO) induces metal fume fever and systemic acute phase response in humans. Acute phase response activation is a cardiovascular risk factor; we investigated whether pulmonary exposure of mice can be used to assess ZnO-induced acute phase response as well as inflammation and genotoxicity. Uncoated (NM-110) and triethoxycaprylylsilane-coated (NM-111) ZnO nanoparticles were intratracheally instilled once at 0.2, 0.7 or 2 µg/mouse (11, 33 and 100 µg/kg body weight). Serum amyloid A3 mRNA level in lung tissue, bronchoalveolar lavage (BAL) fluid cellularity, and levels of DNA strand breaks in BAL fluid cells, lung and liver tissue were assessed 1, 3 and 28 days post-exposure. Global transcription patterns were assessed in lung tissue using microarrays. The acute-phase response serum amyloid A3 mRNA levels were increased on day 1; for uncoated ZnO nanoparticles at the highest dose and for coated ZnO nanoparticles at medium and highest dose. Neutrophils were increased in BAL fluid only after exposure to coated ZnO nanoparticles. Genotoxicity was observed only in single dose groups, with no dose-response relationship. Most changes in global transcriptional response were observed after exposure to uncoated ZnO nanoparticles and involved cell cycle G2 to M phase DNA damage checkpoint regulation. Although, uncoated and coated ZnO nanoparticles qualitatively exerted similar effects, observed differences are likely explained by differences in solubility kinetics. The finding of serum amyloid A3 induction at low exposure suggests that mouse models can be used to assess the nanoparticle-mediated induction of acute phase responses in humans.
Introduction
The consumer application of zinc oxide (ZnO) nanoparticles is broad and includes cosmetics, sunscreens, biosensors, food additives, pigments, rubber manufacturing, electronics, agriculture, and antimicrobial products (Burnett and Wang Citation2011). Human exposure to ZnO nanoparticles can occur in the occupational settings during the synthesis of ZnO, manufacturing of ZnO products and via consumer products. Thus, it is imperative to understand the potentially harmful effects of ZnO nanoparticles and identify exposure levels relevant to human toxicity.
Zinc is a major constituent of welding fumes and pulmonary toxicity is observed in welders exposed to ZnO during welding of galvanized steel and alloys. Inhalation of high doses of ZnO induces metal fume fever in humans. Metal fume fever can also be induced by other metal oxides and is characterized by flu-like symptoms: fever, cough, wheezing, chest tightness, fatigue, and chills (Greenberg and Vearrier Citation2015). Exposure to metal oxides at levels close to the current occupational exposure limits that do not induce metal fume fever still evoke inflammatory and acute phase responses in humans. Men exposed for 6 h to low doses of Zn-containing welding fumes had increased blood levels of interleukin (IL)-6 and the acute phase reactants C-reactive protein (CRP), and serum amyloid A (SAA) (Baumann et al. Citation2016). Increased CRP concentrations in blood (Hartmann et al. Citation2014), elevated BAL fluid polymorphonuclear leukocytes, tumor necrosis factor-α (TNFα), and IL-8 levels were also observed in welders exposed to Zn containing welding fumes (Blanc et al. Citation1993; Kuschner et al. Citation1995). A positive correlation was observed between total polymorphonuclear leukocytes count in bronchoalveolar lavage (BAL) fluid and Zn exposure in welders acutely exposed to welding dust (Blanc et al. Citation1991). In another study, elevated blood levels of CRP were observed in workers exposed for 6 h to gas brazing processes involving 1.2 or 1.5 mg Zn/m3 (Brand et al. Citation2014). Collectively, these observations imply that acute phase and inflammatory reactions can be induced in humans exposed to Zn at occupationally relevant doses. In addition, welding fumes are classified as Group 1 carcinogen by IARC (IARC Citation2018).
The acute-phase response is a systemic reaction elicited by the organism in response to tissue injury or infection (Saber et al. Citation2014). However, persistent or recurring acute-phase responses are a risk factor for cardiovascular diseases (Ridker et al. Citation2000; Saber et al. Citation2014). In a recent study, inhalation of ZnO nanoparticles was shown to induce the acute phase response in humans. Human inhalation of ZnO nanoparticles induces ZnO dose-dependent increases in body temperature and, neutrophilia at 1 and 2 mg/m3. Increased blood levels of acute-phase response protein SAA was observed at 1 and 2 mg/m3 and increased CRP already at 0.5 mg/m3 (Monsé et al. Citation2018). Notably, these effects were observed at doses that are below the occupational exposure limit for ZnO in many countries (Monsé et al. Citation2018; Vogel and Cassee Citation2018). In a separate study, acute exposure of healthy human adults to 0.5 mg/m3 mass concentration of ZnO (<0.1 µm in diameter) for 2 h did not result in acute-phase response or inflammation (Beckett et al. Citation2005).
In animal experimental models, pulmonary exposure to ZnO nanoparticles has been shown to induce strong dose-dependent toxic responses including pulmonary cytotoxicity and mortality in mice (Jacobsen et al. Citation2015). The toxicity has been attributed to ZnO dissolution and the release of zinc ions and was observed at dose levels that are well-tolerated for insoluble nanoparticles (Cho et al. Citation2011; Kao et al. Citation2012; Jacobsen et al. Citation2015). ZnO nanoparticles undergo dissolution in water, cell culture medium and in biological fluids (Reed et al. Citation2012; Kermanizadeh et al. Citation2013; Da Silva et al. Citation2019), the rate of which are influenced by pH, the primary particle size and different surface coatings (Cho et al. Citation2011; Rathnayake et al. Citation2014).
Thus, there is evidence to support a pulmonary acute phase and inflammogenic potential of ZnO and potentially inflammogenic responses to ZnO nanoparticle exposure in humans. Given the diversity of nanoparticles, it is not clear if all variants (sizes, different surface coatings or surface properties) of ZnO nanoparticles are equally toxic to humans and human studies are not an option. Rodent inhalation studies have shown pulmonary inflammation following ZnO nanoparticle exposure (Ho et al. Citation2011; Adamcakova-Dodd et al. Citation2014a; Chuang et al. Citation2014; Chen et al. Citation2015; Larsen et al. Citation2016). However, animal studies investigating the effects of ZnO on acute phase response are absent and only a few studies included genotoxic effects (Ho et al. Citation2011; Chuang et al. Citation2014; Larsen et al. Citation2016).
Thus, the main objective of the present study was to explore the possibilities of using mice to investigate the ZnO-induced pulmonary and systemic toxicity including the acute phase, pro-inflammatory and genotoxic effects of ZnO nanoparticles at low doses relevant to human occupational scenarios. Pristine uncoated (uncoated ZnO) and a triethoxycaprylylsilane coated ZnO (coated ZnO) nanoparticles were used in the study. The rationale for also including a coated ZnO nanoparticle was that coatings such as the investigated, triethoxycaprylylsilane, are used in the cosmetics industry for improving the ability of nanoparticles to mix with other ingredients (KOBO_Products_Inc. Citation2017). Mice were exposed via single instillation to 0.2, 0.7 and 2 µg/mouse of the coated and uncoated ZnO. The relatively low doses were selected based on a previous study demonstrating that higher doses induce acute toxicity in mice (Jacobsen et al. Citation2015). BAL fluid, lung and liver tissues were collected 24 h, 3 and 28 days post-instillation. Local lung inflammation by BAL fluid cellularity, pulmonary and systemic inflammation by acute phase reactant measurement and genotoxicity by comet assay were measured. Global gene expression changes were profiled in the lungs to identify mechanisms underlying the observed toxicological effects in lung tissue.
Material and methods
Description of nanomaterials
ZnO NM-110 (CAS number 1314-13-2) and NM-111 selected by the OECD Working Party for Nanomaterials and were generously given by the EU Joint Research Centre, ISPRA, Italy. The uncoated NM-110 has a primary diameter pf 100 nm and was designated: ‘uncoated ZnO’ in the current work. The NM-111 has a primary diameter of 130 nm particle and consists of ZnO NM-110 as the core particle treated with a triethoxycaprylylsilane surface coating, to form a poly-octyl-siloxy-coating and was designated ‘coated ZnO’ in the current work. Dissolution studies of these materials, from the literature, have shown that the uncoated ZnO dissolves somewhat faster in water as compared to the coated ZnO (). Approximately 50% of the uncoated ZnO particle mass is dissolved after 24 h, as published by Kermanizadeh et al. (Citation2013).
Table 1. Physical chemical characteristics of the ZnO and carbon black nanomaterials.
Dispersion procedures
The nanoparticles were pre-wetted by ethanol 0.5% (v/w) and suspended in 0.2 µm filtered, γ-irradiated Nanopure Diamond UV water (Pyrogens: <0,001 EU/ml, total organic carbon: <3.0 ppb), at a mass concentration of 3.24 mg/mL. The stock suspension was further diluted 81-fold to obtain the high dose exposure concentration 0.04 mg/mL (2 µg/mouse in a volume of 50 µl). This high-dose suspension was placed in an ice-bath and continuously sonicated for 16 min using a 13 nm disruptor horn equipped Branson Sonifier (Prod. no. disruptor horn: 101-147-037, Prod. No. Sonifier: S-450D, Branson Ultrasonics Corp., Danbury, CT, USA) equipped with a 13 nm disruptor horn (Prod. no.: 101-147-037, Branson Ultrasonics Corp., Danbury, CT, USA). Lower dose dilutions were obtained by subsequent three- and nine-fold dilution, respectively – of the high-dose suspension and further sonicated for an additional 2 min before exposure. Vehicle solution was prepared as described for the high-dose dilution without nanoparticles. To ensure nanoparticle homogeneity, all suspensions were administered to the mice within one hour of preparation.
Material characterization
The hydrodynamic size distributions of the instillation suspensions were determined by Dynamic Light Scattering (DLS) using a Malvern Zetasizer Nano ZS (Malvern Instruments, UK) at 25 °C. Analysis was done using the Dispersion Technology Software v5.0 (Malvern Instruments, UK). Hydrodynamic size was calculated using a dispersion refractive index of 1.33, a materials refractive index of 2.1, a viscosity 0.89 cP and a material absorption value of 2.0.
Animal housing
All animal procedures complied with the EC Directive 86/609/EEC and Danish law regulating experiments with animals (The Danish Ministry of Justice, Animal Experiments Inspectorate permission 2010/561-1779), and were approved by the local animal ethical committee. Female C57BL/6J BomTac mice, 7 weeks of age, were purchased from Taconic Europe (Ejby, Denmark). For logistic reasons, only female mice were used in the study. Compared to male mice, female mice are less aggressive towards each other, and can, therefore, be housed in groups of 6–8 mice. At arrival, the mice were randomly distributed to cages containing either nanomaterial administered animals or vehicle control animals. The number of animals (N) was 8 per cage for nanomaterial dosed animals and 6 per cage for controls. Each experimental group consisted of a minimum of 8 animals; 8 mice were included in uncoated ZnO, coated ZnO and Printex 90 carbon black groups; and 12 mice used for the vehicle control group. The mice had ad libitum access to tap water and food (Altromin no. 1324, Christian Petersen, Denmark). Housing was in polypropylene cages with Enviro-Dri bedding (Brogaarden, Gentofte, Denmark). MS wood blocks (Brogaarden, Gentofte, Denmark) and hides (Mouse House, Scanbur, Karlslunde, Denmark) served as enrichment. The room temperature was kept at 20 ± 2 °C and the humidity at 50 ± 20%. The animals were housed under a 12 h light: 12 h dark cycle (on from 6 a.m. to 6 p.m.) and allowed to acclimatize for one week.
Animal exposures
Nanoparticles were administered by a single intratracheal instillation as described previously (Jackson et al. Citation2011). Doses were 0.2, 0.7 and 2 µg/mouse (or: 11, 33 and 100 µg/kg bw). These low doses were based on previously conducted pilot studies. Complete immobility and breathing difficulty was observed at 162 µg of the coated ZnO NP per mouse (8.2 mg/kg bw). Mortality was observed at 1.4 mg/kg bw as reported by (Jacobsen et al. Citation2015). In addition, body weight decrease was observed at doses above 6 µg/mouse of other ZnO nanoparticles (1) ZincoxTM 10, IBUtec advanced materials AG, Weimar, Germany, and (2) Alfa Aesar (ID 43141, A Johnson Matthey Company, Karlsruhe, Germany; and (3) the current coated ZnO (NM-111) (Jacobsen et al. Citation2015). Carbon black Printex 90 (162 µg/mouse) was tested head-to-head with the ZnO nanoparticles in the current experiment; the carbon black data were included as reference in other studies that were performed in parallel with the current study (Kyjovska et al. Citation2015a, Citation2015b; Wallin et al. Citation2017).
In brief, mice were anaesthetized by inhalation of 4% isoflurane. Next, 50 μL of particle suspension or vehicle control followed by 100 μL of air was instilled using a SGE glass syringe (250F-LT-GT, MicroLab, Aarhus, Denmark). Breathing was monitored post-instillation to ensure that airways were not blocked by instillation fluid. The animals were weighed on the day of exposure as well as on day 2 and on day 27 post-exposure. Mice were killed on day 1, day 3 and day 28 post-exposure by subcutaneous injection of Hypnorm (fentanyl citrate 0.315 mg/mL and Fluanisone 10 mg/mL, Janssen Pharma, Beerse, Belgium) and Dormicum (Midazolam 5 mg/mL from Roche, Basel, Switzerland), which both were mixed with an equal volume of sterile water.
BAL fluid collection and cellularity
BAL fluid was recovered by flushing the lungs twice using 1 mL saline/25 g bw per each flush. BAL fluid was kept on ice for a maximum of 2 h, at which the samples were centrifuged at 400 × g at 4 °C for 10 min to recover cells. The cells were re-suspended in 100 μL HAM-F12 medium (Prod no. 21765037, Invitrogen, Carlsbad, CA, USA) containing 10% fetal bovine serum (Prod no. 10106169, Invitrogen, Carlsbad, CA, USA). For differential counting of immune cells in BAL fluid, 40 µL of the fresh resuspension was collected on microscope slides by centrifugation at 60 × g, 4 min by use of a Cytofuge 2 (StatSpin, Bie and Berntsen, Rødovre, Denmark). Cells were fixed by the addition of 96% ethanol and incubated with May-Grünwald-Giemsa stain. The total number of cells in the resuspension was measured with a NucleoCounter NC-100 (Chemometec, Allerød, Denmark) Live/Dead Assay. The differential cell count was carried out on a total of 200 cells per sample. For the analysis by comet assay, 160 μL of 90% HAMF12, 10% FBS, 1% Dimethyl sulfoxide was added to 40 µl of the BAL fluid cell suspension. Lung and liver samples were snap-frozen in liquid nitrogen. Comet assay samples were stored at −80 °C until analyses.
Measurement of SAA-3 protein levels in plasma
The levels of SAA-3 protein were determined in blood plasma from mice exposed to high and medium doses of uncoated or coated ZnO nanomaterials, as well as for carbon black exposed mice. This was carried out by ELISA in accordance with the manufacturer’s instructions (Mouse Serum Amyloid A-3, Cat.#EZMSAA3-12K, Millipore) and has been described in detail by (Poulsen, Saber, Mortensen, et al. Citation2015; Poulsen et al. Citation2017). The level of detection (LOD) was 0.08 µg/mL. For samples that were below LOD a value of ½LOD was used (0.04 µg/mL).
RNA isolation and quantitative PCR measurement of the Saa3 mRNA level
Purification of mRNA and the subsequent quantitative PCR was conducted as previously described (Saber et al. Citation2006). In brief, RNA was recovered from the left lung by use of the NucleoSpin 96 RNA kit (Macherey-Nagel, Düren, Germany). The tissue was lysed in 2 mL RLT buffer, by homogenizing for 2 × 60 s using a Tissuelyser (Qiagen, Denmark) containing a 5 mm stainless steel bead. The samples were then run through a QIAshredder (Qiagen, USA). The remaining purification steps were conducted according to the description of the NucleoSpin 96 RNA kit. Next, cDNA was prepared using the reverse transcription reagents from TaqMan (Applied Biosystems, USA) as described by the manufacturer. The quantitative PCR was performed on an ABI PRISM® 7500 sequence detector (PE Biosystems, Foster City, CA, USA), using Universal Mastermix (Applied Biosystems, Naerum, Denmark). The sequence of Saa3 forward primer was: 5´ GCC TGG GCT GCT AAA GTC AT 3´, that of the Saa3 reverse primer: 5´ TGC TCC ATG TCC CGT GAA C 3´, and that of the Saa3 probe: 5´ FAM-TCT GAA CAG CCT CTC TGG CAT CGC T-TAMRA 3´. Data were normalized to 18S rRNA (prod. no. Mm03024053_m1 from Applied Biosystems) and multiplied with 107 to provide values that were more readable (0 to 2500).
Levels of DNA strand breaks
Levels of DNA strand breaks were determined in BAL fluid cells, lung and liver tissue. The percentage of DNA in the tail was determined by comet assay using the IMSTAR PathfinderTM system as previously described (Jackson et al. Citation2013). In brief, BAL cells were thawed at 37 C. Frozen lung and liver pieces were homogenized in Merchant’s medium (140 mM NaCl, 1.5 mM KH2PO4, 2.7 mM KCl, 8.1 mM Na2HPO4, 10 mM Na2-EDTA, pH 7.4) through a steel mesh within a syringe. Obtained cells were next suspended in 0.6% agarose at 37 °C, followed by embedding on Trevigen CometSlidesTM. The slides were cooled and incubated at 4 °C overnight in lysis buffer. Next, the slides were rinsed in electrophoresis buffer (pH >13) followed by 40 min of alkaline treatment. The electrophoresis was run for 25 min at an applied voltage of 1.15 V/cm and a current of 300 mA. After pH neutralization, the slides were fixed in 96% ethanol and placed on a 45 °C heating plate for 15 min. The cells were next stained with SYBR®Green fluorescent stain. After the addition of a UV-filter and coverslips, levels of DNA strand breaks were analyzed using the IMSTAR PathfinderTM system. The results are calculated as an average percentage tail DNA value for all cells scored in each Trevigen CometSlide well. Negative and positive controls included on all slides were non-exposed A549 cells, and A549 cells exposed to 30 µM H2O2, respectively. The data were normalized to the negative controls in order to adjust for day-to-day variation.
Total RNA extraction and purification for microarray analysis
Random sections of the left lungs were used to isolate total RNA (n = 5 per experimental group) using TRIzol reagent (Invitrogen, Carlsbad, CA, USA), and purified using RNeasy Plus Mini kits (Qiagen, Mississauga, ON, Canada) according to the manufacturer’s instruction. NanoDrop 2000 spectrophotometer (Thermo Fisher Scientific Inc., Wilmington, DE, USA) was used to quantify the total RNA concentration and RNA quality and integrity was assessed using an Agilent 2100 Bioanalyzer (Agilent Technologies, Mississauga, ON, Canada) according to the manufacturer’s instruction. All samples had RNA integrity numbers above 7.0.
Microarray hybridization
Double-stranded cDNA was synthesized using the total RNA (250 ng) from individual mice (n = 5 per experimental or control group) and Universal Mouse Reference total RNA (UMRR) (Agilent Technologies, Mississauga, ON, Canada). Cyanine-labelled cRNAs were synthesized from the cDNA using Quick Amp Labelling Kit (Agilent Technologies, Mississauga, ON, Canada). cRNAs from control and ZnO nanoparticle-treated samples were labeled with Cyanine 5-CTP, and reference cRNAs were labeled with Cyanine 3-CTP using a T7 RNA polymerase in vitro transcription kit (Agilent Technologies, Mississauga, ON, Canada) and purified using RNeasy Mini kits (Qiagen, Mississauga, ON, Canada). An equimolar amount of reference cRNA was mixed with each experimental cRNA sample and was hybridized to Agilent mouse 8 × 60 k oligonucleotide microarrays (Agilent Technologies Inc., Mississauga, ON, Canada) for 17 h in a hybridization chamber at 65 °C with a rotation speed of 10 rpm. Following hybridization, arrays were scanned on an Agilent G2505B scanner according to manufacturer’s protocols. Gene expression data from the scanned images were extracted using Agilent Feature Extraction software version 9.5.3.1.
Statistical analysis
Total protein, neutrophil cells, DNA strand breaks, and Saa3 mRNA levels
The Graph Pad Prism 7.02 software package (Graph Pad Software Inc., La Jolla, CA, USA) was used for statistical calculations. Data were tested for normality with the Shapiro-Wilk test. The t-test and the ANOVA test are robust against deviations in normality and were used for inter-group comparisons, except when the p-value of the Shapiro Wilks test was very low (p < 0.001); or when the standard deviations of the groups were determined to be very different. Differences in standard deviations were assessed using the F test (for two-sample comparisons) or Brown-Forsythe test for three or more treatment groups (p < 0.001). The latter tests were applied because the t-test and the ANOVA are somewhat sensitive to differences in data variability. In case of such deviations in normality or in inter-group standard deviations, a non-parametric test in the form of the Mann–Whitney test (two groups) or the Kruskall–Wallis test (more than two groups) was calculated. In order to assess inter-group differences in one-way ANOVA or the Kruskall–Wallis test, multiple comparisons post-tests were applied. These were Holm–Sidak’s multiple comparisons test (ANOVA) or Dunn’s multiple comparisons test (Kruskall–Wallis test). The data were tested so that each particle type was tested independently against vehicle control.
Microarray data
The microarray data were statistically analyzed as described previously (Husain et al. Citation2013, Labib et al. Citation2013). In brief, a reference randomized block design was used to analyze gene expression microarray data. Data were normalized using LOcally WEighted Scatterplot Smoothing (LOWESS) regression modeling method and statistical significance of the differentially expressed genes was determined using MicroArray ANalysis Of VAriance (MAANOVA) (Rahman et al. Citation2017) in R statistical software (R Core Team Citation2012). The Fs statistic (Rahman et al. Citation2017) was used to test the treatment effects compared to the control vehicle, and p-values were estimated by the permutation method using residual shuffling. In order to minimize any false positives, the false discovery rate (FDR) multiple testing correction (Rahman et al. Citation2017) was applied. The fold changes of gene expression were calculated considering the least-square means. Genes with FDR p-values of less than or equal to 0.05 (p ≤ 0.05) were considered significantly differentially expressed and were used in all downstream analyses. Since the gene list was small, the fold-change based filtering was not conducted.
Functional and pathway analyses of differentially regulated mRNAs
These analyses were done as previously described in (Rahman et al. Citation2017). In brief, Ingenuity Pathway Analysis (IPA, Ingenuity Systems, Redwood City, CA, USA) was used to identify the pathways associated with differentially expressed genes. Pathway significance was defined using Fisher’s exact p-value of ≤ 0.05.
Results
Physical chemical characterization
The uncoated ZnO had a Z average of 468 and a dispersity of 0.15. The coated ZnO had a Z average of 727 and a dispersity of 0.13. The positive control, carbon black Printex 90 had a Z average of 128 and a dispersity of 0.55. These data, as well as other physical chemical characteristics obtained from the literature, are presented in .
Body weight
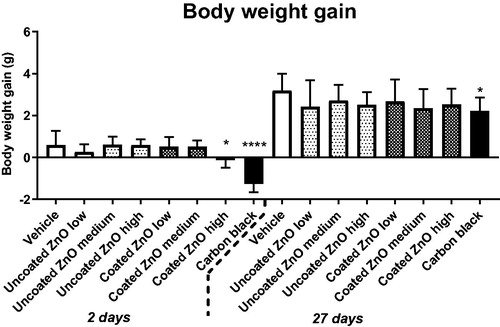
A decrease in body weight gain was observed in mice exposed to the highest dose (2 µg/mouse) of coated ZnO nanoparticles at 2 days after exposure (the mice were weighted one day before euthanization). The effect was reversed at 27 days post-exposure. Body weight was unaffected in mice exposed to uncoated ZnO nanoparticles, whereas the positive control carbon black resulted in a lower weight gain as compared to control ().
Figure 1. Body weight gain in mice exposed to ZnO nanoparticles. Uncoated or triethoxycaprylylsilane-coated ZnO nanoparticles were administered by intratracheal instillation at 0.2, 0.7 or 2 µg/mouse. Low, medium and high designates low-dose, medium-dose and high-dose, respectively. Two or twenty-seven days later the body weight was measured and body weight gain compared to weight at exposure was calculated. Data are mean and bars represent SD. * designates a p-value of <0.05 vs. vehicle of one way ANOVA with Holm–Sidak’s multiple comparisons test. In the case of carbon black **** and * designates p-values of <0.0001 and <0.05 respectively vs. vehicle of the t-test.
BAL fluid cellularity and protein content
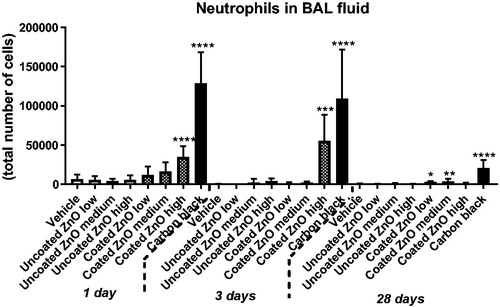
Total protein in BAL fluid was increased in mice exposed to a high dose of uncoated or coated ZnO nanoparticles at day 1 and 3 but not at day 28. Total protein was increased for the positive control carbon black at all three time-points, as previously reported (Kyjovska et al. Citation2015b) (). Total cell counts in BAL fluid, as well as cell distribution by cell type, are summarized in Supplementary Materials, Table S1. Increased neutrophil numbers were observed only in the lungs of mice exposed to a high dose of coated ZnO nanoparticles on day 1 and 3 post-exposure. Notably, at 28 d post-exposure, increased neutrophil count was observed in coated ZnO nanoparticles low and medium dose groups only. In comparison, no significant increases in the BAL neutrophil populations were observed in mice exposed to uncoated ZnO nanoparticles. Mice instilled with positive control carbon black (162 µg/mouse) showed increased neutrophil influx at all three post-exposure time points, as previously reported (Kyjovska et al. Citation2015b) ().
Figure 2. Total protein in BAL fluid at 1, 3 and 28 days of ZnO nanoparticle exposure. Uncoated or triethoxycaprylylsilane-coated ZnO nanoparticles were administered by intratracheal instillation at 0.2, 0.7 or 2 µg/mouse. Low, medium and high designates low-dose, medium-dose and high-dose, respectively. One, three or twenty-eight days after exposure, BAL fluid was prepared and total protein determined. Data are mean and bars represent SD. ****, ***, ** and * designates p-values of <0.0001, <0.001, <0.01 and <0.05 respectively vs. vehicle of one way ANOVA with Holm–Sidak’s multiple comparisons test. In the case of carbon black ***, and ** designates p-values of <0.001, and <0.01 respectively vs. vehicle of the t-test.
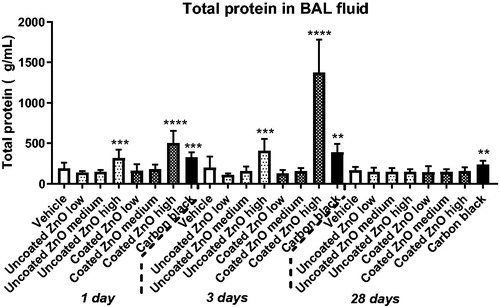
Figure 3. Neutrophil numbers in BAL fluid at 1, 3 and 28 days of ZnO nanoparticle exposure. Uncoated (uncoated ZnO) or triethoxycaprylylsilane-coated ZnO nanoparticles (coated ZnO) were administered by intratracheal instillation at 0.2, 0.7 or 2 µg/mouse. Low, medium and high designates low-dose, medium-dose and high-dose, respectively. Carbon black at 162 µg/mouse served as positive control. One, three or twenty-eight days post-exposure, BAL fluid was prepared and the number of neutrophils established by differential counting. Data are mean and bars represent SD. ***, ** and * designates p-values of <0.001, <0.01 and <0.05 respectively of one way ANOVA with Holm–Sidak’s multiple comparisons test in case of data approaching normality and not having a highly different variation (details given in the methods section), otherwise by Kruskall–Wallis test with Dunn’s multiple comparisons test. In the case of carbon black ****, ***, ** and * designates p-values of <0.0001, <0.001, <0.01 and <0.05 respectively vs. vehicle of the Mann Whitney test.
Saa3 mRNA levels in lung tissue and SAA-3 protein levels in plasma
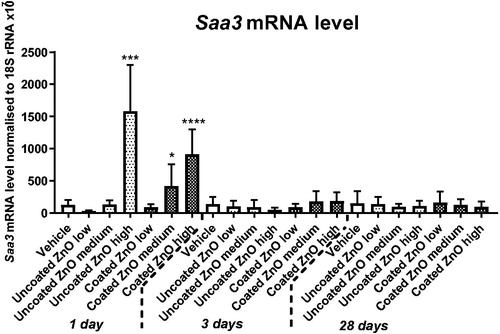
Acute increases in the Saa3 mRNA level were observed on day 1 following exposure to the highest dose of uncoated ZnO, and medium and high dose of coated ZnO (). There were no effects on the protein level of SAA-3 in plasma of mice exposed to uncoated ZnO, coated ZnO or in mice exposed to carbon black (data not shown).
Figure 4. Saa3 mRNA levels in lung 1, 3 and 28 days of ZnO nanoparticle exposure. Uncoated (uncoated ZnO) or triethoxycaprylylsilane-coated ZnO nanoparticles (coated ZnO) were administered by intratracheal instillation at 0.2, 0.7 or 2 µg/mouse. Low, medium and high designates low-dose, medium-dose and high-dose, respectively. Carbon black at 162 µg/mouse served as positive control. One, three or twenty-eight days post-exposure lung tissue was recovered and Saa3 mRNA levels measured by quantitative real time PCR. Data are mean and bars represent SD. ****, ***, ** and * designates p-values of <0.0001, <0.001, <0.01 and <0.05 respectively vs. vehicle of one way ANOVA with Holm–Sidak’s multiple comparisons test.
Levels of DNA strand breaks
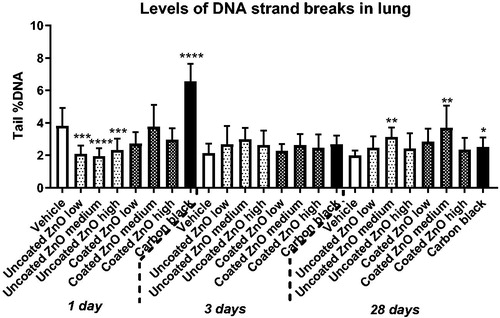
Levels of DNA strand breaks measured as percentage DNA in the tail was assessed in BAL fluid, lung and liver tissues. In BAL fluid, increased levels of DNA strand breaks were observed only for coated ZnO at low-dose at 28 days post-exposure (). In lung tissue, increased levels of DNA strand breaks was observed for both ZnO nanoparticles at day 28, but only in the medium-dose groups (). No increases in DNA strand break levels were observed in liver tissue (Figure S1). The positive control, carbon black, induced an elevated DNA strand break levels in the lung at 1 and 28 days post-exposure, as previously reported (Kyjovska et al. Citation2015b, Citation2015a) ().
Figure 5. Levels of DNA strand breaks in BAL fluid cells at 1, 3 and 28 days of ZnO nanoparticle exposure. Uncoated (uncoated ZnO) or triethoxycaprylylsilane-coated ZnO nanoparticles (coated ZnO) were administered by intratracheal instillation at 0.2, 0.7 or 2 µg/mouse. Low, medium and high designates low-dose, medium-dose and high-dose, respectively. Carbon black at 162 µg/mouse was included as reference material. One, three or twenty-eight days later BAL fluid cells were prepared and levels of DNA strand breaks measured as percent DNA in the tail by comet assay. Data are mean and bars represent SD. * designates p-values of <0.05 vs. vehicle of one way ANOVA with Holm–Sidak’s multiple comparisons test. In the case of carbon black data were tested with t-test.
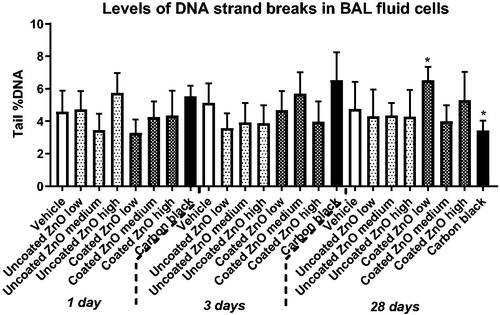
Figure 6. Levels of DNA strand breaks in lung tissue at 1, 3 and 28 days of ZnO exposure. Uncoated (uncoated ZnO) or triethoxycaprylylsilane-coated ZnO nanoparticles (coated ZnO) were administered by intratracheal instillation at 0.2, 0.7 or 2 µg/mouse. Low, medium and high designates low-dose, medium-dose and high-dose, respectively. Carbon black at 162 µg/mouse served as positive control. One, three or twenty-eight days later, lung tissue was recovered and levels of DNA strand breaks measured as percent DNA in the tail by comet assay. Data are mean and bars represent SD. ****, ***, ** and * designates p-values of <0.0001, <0.001, <0.01 and <0.05 respectively vs. vehicle of one way ANOVA with Holm–Sidak’s multiple comparisons test. In the case of carbon black data were tested with t-test.
Gene expression analysis
In addition to the targeted gene expression analysis, global gene expression profiling was conducted using microarrays to identify the genes and pathways perturbed by ZnO exposure. In general, the response at the gene expression level was larger in lungs of mice exposed to uncoated ZnO as compared to the coated ZnO treated lungs on day 1, some of which was still observed at day 28. However, the magnitude of the response was small with most genes showing fold changes around or less than 1.5. In uncoated ZnO-treated groups, a dose-dependent increase in the number of differentially expressed genes was observed (); a total of 49, 86 and 128 genes (day 1) and, 46, 74 and 85 genes (day 28) were upregulated and, a total of 55, 54, 54 genes (day 1) and 70, 64 and 75 genes (day 28) were downregulated at the low, medium and high doses, respectively. In comparison, coated ZnO treated groups did not show dose-dependency; on day 1, there were 30, 100 and 37 genes upregulated and 40, 47, 25 genes downregulated and, on day 28, there were 117, 188, and 107 genes upregulated and 70, 82 and 76 genes downregulated. In the coated ZnO-treated groups, the response was large at 28 days post-exposure. A further analysis of the differentially expressed genes and the associated canonical pathways revealed that the cell cycle G2M DNA damage checkpoint regulation pathway and functions related to cell cycle progression, segregation of chromosomes and alignment of chromosomes were the most significantly affected in mice exposed to medium and high doses of uncoated ZnO nanoparticles on day 1 (). The other pathways significantly altered following exposure to coated or uncoated ZnO nanoparticles included Circadian rhythm signaling; Protein ubiquitination pathway; Unfolded protein response; and AMPK signaling. Although acute phase signaling was one of the significantly affected pathways, the number of differentially expressed genes associated with this pathway was very low. Saa3 was the only acute phase gene that showed dose-dependent increases in mRNA level, which was observed only in mice exposed to uncoated ZnO nanoparticles.
Figure 7. Canonical pathways affected by 1 or 28 days of ZnO nanoparticle exposure. Uncoated (uncoated ZnO) or triethoxycaprylylsilane-coated ZnO nanoparticles (coated ZnO) were administered by intratracheal instillation at 0.2, 0.7 or 2 µg/mouse (designated: low, medium, and high). The deeper the coloring is, the higher the effect is on the specific canonical pathway. No effects were observed at the medium dose for the coated ZnO, thus this group is not included in the figure.
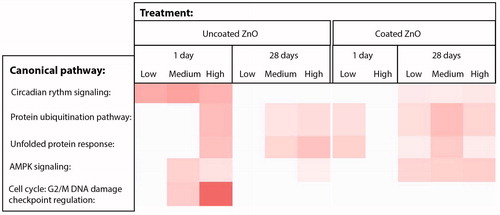
Table 2. Numbers of genes regulated with a p-value of less than 0.05.
Discussion
In this study, we investigated the acute-phase response, inflammation, and genotoxicity after pulmonary exposure to relatively low doses of ZnO nanoparticles. Mice were exposed via intratracheal instillation to 0.2, 0.7 or 2 µg/mouse, corresponding to 0.01, 0.33, and 0.1 mg/kg bw, of coated or uncoated ZnO nanoparticles. The tissue mRNA and plasma protein levels of SAA-3, BAL fluid cellularity and DNA strand breaks in BAL fluid, lung and liver tissues were measured to investigate the acute phase response, inflammogenic and genotoxic effects of the ZnO nanoparticles. Whole genome microarrays were used to identify the underlying mechanisms of toxicity in lungs.
Effects on the acute-phase response
We have previously shown pulmonary acute phase response in response to nanomaterial exposure. In our previous studies of global transcriptional responses to inhaled or instilled nanomaterials, we found dose-dependent pulmonary acute phase responses both in terms of the number of differentially regulated acute phase genes and fold increases of Saa3 mRNA levels (Halappanavar et al. Citation2011, Citation2015, Citation2019; Bourdon, Halappanavar, et al. Citation2012; Husain et al. Citation2013; Saber et al. Citation2014; Poulsen, Saber, Williams, et al. Citation2015). Saa3 is among the most differentially regulated genes 1-day post exposure to various nanomaterials (Halappanavar et al. Citation2019). Pulmonary Saa3 mRNA levels correlate closely with neutrophil influx (Saber et al. Citation2013, Citation2014; Poulsen et al. Citation2017) and SAA3 levels in plasma (Poulsen et al. Citation2017). In the current study, we, therefore, used Saa3 mRNA levels as a sensitive biomarker of the pulmonary acute-phase response. The Saa3 mRNA expression was increased in uncoated ZnO nanoparticle-treated groups at the highest dose (2 µg/mouse; 100 µg/kg bw) and for the coated ZnO nanoparticles at medium and high-doses (0.7 and 2 µg/mouse). Also in the microarray analysis, acute phase signaling was an affected pathway (data not shown), showing dose-dependent increases in Saa3 mRNA levels in mice exposed to uncoated ZnO nanoparticles (data not shown). The increased Saa3 mRNA expression was not reflected in an increased protein plasma level of SAA3. This may reflect that the contribution to the systemic circulation is too low to be detected. Notably, we have previously found a close positive correlation between pulmonary Saa3 mRNA levels and plasma SAA3 in mice exposed to MWCNTs (Poulsen et al. Citation2017). In humans, increased SAA and CRP levels are observed in the circulation as early as 4 h following inhalation of 0.5, 1 or 2 mg ZnO nanoparticles/m3. With an estimated inhalation volume of 20 m3/day during light activity and bw of 70 kg, this amounts to a cumulative exposure of 20 µg/kg bw/day (at 0.5 mg/m3 for 4 h) or to 10 µg/kg bw taking the alveolar deposition rate of ∼50% reported in (Monsé et al. Citation2018) into account. Likewise, the 1 and 2 mg/m3 mass concentration doses correspond to 20 and 40 µg/kg bw, respectively. The medium- and high-doses used in the present study are equal to 33 and 100 µg/kg bw, respectively. Thus, the medium dose corresponds to the highest doses given by (Monsé et al. Citation2018) by mass. It has been proposed, however, that a more correct conversion of doses from studies in animals to studies in humans is to normalize by body surface area (Reagan-Shaw, Nihal, and Ahmed Citation2008). If we scale by body surface area according to Reagan-Shaw, Nihal, and Ahmed (Citation2008), the high dose in the present study corresponds to 8 µg/kg bw in a Human Equivalent Dose and thus, corresponds to the lowest mass concentration studied by Monsé et al. (Citation2018). Based on these calculations and the results obtained, humans may activate acute phase response more readily following exposure to ZnO compared to the C57BL/6 mice used in the current study. In these mice, the lowest-observed-adverse-effect level (LOAEL) for induction of SAA3 in lung tissue was 100 µg/kg bw for the uncoated ZnO and 33 µg/kg bw for the coated ZnO, whereas the LOAEL for SAA in blood is calculated as 20 µg/kg bw for the human volunteers (Monsé et al. Citation2018). Several studies have demonstrated induction of localized acute phase response in lungs following inhalation exposure to nanomaterials and combustion particles (Halappanavar et al. Citation2011; Bourdon, Saber, et al. Citation2012; Saber et al. Citation2013, Citation2014; Poulsen et al. Citation2017). The activation of the systemic acute phase response in the liver in these studies was more limited and dependent on the type of nanomaterial and the magnitude of the lung acute phase and pro-inflammatory response. In humans, the liver is believed to be the major organ associated with acute phase reactions (Sack Citation2018), although SAA is also expressed in a range of normal human tissues including lung (Urieli-Shoval et al. Citation1998; Calero et al. Citation2014). Albeit these differences, the results from the present study suggests that mouse models can serve as the first pass screen in the investigation of particle-induced acute-phase response. The acute phase response, and especially serum amyloid A is causally implicated in atherosclerosis and cardiovascular disease (Saber et al. Citation2013, Citation2014). Mice have 3 inducible SAA isoforms, Saa1, Saa2 and Saa3 and simultaneous inactivation of all 3 isogenes lowers plaque formation in APOE knockout mice, whereas overexpression of Saa1 or Saa3 increases plaque formation (Dong et al. Citation2011; Thompson et al. Citation2018).
The ZnO-dependent systemic acute phase response observed in human volunteers (Monsé et al. Citation2018) constitutes a causal link between inhalation of ZnO particles and cardiovascular diseases. In addition to ZnO, also other metals and metal oxides induce metal fume fever and acute phase response (Greenberg and Vearrier Citation2015) and thus, occupational exposure to these metals may cause cardiovascular disease. Welding has been associated with increased risk of cardiovascular disease (Ibfelt, Bonde, and Hansen Citation2010); and acute phase response could potentially be used as a biomarker of cardiovascular risk in risk assessment and regulation.
Effects on pulmonary inflammation
The two ZnO nanoparticles investigated showed differential potential to induce pulmonary inflammation as increased neutrophil influx was only observed in the coated ZnO group. In agreement with this, inhalation exposure of male C56Bl/6 mice to 3.5 mg/m3 4 h/day, 5 days/week for two weeks to uncoated ZnO nanoparticles (15 nm in diameter) only increased neutrophil influx from 0.2% to 1.7% of the BAL cells, immediately after exposure (Adamcakova-Dodd et al. Citation2014). In the present study, such a small increase is expected to be below the detection limit because the procedure of instillation causes a low neutrophil influx 1 day post-exposure (Jackson et al. Citation2011). However, a similar, but non-statistically significant increase in neutrophil influx from 0.5% to 3.9% was seen for the uncoated ZnO nanoparticle on day 3 post-exposure. The observed differences in inflammatory response could be due to the differential solubility of the two ZnO types and the high level of protein in BAL from the ZnO-exposed mice could be a result of dissolution-mediated cytotoxicity (Müller et al. Citation2010; Eixenberger et al. Citation2017). ZnO nanoparticles of different sizes have been reported to induce neutrophil influx in BAL fluid in rat and mouse models following inhalation exposure to mass concentrations of 1 to 12 mg/m3 of ZnO nanoparticles (Conner et al. Citation1988; Ho et al. Citation2011; Adamcakova-Dodd et al. Citation2014; Chuang et al. Citation2014; Chen et al. Citation2015; Larsen et al. Citation2016). Following intratracheal instillation, increased neutrophil numbers in BAL fluid have been reported with ZnO particles of different sizes. Here, the LOAELs were in the range of 0.3 to 1 mg/kg bw in rat and mouse (Warheit, Sayes, and Reed Citation2009; Cho et al. Citation2010, Citation2011, Citation2012; Jacobsen et al. Citation2015). However, the doses used in these studies were higher than the highest dose used in the current study (100 µg/kg bw).
Genotoxicity
IARC has classified welding fumes as a Group 1 carcinogen (IARC Citation2018). As welding fumes contain zinc, the endpoints of genotoxicity and carcinogenicity are of interest in the hazard identification of ZnO nanoparticles. In the current investigation, we found no dose-response relationship for genotoxicity by comet assay across time points: increased levels of DNA strand break was only observed at single dose levels in BAL fluid cells and in lung tissue following exposure to both ZnO types. Nonetheless, genes and pathways associated with cell cycle progression and cell cycle checkpoint were identified in the microarray analysis () and dysregulation of these processes potentially induce genotoxicity. This could, for example, involve cytotoxicity. We observed ZnO instillation to increase the protein content in BAL fluid indicating increased cellular membrane permeability and cytotoxicity. The damaged cells could be arrested in G2/M phase of the cell cycle and eventually undergo senescence by apoptosis if not repaired.
There is evidence from others to suggest that ZnO nanoparticles are genotoxic; however, the results are not consistent. Increased oxidative damage (8-oxo-2'-dG) was observed following 3.7 and 45 mg/m3 of ZnO nanoparticles of 35 and 250 nm, respectively, in rats following 6 h inhalation (Ho et al. Citation2011). Similarly, increased 8-oxo-2'-dG levels were observed in rats intratracheally exposed to a high dose of 33 mg/kg bw of 50 nm ZnO nanoparticles (Chuang et al. Citation2014). In another study, one hour of inhalation exposure to 58 or 53 mg/m3 of ZnO nanoparticles of 13 and 36 nm did not exert increased genotoxicity as measured by the comet assay in mice (Larsen et al. Citation2016). Collectively, these results suggest that ZnO nanoparticles have the potential to induce genotoxicity; however, studies incorporating the diverse physical-chemical properties and, a range of dose and post-exposure time points are warranted.
Differences in toxicity of the coated and uncoated ZnO nanoparticles
The uncoated and the coated ZnO qualitatively induced similar responses. Both coated and uncoated ZnO nanoparticles induced the pulmonary acute phase response, increased the levels of total protein in BAL fluid, and genotoxicity at single doses and time points. However, only the coated ZnO affected body weight gain (day 2) and pulmonary inflammation in terms of neutrophil influx. In contrast, in the microarray analysis, the uncoated ZnO nanoparticle induced more differentially expressed genes day 1 post-exposure as compared to the coated ZnO nanoparticle, although the two nanoparticles perturbed the same pathways. On day 28 post-exposure, the highest number of differentially expressed genes was observed in the coated ZnO group. Again, it can be speculated that the differential transcriptional response to the two different ZnO nanoparticles could be caused by the differences in dissolution rates. The coated ZnO may dissolve slower than the uncoated ZnO nanoparticle, which is reflected by the increased differential gene expression on day 28. ZnO nanoparticles have been shown to quickly dissolve in biological tissues (Xia et al. Citation2008; Adam et al. Citation2014; Eixenberger et al. Citation2017). The dissolution behavior of the uncoated ZnO (NM-110) and the coated ZnO (NM-111) in water and cell culture medium have been previously studied; at the 1 µg/mL concentration, 60% of the uncoated ZnO dissolves in water at 24 h vs. 18% for the coated ZnO nanoparticle. In the cell culture medium, at the same concentration of 1 µg/mL, the dissolution rates of the uncoated ZnO were reduced to 47%, whereas, 39% of the coated ZnO was dissolved at 24 h, which is higher than the dissolution observed in water for this ZnO type (Kermanizadeh et al. Citation2013). In another study, the time-resolved dissolution kinetics in lysosomal fluid showed a transient delay (10 h) of the coated ZnO (NM-111) dissolution in comparison to the uncoated ZnO (NM-110) (Koltermann-Jülly et al. Citation2018). Thus, the observed differences in pulmonary responses to uncoated and coated ZnO exposure are consistent with the uncoated being more soluble than the coated. It has previously been shown that at Zn doses of 40, 100 and 400 µg/rat of either ZnO nanoparticles or Zn ions induce similar pulmonary toxicity in terms of neutrophil influx and protein in BAL, suggesting that zinc ions are at least partially responsible for the effects of pulmonary ZnO nanoparticle exposure (Jeong et al. Citation2016). We did not assess the ZnO content in the lungs of the exposed mice due to the low dose levels used (2 µg/mouse at the highest dose), which in combination with the endogenous Zn levels limits the chance of detection of treatment-related Zn. Nevertheless, despite this potential difference in dissolution kinetics, pulmonary exposure to both ZnO nanoparticles still induced differential gene expression 28 days after exposure and the coated ZnO nanoparticles induced increased neutrophil influx at this time point. This suggests that even the relatively low doses used in this study (0.1 mg/kg bw) induced long-term effects in mice.
Conclusion
Pulmonary exposure to relatively low doses of uncoated and triethoxycaprylylsilane-coated ZnO nanoparticles induced dose-dependent pulmonary acute phase response and pulmonary cytotoxicity in terms of increased total protein in BAL fluid. At the doses investigated, only weak non-dose-dependent genotoxic effects were observed. Only the coated ZnO nanoparticles induced pulmonary inflammation as measured by BAL fluid neutrophil influx and decreased body weight gain at day 2. The two ZnO nanoparticles perturbed similar pathways in the microarray analysis. Thus, the uncoated and coated ZnO nanoparticles overall induced similar responses and observed differences can most likely be attributed to differences in solubility kinetics. The pulmonary Saa3 response in mice was induced at ZnO dose levels that were comparable to the ZnO doses that induce systemic acute phase response in humans after inhalation exposure. This suggests that the murine pulmonary acute phase response may be used as a model to predict human acute phase response following exposure to metal oxides, including ZnO. Future studies looking into mechanisms of metal nanomaterial-induced acute phase response are warranted.
TNAN-2019-OR-0165-File009.docx
Download MS Word (84.8 KB)Acknowledgments
Michael Guldbrandsen, Lisbeth Meyer Petersen, Anne-Karin Asp, Yasmin Akhtar, Elzbieta Christiansen, Zdenka O Kyjovska, and Lourdes M. Pedersen are thanked for excellent technical assistance. The authors would like to acknowledge the contributions of Dr. Luna Rahman and Alex Lim-Sersan in the microarray data analysis and Dongmei Wu for her assistance in planning the microarray experiments.
Disclosure statement
No potential conflict of interest was reported by the authors.
Additional information
Funding
Related Research Data
References
- Adam, N., C. Schmitt, J. Galceran, E. Companys, A. Vakurov, R. Wallace, D. Knapen, and R. Blust. 2014. “The Chronic Toxicity of ZnO Nanoparticles and ZnCl2 to Daphnia Magna and the Use of Different Methods to Assess Nanoparticle Aggregation and Dissolution.” Nanotoxicology 8 (7): 709–717. doi:10.3109/17435390.2013.822594.
- Adamcakova-Dodd, A.,. L. V. Stebounova, J.S. Kim, S.U. Vorrink, A.P. Ault, P.T. O’Shaughnessy, V.H. Grassian, and P.S. Thorne. 2014. “Toxicity Assessment of Zinc Oxide Nanoparticles Using Sub-Acute and Sub-Chronic Murine Inhalation Models.” Particle and Fibre Toxicology 11 (1): 15. doi:10.1186/1743-8977-11-15.
- Baumann, R., S. Joraslafsky, A. Markert, I. Rack, S. Davatgarbenam, V. Kossack, B. Gerhards, T. Kraus, P. Brand, and M. Gube. 2016. “IL-6, a Central Acute-Phase Mediator, as an Early Biomarker for Exposure to Zinc-Based Metal Fumes.” Toxicology 373: 63–73. doi:10.1016/j.tox.2016.11.001.
- Beckett, W.S., D.F. Chalupa, A. Pauly-Brown, D.M. Speers, J.C. Stewart, M.W. Frampton, M.J. Utell, L.S. Huang, C. Cox, W. Zareba., et al. 2005. “Comparing Inhaled Ultrafine versus Fine Zinc Oxide Particles in Healthy Adults: A Human Inhalation Study.” American Journal of Respiratory and Critical Care Medicine 171 (10): 1129–1135. (1073–449X (Print)), doi:10.1164/rccm.200406-837OC.
- Blanc, P., H. Wong, M.S. Bernstein, and H.A. Boushey. 1991. “An Experimental Human Model of Metal Fume Fever.” Annals of Internal Medicine 114 (11): 930–936. doi:10.7326/0003-4819-114-11-930.
- Blanc, P.D., H.A. Boushey, H. Wong, S.F. Wintermeyer, and M.S. Bernstein. 1993. “Cytokines in Metal Fume Fever.” The American Review of Respiratory Disease 147 (1): 134–138. doi:10.1164/ajrccm/147.1.134.
- Bourdon, J.A., A.T. Saber, N.R. Jacobsen, K.A. Jensen, A.M. Madsen, J.S. Lamson, H. Wallin, P. Moller, S. Loft, C.L. Yauk., et al. 2012. “Carbon Black Nanoparticle Instillation Induces Sustained Inflammation and Genotoxicity in Mouse Lung and Liver.” Particle and Fibre Toxicology 9 (1): 5.(1743-8977 (Electronic)), doi:10.1186/1743-8977-9-5.
- Bourdon, J.A., S. Halappanavar, A.T. Saber, N.R. Jacobsen, A. Williams, H. Wallin, U. Vogel, and C.L. Yauk. 2012. “Hepatic and Pulmonary Toxicogenomic Profiles in Mice Intratracheally Instilled with Carbon Black Nanoparticles Reveal Pulmonary Inflammation, Acute Phase Response, and Alterations in Lipid Homeostasis.” Toxicological Sciences 127 (2): 474–484. (1096–0929 (Electronic)), doi:10.1093/toxsci/kfs119.
- Brand, P., M. Bauer, M. Gube, K. Lenz, U. Reisgen, V.E. Spiegel-Ciobanu, and T. Kraus. 2014. “Relationship between Welding Fume Concentration and Systemic Inflammation after Controlled Exposure of Human Subjects with Welding Fumes from Metal Inert Gas Brazing of Zinc-Coated Materials.” Journal of Occupational and Environmental Medicine 56 (1): 1–5. (1536-5948 (Electronic)), doi:10.1097/JOM.0000000000000061.
- Burnett, M.E., and S.Q. Wang. 2011. “Current Sunscreen Controversies: A Critical Review.” Photodermatology, Photoimmunology & Photomedicine 27 (2): 58–67. doi:10.1111/j.1600-0781.2011.00557.x.
- Calero, C., E. Arellano, J.L. Lopez-Villalobos, V. Sánchez-López, N. Moreno-Mata, and J.L. López-Campos. 2014. “Differential Expression of C-Reactive Protein and Serum Amyloid a in Different Cell Types in the Lung Tissue of Chronic Obstructive Pulmonary Disease Patients.” BMC Pulmonary Medicine 14 (1): 95. doi:10.1186/1471-2466-14-95.
- Chen, J.K., C.C. Ho, H. Chang, J.F. Lin, C.S. Yang, M.H. Tsai, H.T. Tsai, and P. Lin. 2015. “Particulate Nature of Inhaled Zinc Oxide Nanoparticles Determines Systemic Effects and Mechanisms of Pulmonary Inflammation in Mice.” Nanotoxicology 9 (1): 43–53. doi:10.3109/17435390.2014.886740.
- Cho, W.S., R. Duffin, C.A. Poland, A. Duschl, G.J. Oostingh, W. MacNee, M. Bradley, I.L. Megson, and K. Donaldson. 2012. “Differential Pro-Inflammatory Effects of Metal Oxide Nanoparticles and Their Soluble Ions in Vitro and in Vivo; Zinc and Copper Nanoparticles, but Not Their Ions, Recruit Eosinophils to the Lungs.” Nanotoxicology 6 (1): 22–35. doi:10.3109/17435390.2011.552810.
- Cho, W.S., R. Duffin, C.A. Poland, S.E. Howie, W. MacNee, M. Bradley, I.L. Megson, and K. Donaldson. 2010. “Metal Oxide Nanoparticles Induce Unique Inflammatory Footprints in the Lung: Important Implications for Nanoparticle Testing.” Environmental Health Perspectives 118 (12): 1699–1706. doi:10.1289/ehp.1002201.
- Cho, W.S., R. Duffin, S.E. Howie, C.J. Scotton, W.A. Wallace, W. MacNee, M. Bradley, I.L. Megson, and K. Donaldson. 2011. “Progressive Severe Lung Injury by Zinc Oxide Nanoparticles; the Role of Zn2+ Dissolution inside Lysosomes.” Particle and Fibre Toxicology 8 (1): 27. doi:10.1186/1743-8977-8-27.
- Chuang, H.C., H.T. Juan, C.N. Chang, Y.H. Yan, T.H. Yuan, J.S. Wang, H.C. Chen, Y.H. Hwang, C.H. Lee, and T.J. Cheng. 2014. “Cardiopulmonary Toxicity of Pulmonary Exposure to Occupationally Relevant Zinc Oxide Nanoparticles.” Nanotoxicology 8 (6): 593–604. doi:10.3109/17435390.2013.809809.
- Conner, M.W., W.H. Flood, A.E. Rogers, and M.O. Amdur. 1988. “Lung Injury in guinea Pigs Caused by Multiple Exposures to Ultrafine Zinc Oxide: Changes in Pulmonary Lavage Fluid.” Journal of Toxicology and Environmental Health 25 (1): 57–69. doi:10.1080/15287398809531188.
- Da Silva, E., Y. Kembouche, U. Tegner, A. Baun, and K.A. Jensen. 2019. “Interaction of Biologically Relevant Proteins with ZnO Nanomaterials: A Confounding Factor for in Vitro Toxicity Endpoints.” Toxicology in Vitro 56: 41–51. doi:10.1016/j.tiv.2018.12.016.
- Dong, Z., T. Wu, W. Qin, C. An, Z. Wang, M. Zhang, Y. Zhang, C. Zhang, and F. An. 2011. “Serum Amyloid a Directly Accelerates the Progression of Atherosclerosis in Apolipoprotein E-Deficient Mice.” Molecular Medicine (Cambridge, Massahcusets) 17 (11–12): 1357–1364. doi:10.2119/molmed.2011.00186.
- Eixenberger, J.E., C.B. Anders, R.J. Hermann, R.J. Brown, K.M. Reddy, A. Punnoose, and D.G. Wingett. 2017. “Rapid Dissolution of ZnO Nanoparticles Induced by Biological Buffers Significantly Impacts Cytotoxicity.” Chemical Research in Toxicology 30 (8): 1641–1651. doi:10.1021/acs.chemrestox.7b00136.
- Greenberg, M.I., and D. Vearrier. 2015. “Metal Fume Fever and Polymer Fume Fever.” Clinical Toxicology (Philadelphia, PA.) 53 (4): 195–203. doi:10.3109/15563650.2015.1013548.
- Halappanavar, S., A.T. Saber, N. Decan, K.A. Jensen, D. Wu, N.R. Jacobsen, C. Guo, J. Rogowski, I.K. Koponen, M. Levin., et al. 2015. “Transcriptional Profiling Identifies Physicochemical Properties of Nanomaterials That Are Determinants of the in Vivo Pulmonary Response.” Environmental and Molecular Mutagenesis 56 (2): 245–264., doi:10.1002/em.21936.
- Halappanavar, S., L. Rahman, J. Nikota, S.S. Poulsen, Y. Ding, P. Jackson, H. Wallin, O. Schmid, U. Vogel, and A. Williams. 2019. “Ranking of Nanomaterial Potency to Induce Pathway Perturbations Associated with Lung Responses.” NanoImpact 14: 100158. doi:10.1016/j.impact.2019.100158.
- Halappanavar, S., P. Jackson, A. Williams, K.A. Jensen, K.S. Hougaard, U. Vogel, C.L. Yauk, and H. Wallin. 2011. “Pulmonary Response to Surface-Coated Nanotitanium Dioxide Particles Includes Induction of Acute Phase Response Genes, Inflammatory Cascades, and Changes in microRNAs: A Toxicogenomic Study.” Environmental and Molecular Mutagenesis 52 (6): 425–439. doi:10.1002/em.20639.
- Hartmann, L., M. Bauer, J. Bertram, M. Gube, K. Lenz, U. Reisgen, T. Schettgen, T. Kraus, and P. Brand. 2014. “Assessment of the Biological Effects of Welding Fumes Emitted from Metal Inert Gas Welding Processes of Aluminium and Zinc-Plated Materials in Humans.” International Journal of Hygiene and Environmental Health 217 (2-3): 160–168. doi:10.1016/j.ijheh.2013.04.008.
- Ho, M., K.Y. Wu, H.M. Chein, L.C. Chen, and T.J. Cheng. 2011. “Pulmonary Toxicity of Inhaled Nanoscale and Fine Zinc Oxide Particles: Mass and Surface Area as an Exposure Metric.” Inhalation Toxicology 23 (14): 947–956. doi:10.3109/08958378.2011.629235.
- Husain, M., A.T. Saber, C. Guo, N.R. Jacobsen, K.A. Jensen, C.L. Yauk, A. Williams, U. Vogel, H. Wallin, and S. Halappanavar. 2013. “Pulmonary Instillation of Low Doses of Titanium Dioxide Nanoparticles in Mice Leads to Particle Retention and Gene Expression Changes in the Absence of Inflammation.” Toxicology and Applied Pharmacology 269 (3): 250–262. doi:10.1016/j.taap.2013.03.018.
- IARC. 2018. Welding, Molybdenum Trioxide, and Indium Tin Oxide. IARC Monographs on the Evaluation of Carcinogenic Risks to Humans Volume 118.
- Ibfelt, E., J.P. Bonde, and J. Hansen. 2010. “Exposure to Metal Welding Fume Particles and Risk for Cardiovascular Disease in Denmark: A Prospective Cohort Study.” Occupational and Environmental Medicine 67 (11): 772–777. doi:10.1136/oem.2009.051086.
- Jackson, P., L.M. Pedersen, Z.O. Kyjovska, N.R. Jacobsen, A.T. Saber, K.S. Hougaard, U. Vogel, and H. Wallin. 2013. “Validation of Freezing Tissues and Cells for Analysis of DNA Strand Break Levels by Comet Assay.” Mutagenesis 28 (6): 699–707. doi:10.1093/mutage/get049.
- Jackson, P., S.P. Lund, G. Kristiansen, O. Andersen, U. Vogel, H. Wallin, and K.S. Hougaard. 2011. “An Experimental Protocol for Maternal Pulmonary Exposure in Developmental Toxicology.” Basic & Clinical Pharmacology & Toxicology 108 (3): 202–207. doi:10.1111/j.1742-7843.2010.00644.x.
- Jacobsen, N.R., G. Pojana, P. White, P. Moller, C.A. Cohn, K.S. Korsholm, U. Vogel, A. Marcomini, S. Loft, and H. Wallin. 2008. “Genotoxicity, Cytotoxicity, and Reactive Oxygen Species Induced by Single-Walled Carbon Nanotubes and C(60) Fullerenes in the FE1-Mutatrade markMouse Lung Epithelial Cells.” Environmental and Molecular Mutagenesis 49 (6): 476–487. doi:10.1002/em.20406.
- Jacobsen, N.R., T. Stoeger, B.S. van den, A.T. Saber, A. Beyerle, G. Vietti, A. Mortensen, J. Szarek, H.C. Budtz, A. Kermanizadeh., et al. 2015. “Acute and Subacute Pulmonary Toxicity and Mortality in Mice after Intratracheal Instillation of ZnO Nanoparticles in Three Laboratories.” Food and Chemical Toxicology 85: 84–95. doi:10.1016/j.fct.2015.08.008.
- Jeong, J.,. S. Lee, S.-H. Kim, Y. Han, D.-K. Lee, J.-Y. Yang, J. Jeong, C. Roh, Y.S. Huh, and W.-S. Cho. 2016. “Evaluation of the Dose Metric for Acute Lung Inflammogenicity of Fast-Dissolving Metal Oxide Nanoparticles.” Nanotoxicology 10 (10): 1448–1457. doi:10.1080/17435390.2016.1229518.
- Kao, Y.Y., Y.C. Chen, T.J. Cheng, Y.M. Chiung, and P.S. Liu. 2012. “Zinc Oxide Nanoparticles Interfere with Zinc Ion Homeostasis to Cause Cytotoxicity.” Toxicological Sciences 125 (2): 462–472. doi:10.1093/toxsci/kfr319.
- Kermanizadeh, Ali, Giulio Pojana, Birgit K. Gaiser, Renie Birkedal, Dagmar Bilanicˇová, Håkan Wallin, Keld Alstrup Jensen, Börje Sellergren, Gary R. Hutchison, Antonio Marcomini., et al. 2013. “In Vitro Assessment of Engineered Nanomaterials Using a Hepatocyte Cell Line: Cytotoxicity, Pro-Inflammatory Cytokines and Functional Markers.” Nanotoxicology 7 (3): 301–313. doi:10.3109/17435390.2011.653416.
- KOBO_Products_Inc., 2017. Triethoxy Caprylylsilane. Accessed 15 May 2019. http://www.koboproductsinc.com/Downloads/Kobo-Silane.pdf
- Koltermann-Jülly, J., J.G. Keller, A. Vennemann, K. Werle, P. Müller, L. Ma-Hock, R. Landsiedel, M. Wiemann, and W. Wohlleben. 2018. “Abiotic Dissolution Rates of 24 (Nano)Forms of 6 Substances Compared to Macrophage-Assisted Dissolution and in Vivo Pulmonary Clearance: Grouping by Biodissolution and Transformation.” NanoImpact 12: 29–41. doi:10.1016/j.impact.2018.08.005.
- Kuschner, W G., A. D'Alessandro, S F. Wintermeyer, H. Wong, H A. Boushey, and P D. Blanc. 1995. “Pulmonary Responses to Purified Zinc Oxide Fume.” Journal of Investigative Medicine 43 (4): 371–378.
- Kyjovska, Z.O., N.R. Jacobsen, A.T. Saber, S. Bengtson, P. Jackson, H. Wallin, and U. Vogel. 2015a. “DNA Damage following Pulmonary Exposure by Instillation to Low Doses of Carbon Black (Printex 90) Nanoparticles in Mice.” Environmental and Molecular Mutagenesis 56 (1): 41–49. doi:10.1002/em.21888.
- Kyjovska, Z.O., N.R. Jacobsen, A.T. Saber, S. Bengtson, P. Jackson, H. Wallin, and U. Vogel. 2015b. “DNA Strand Breaks, Acute Phase Response and Inflammation following Pulmonary Exposure by Instillation to the Diesel Exhaust Particle NIST1650b in Mice.” Mutagenesis 30 (4): 499–507. doi:10.1093/mutage/gev009.
- Labib, S., C.H. Guo, A. Williams, C.L. Yauk, P.A. White, and S. Halappanavar. 2013. “Toxicogenomic Outcomes Predictive of Forestomach Carcinogenesis following Exposure to Benzo(a)Pyrene: Relevance to Human Cancer Risk.” Toxicology and Applied Pharmacology 273 (2): 269–280. doi:10.1016/j.taap.2013.05.027.
- Larsen, S.T., P. Jackson, S.S. Poulsen, M. Levin, K.A. Jensen, H. Wallin, G.D. Nielsen, and I.K. Koponen. 2016. “Airway Irritation, Inflammation, and Toxicity in Mice following Inhalation of Metal Oxide Nanoparticles.” Nanotoxicology 10 (9): 1254–1262. doi:10.1080/17435390.2016.1202350.
- Monsé, C., O. Hagemeyer, M. Raulf, B. Jettkant, V. van Kampen, B. Kendzia, V. Gering, G. Kappert, T. Weiss, N. Ulrich., et al. 2018. “Concentration-Dependent Systemic Response after Inhalation of Nano-Sized Zinc Oxide Particles in Human Volunteers.” Particle and Fibre Toxicology 15 (1): 8. doi:10.1186/s12989-018-0246-4.
- Müller, K.H., J. Kulkarni, M. Motskin, A. Goode, P. Winship, J.N. Skepper, M.P. Ryan, and A.E. Porter. 2010. “pH-Dependent Toxicity of High Aspect Ratio ZnO Nanowires in Macrophages Due to Intracellular Dissolution.” ACS Nano 4 (11): 6767–6779. doi:10.1021/nn101192z.
- Poulsen, S.S., A.T. Saber, A. Mortensen, J. Szarek, D. Wu, A. Williams, O. Andersen, N.R. Jacobsen, C.L. Yauk, H. Wallin., et al. 2015. “Changes in Cholesterol Homeostasis and Acute Phase Response Link Pulmonary Exposure to Multi-Walled Carbon Nanotubes to Risk of Cardiovascular Disease.” Toxicology and Applied Pharmacology 283 (3): 210–222. doi:10.1016/j.taap.2015.01.011.
- Poulsen, S.S., A.T. Saber, A. Williams, O. Andersen, C. Kobler, R. Atluri, M.E. Pozzebon, S.P. Mucelli, M. Simion, D. Rickerby., et al. 2015. “MWCNTs of Different Physicochemical Properties Cause Similar Inflammatory Responses, but Differences in Transcriptional and Histological Markers of Fibrosis in Mouse Lungs.” Toxicology and Applied Pharmacology 284 (1): 16–32.
- Poulsen, S.S., K.B. Knudsen, P. Jackson, I.E.K. Weydahl, A.T. Saber, H. Wallin, and U. Vogel. 2017. “Multi-Walled Carbon Nanotube-Physicochemical Properties Predict the Systemic Acute Phase Response following Pulmonary Exposure in Mice.” PLoS One 12 (4): e0174167. doi:10.1371/journal.pone.0174167.
- R Core Team. 2012. R: A language and environment for statistical computing. R Foundation for Statistical Computing.
- Rahman, L., N.R. Jacobsen, S.A. Aziz, D. Wu, A. Williams, C.L. Yauk, P. White, H. Wallin, U. Vogel, and S. Halappanavar. 2017. “Multi-Walled Carbon Nanotube-Induced Genotoxic, Inflammatory and Pro-Fibrotic Responses in Mice: Investigating the Mechanisms of Pulmonary Carcinogenesis.” Mutation Research/Genetic Toxicology and Environmental Mutagenesis 823: 28–44. doi:10.1016/j.mrgentox.2017.08.005.
- Rathnayake, S., J.M. Unrine, J. Judy, A.-F. Miller, W. Rao, and P.M. Bertsch. 2014. “Multitechnique Investigation of the pH Dependence of Phosphate Induced Transformations of ZnO Nanoparticles.” Environmental Science & Technology 48 (9): 4757–4764. doi:10.1021/es404544w.
- Reagan-Shaw, S.,. M. Nihal, and N. Ahmad. 2008. “Dose Translation from Animal to Human Studies Revisited.” FASEB Journal: Official Publication of the Federation of American Societies for Experimental Biology 22 (3): 659–661. doi:10.1096/fj.07-9574LSF.
- Reed, R.B., D.A. Ladner, C.P. Higgins, P. Westerhoff, and J.F. Ranville. 2012. “Solubility of Nano-Zinc Oxide in Environmentally and Biologically Important Matrices.” Environmental Toxicology and Chemistry 31 (1): 93–99. doi:10.1002/etc.708.
- Ridker, P.M., C.H. Hennekens, J.E. Buring, and N. Rifai. 2000. “C-Reactive Protein and Other Markers of Inflammation in the Prediction of Cardiovascular Disease in Women.” New England Journal of Medicine 342 (12): 836–843. doi:10.1056/NEJM200003233421202.
- Saber, A.T., I.K. Koponen, K.A. Jensen, N.R. Jacobsen, L. Mikkelsen, P. Moller, S. Loft, U. Vogel, and H. Wallin. 2012. “Inflammatory and Genotoxic Effects of Sanding Dust Generated from Nanoparticle-Containing Paints and Lacquers.” Nanotoxicology 6 (7): 776–788. doi:10.3109/17435390.2011.620745.
- Saber, A.T., J. Bornholdt, M. Dybdahl, A.K. Sharma, S. Loft, U. Vogel, and H. Wallin. 2005. “Tumor Necrosis Factor Is Not Required for Particle-Induced Genotoxicity and Pulmonary Inflammation.” Archives of Toxicology 79 (3): 177–182. doi:10.1007/s00204-004-0613-9.
- Saber, A.T., J.S. Lamson, N.R. Jacobsen, G. Ravn-Haren, K.S. Hougaard, A.N. Nyendi, P. Wahlberg, A.M. Madsen, P. Jackson, H. Wallin., et al. 2013. “Particle-Induced Pulmonary Acute Phase Response Correlates with Neutrophil Influx Linking Inhaled Particles and Cardiovascular Risk.” PLoS One 8 (7): e69020. doi:10.1371/journal.pone.0069020.
- Saber, A.T., N.R. Jacobsen, P. Jackson, S.S. Poulsen, Z.O. Kyjovska, S. Halappanavar, C.L. Yauk, H. Wallin, and U. Vogel. 2014. “Particle-Induced Pulmonary Acute Phase Response May Be the Causal Link between Particle Inhalation and Cardiovascular Disease.” Wiley Interdisciplinary Reviews: Nanomedicine and Nanobiotechnology 6 (6): 517–531. doi:10.1002/wnan.1279.
- Saber, Anne T, Nicklas R. Jacobsen, Jette Bornholdt, SannaL. Kjaer, Marianne Dybdahl, Lotte Risom, Steffen Loft, Ulla Vogel, and Håkan Wallin. 2006. “Cytokine Expression in Mice Exposed to Diesel Exhaust Particles by Inhalation. Role of Tumor Necrosis Factor.” Particle and Fibre Toxicology 3 (1): 4.
- Sack, G.H. 2018. “Serum Amyloid A - A Review.” Molecular Medicine (Cambridge, Massachussets) 24 (1): 46. doi:10.1186/s10020-018-0047-0.
- Thompson, J.C., P.G. Wilson, P. Shridas, A. Ji, M. de Beer, F.C. de Beer, N.R. Webb, and L.R. Tannock. 2018. “Serum Amyloid A3 Is Pro-atherogenic.” Atherosclerosis 268: 32–35. doi:10.1016/j.atherosclerosis.2017.11.011.
- Urieli-Shoval, S., P. Cohen, S. Eisenberg, and Y. Matzner. 1998. “Widespread Expression of Serum Amyloid a in Histologically Normal Human Tissues. Predominant Localization to the Epithelium.” Journal of Histochemistry & Cytochemistry 46 (12): 1377–1384. doi:10.1177/002215549804601206.
- Vogel, U., and F.R. Cassee. 2018. “Editorial: Dose-Dependent ZnO Particle-Induced Acute Phase Response in Humans Warrants Re-Evaluation of Occupational Exposure Limits for Metal Oxides.” Particle and Fibre Toxicology 15 (1): 7. doi:10.1186/s12989-018-0247-3.
- Wallin, H., Z.O. Kyjovska, S.S. Poulsen, N.R. Jacobsen, A.T. Saber, S. Bengtson, P. Jackson, and U. Vogel. 2017. “Surface Modification Does Not Influence the Genotoxic and Inflammatory Effects of TiO2 Nanoparticles after Pulmonary Exposure by Instillation in Mice.” Mutagenesis 32 (1): 47–57. doi:10.1093/mutage/gew046.
- Warheit, D.B., C.M. Sayes, and K.L. Reed. 2009. “Nanoscale and Fine Zinc Oxide Particles: Can in Vitro Assays Accurately Forecast Lung Hazards following Inhalation Exposures?” Environmental Science & Technology 43 (20): 7939–7945. doi:10.1021/es901453p.
- Xia, T., M. Kovochich, M. Liong, L. Mädler, B. Gilbert, H. Shi, J.I. Yeh, J.I. Zink, and A.E. Nel. 2008. “Comparison of the Mechanism of Toxicity of Zinc Oxide and Cerium Oxide Nanoparticles Based on Dissolution and Oxidative Stress Properties.” ACS Nano 2 (10): 2121–2134. doi:10.1021/nn800511k.