
Abstract
Engineered Nanomaterials (NMs), such as Superparamagnetic Iron Oxide Nanoparticles (SPIONs), offer significant benefits in a wide range of applications, including cancer diagnostic and therapeutic strategies. However, the use of NMs in biomedicine raises safety concerns due to lack of knowledge on possible biological interactions and effects. The initial basis for using SPIONs as biomedical MRI contrast enhancement agents was the idea that they are selectively taken up by macrophage cells, and not by the surrounding cancer cells. To investigate this claim, we analyzed the uptake of SPIONs into well-established cancer cell models and benchmarked this against a common macrophage cell model. In combination with fluorescent labeling of compartments and siRNA silencing of various proteins involved in common endocytic pathways, the mechanisms of internalization of SPIONs in these cell types has been ascertained utilizing reflectance confocal microscopy. Caveolar mediated endocytosis and macropinocytosis are both implicated in SPION uptake into cancer cells, whereas in macrophage cells, a clathrin-dependant route appears to predominate. Colocalization studies confirmed the eventual fate of SPIONs as accumulation in the degradative lysosomes. Dissolution of the SPIONs within the lysosomal environment has also been determined, allowing a fuller understanding of the cellular interactions, uptake, trafficking and effects of SPIONs within a variety of cancer cells and macrophages. Overall, the behavior of SPIONS in non-phagocytotic cell lines is broadly similar to that in the specialist macrophage cells, although some differences in the uptake patterns are apparent.
Introduction
A nanoparticle (NP) is commonly defined as a material with at least one dimension on the nanoscale (1–100 nm), and the term encompasses a broad range of particles including natural, incidental and manufactured or engineered nanoparticles and their applications (Hansen et al. Citation2008; Loehr et al. Citation2016; Moore Citation2006; Handy, Owen and Valsami-Jones Citation2008; Park et al. Citation2008). NPs often have very different properties to their bulk counterpart including surface area and optical/electrical properties, providing opportunities spanning a range of disciplines. Diagnostics and therapeutics are key application areas for nanotechnology; around 80% of NPs in clinical phases of development focus on anti-cancer strategies (Schütz et al. Citation2013). NPs can incorporate drugs, imaging agents and even genetic material, that can be passively or actively targeted to specific locations within the body, to increase specificity and reduce unwanted off-target toxicity (Iyer et al. Citation2006; Byrne, Betancourt and Brannon-Peppas Citation2008; Bahrami et al. Citation2017). Many applications utilize the inherent optical characteristics of NPs in biomedical imaging, such as the use of gold NPs for computerized tomography imaging contrast enhancement and quantum dots for cancer cell labeling (Gao et al. Citation2004; Re, Moresco, and Masserini Citation2012; Zhang, Ross, and Roeder Citation2010).
Small (<30 nm in diameter) magnetic NPs, such as iron oxide, have received considerable interest for use in biomedical applications due to their superparamagnetism (Bean and Livingston Citation1959; Mahmoudi et al. Citation2011; Fuchigami et al. Citation2012; Neuwelt et al. Citation2015). These superparamagnetic iron oxide nanoparticles (SPIONs) exhibit high magnetic susceptibility, such that upon application of an external magnetic field, magnetization can be induced (Mahmoudi et al. Citation2011; Kolhatkar et al. Citation2013). Following removal of the magnetic field the particles no longer show magnetization, which is important for biomedical applications as it prevents NP agglomeration and subsequent embolization of vessels. These properties, combined with the assumed biocompatibility, small size and modifiable surface area, render SPIONs particularly attractive candidates for use as Magnetic Resonance Imaging (MRI) contrast enhancement agents, for hyperthermia tumor therapy and as directed drug delivery systems (Hofmann-amtenbrink et al. Citation2009; Kievit and Zhang Citation2011; Wang and Cuschieri Citation2013; Neuwelt et al. Citation2015). The apparent selective uptake of SPIONs into macrophage cells, in particular, liver Kupffer cells, led to the initial use of SPION-enhanced MRI for hepatic lesion imaging (Stark et al. Citation1988; Reimer and Tombach Citation1998; Reimer et al. Citation2000; Bulte and Kraitchman Citation2004). Ultrasmall (<10 nm) SPIONs (uSPIONs), that are cleared though the lymphatic system, have since been used for contrast enhancement in lymph node imaging to aid the clinical staging of cancer metastasis (Wang Citation2015; Fortuin et al. Citation2017; Harisinghani et al. Citation2003; Choi et al. Citation2007). Other types of SPIONs include those larger than 300 nm (such as GastroMark), for bowel MRI contrast, and below 20 nm for bone marrow and perfusion imaging (Wang Citation2011). The magnetic properties of SPIONs also allow them to be specifically targeted to a pathological site using an applied external magnetic field, facilitating accumulation of a conjugated drug without the need for targeting ligands; the applied field can then be altered to modulate drug release, or drug release can be initiated enzymatically by changes in physiological conditions such as pH (Freeman, Arrott and Watson Citation1960; Goodwin et al. Citation1999; Kumar et al. Citation2010; Wahajuddin and Arora Citation2012; Wang Citation2015). However, a number of concerns remain with using magnetic fields to target deep into the body, including the active depth and field strength of magnets and the potential for localized iron overload (Singh et al. Citation2010; Wahajuddin and Arora Citation2012; Shen et al. Citation2015).
Various formulations of SPIONs have been introduced over the past few years for clinical applications, including ferumoxide (Feridex – USA, Endorem – Europe; Hydrodynamic Size (HDS) 120 – 180 nm), Ferucarbotran (Resovist – HDS 60 nm) and Combidex/Sinerem (30 nm) (European Medicines Agency Citation2008; Wang Citation2011). However, lack of clear benefits, efficacy, specificity and clinical data led to the withdrawal of the majority of SPIONs – Resovist in 2009; Ferumoxide and Combidex in 2008. Combidex has since been reintroduced in the Netherlands, indicating a good safety profile and therefore holds potential for continued use within lymphography (Fortuin et al. Citation2017). Inadequate understanding of NP-cell interactions and the post-internalization fate of the NPs are key data gaps for clinical SPIONs. There are numerous potential factors that determine the biological uptake, effects and fate of NPs that can be dependent upon the intrinsic NP properties themselves, the properties of the medium they are exposed to and the internalization properties of the cell populations being targeted or exposed (Lynch et al. Citation2013, Citation2014). Therefore, it is vital that the properties of NPs are extensively studied and characterized, in order to understand the subsequent biological effects and make accurate conclusions regarding dose-response within nanosafety investigations.
The conventional usage of SPIONs for MRI contrast assumes exclusion from the cells and tissues of interest, for example from solid tumors. Many of the traditional uses of SPIONs rely on their uptake by macrophage cells only. However, the ubiquity of NP uptake, even by non-phagocytotic cells, is now well established and thus we postulated that cancer cells also internalize SPIONs, thus potentially reducing their efficacy as contrast agents. NPs are efficiently internalized by a variety of cell types through a combination of uptake routes, including but not limited to, clathrin mediated endocytosis (CME), caveolar endocytosis, macropinocytosis and, in specialized cells, phagocytosis (Ivanov Citation2008; Sahay, Alakhova and Kabanov Citation2010; Gu et al. Citation2011; Zhao et al. Citation2011; Kafshgari, Harding and Voelcker Citation2015). Endocytosis pathways are often characterized by their sensitivity to different pharmacological inhibitors, a tool that can be manipulated with some success to determine the route of NP uptake into cells using tools such as microscopy (dos Santos et al. Citation2011a, Citation2011b; Kuhn et al. Citation2014). However, these inhibitors are often nonspecific and lead to unwanted side-effects (Ivanov Citation2008), and fail to completely shut-off NP uptake. Alternatively, NP uptake mechanisms can be deduced through red/green image overlays of NP signal with signal from cargo specific to certain pathways. However these types of overlays are subjective, and can only be truly representative when the channel histograms are roughly equal, a scenario that is unlikely when different fluorophores are used (Bolte and Cordelieres Citation2006; Soenen et al. Citation2010a, Citation2010b; Pike et al. Citation2017). Additionally, while colocalization studies can be indicative of NP and labeled cargo residing within a common membrane bound organelle, this does not necessarily imply a common mechanism of internalization. Determining the method of internalization solely by signal colocalization with a labeled pathway cargo is particularly confounding as different endocytotic routes can converge into a common early sorting compartment (Mayor, Presley and Maxfield Citation1993; Jovic et al. Citation2010). An alternative, more specific approach for investigating uptake mechanisms utilizes siRNA silencing of proteins that are instrumental to the functioning of specific internalization pathways.
Following uptake via receptor-mediated endocytosis, cargo, such as NPs, are encapsulated within vesicles that traffic through the endosomal transport network (Bucci et al. Citation1992; Ullrich et al. Citation1996; Vanlandingham and Ceresa Citation2009; Sandin et al. Citation2012). The highly conserved Rab GTPases are involved in the regulation of endosomal trafficking, and can therefore be used to identify specific compartments (Elkin, Lakoduk, and Schmid Citation2016). Rab5/5A regulates the kinetics of membrane trafficking through early endosomes, and plays a role in Rab7A recruitment (Bucci et al. Citation1992; Feng, Press, and Wandinger-Ness Citation1995; Elkin, Lakoduk, and Schmid Citation2016). Rab7 is involved in the process of maturation into the late endosomal compartment and the lysosome, and the ultimate fate of the cargo is often degradation in this acidic lysosomal compartment (Bucci et al. Citation1992, Citation2000; Ullrich et al. Citation1996; Vanlandingham and Ceresa Citation2009). Degradation of NPs can lead to the release of ions and, therefore, cellular toxicity. In the case of SPIONs, this could lead to the release of Fe3+ or Fe2+ ions within the cell, increase of which are associated with problems such as iron overload, disturbed iron homeostasis and symptoms of iron toxicity (Arbab et al. Citation2005; Levy et al. Citation2011). This is particularly relevant in the case of targeting NPs, where the local concentration is expected to be exceptionally high, particularly in tissues that lack replicative potential. For example, it has been indicated recently that uSPION injection in rodent models leads to thrombosis, oxidative stress (reactive oxygen species, ROS) and DNA damage in the heart (Nemmar et al. Citation2016). However, it has also been suggested that, with successful specific targeting, the production of ROS at a desired target (i.e. cancer cells – which are more sensitive to ROS) can be therapeutically advantageous, enhancing cancer cell death (Kwon et al. Citation2016). NPs may also escape a degradative fate if they are recycled back to the plasma membrane in Rab11 positive compartments or if they are released from the endo-lysosomal system into the cytoplasm (Ullrich et al. Citation1996).
There is obviously a complex interplay of factors that determine the uptake, trafficking, and toxicity of different NP preparations. More investigation is required to thoroughly understand the cellular interactions that occur during and following NP uptake in order to facilitate their safe and efficacious use in biomedical applications. Microscopy remains one of the most utilized techniques to study NPs, particularly for in vitro investigation. This is due to the resolution achievable and the ability to directly visualize signals in context with other cellular components when coupled with labelling or staining (Böse et al. Citation2014; Guggenheim et al. Citation2016; Karreman et al. Citation2016). Traditionally, Transmission Electron Microscopy (TEM) or confocal fluorescence imaging are used, however TEM is time consuming, laborious and low throughput, while the use of fluorescent tags has numerous limitations, including low sensitivity, difficult bio-conjugation, low quantum efficiency and photo-bleaching effects, in addition to potential alteration of NP surface chemistry if the label is surface-attached, a factor known to influence biological activity (Sugden Citation2004; Sigmund et al. Citation2008; Patskovsky et al. Citation2014; Bartczak et al. Citation2015; Quinn et al. Citation2015). An alternative for imaging of NPs is Reflectance Microscopy (RM), where NPs act as light reflective probes, akin to fluorescent labeling, enhancing the scattering of light and introducing strong contrast at their location within samples (Rastar et al. Citation2013; Guggenheim et al. Citation2017). The use of reflectance imaging therefore obviates the need for NP fluorescent labeling, and provides an alternative platform for visualizing NPs (Sokolov et al. Citation2004).
This work investigates the cellular interactions of clinically relevant SPIONs (Sienna+), which are used in sentinel lymph node biopsy in breast cancers (Karakatsanis et al. Citation2016). During clinical use, the injection volume of Sienna+ is 2 mL, containing 28 mg/mL of iron oxide NPs, totaling 56 mg injection dose of SPIONs. Here, Sienna+ uptake into different types of cells (cancer (A549 (alveolar lung), MDA MB 231 (breast cancer), HeLa (cervial) and THP-1 derived macrophages) was assessed following exposure to concentrations in the range of 60-280 µg/mL, using reflectance-based microscopy methods in conjunction with cellular fluorescent labeling and correlative microscopy. This was combined with automated analysis methods, allowing the assessment of uptake with higher throughput as compared to the conventional gold standard TEM imaging. Systematic inhibition of different pathways within the cells using siRNAs was utilized to determine which pathways are critical to SPION uptake in each cell line. The subsequent subcellular trafficking was then assessed, determining the lysosomal fate of the SPIONs. Simulation of the lysosomal environment in established fluid mixtures indicated the fate of the SPIONs within the lysosome. Correlative microscopy and automated analysis methods were applied to determine the subcellular nature of reflectant objects and confirm the findings of light microscopy. This combined approach allows for important conclusions regarding the fate of Sienna+ SPIONs in a range of cells for enhanced understanding of conditions for their safe use.
Methods
Nanoparticle suspensions
Sienna+ SPIONs (Endomagnetics, Sysmex UK) were used throughout. Nominal size of the NPs was 60 nm (4 nm core plus coating). NP stock solutions were sonicated (XUB18; Grant Instruments, Shepreth, UK) for 15 minutes prior to use and dispersed in Serum Containing Media (SCM) (Dulbecco’s Modified Eagle’s Medium (DMEM) or Roswell Park Memorial Institute (RPMI) 1640 medium, with 10% Fetal Bovine Serum (FBS), 1% Penicillin (P) and Streptomycin (S)), or Phosphate Buffered Saline (PBS), at the specified concentrations for subsequent experiments.
Nanoparticle characterization: dynamic light scattering (DLS)
Sienna+ SPION hydrodynamic diameter measurements were performed using a Zetasizer Nano ZS ZEN 3600 (Malvern Instruments Ltd, Malvern, UK). SPION stock solutions of 28 mg/mL were prepared and diluted in SCM or PBS to the required concentrations (280 µg/mL, 112 µg/mL, 56 µg/mL). Solutions were vortexed, and 800 µL of the solution was pipetted into a disposable DLS glass cuvette. Diameter was measured using a Standard Operating Procedure (SOP) for iron oxide: Refractive Index (RI) 2.42, absorption 0.5, 37 °C and water as dispersant. Measurements were taken a minimum of three times. Surface charge measurements were also acquired using the Zetasizer Nano ZS ZEN 3600 (Malvern Instruments Ltd, Malvern, U.K.). SPION solutions were prepared as above. The prepared solution (1 mL) was injected into a disposable folded capillary cell and the zeta potential was measured using an SOP for iron oxide; RI 2.42; absorption 0.5; 37 °C with water as the dispersant. Measurements were taken a minimum of 3 times.
Nanoparticle characterization: dissolution studies
Dissolution studies were performed at 96 or 144 hours in dH2O or artifical lysosoma; fluid (ALF). The full composition of ALF is published (Stebounova, Guio, and Grassian Citation2011). At time 0, solutions (200 mL) of SPIONS (7,000 ppb) were aliquoted into glass bottles and incubated at 37 °C. At each time point, the size by DLS and Zeta potential were measured as previously described and the pH of the solution noted. Samples were also prepared at each time point (from 24 hrs) during the dissolution studies for subsequent elemental analysis with ICP-OES to detect the level of Fe ions present within the sample supernatant. At each time point 10 mL of solution was transferred into a 3kda Millipore centrifuge tube (Satorious, UK) and subjected to centrifugal ultrafiltration at 5,000 g for 50 minutes. Upernatant samples were then acidified by addition of HNO3 to a concentration of 0.2% and stored at 4 °C for analysis. Prior to analysis, a calibration curve was constructed from iron standard solutions prepared by serial dilution of 1,000 ppm in 2% nitric acid and measured by ICP-OES. Analysis was performed on a Perkin Elmer ICP-OES Optima 8000 platform. A delay time of 60 seconds was implemented before each sample infusion and samples were analyzed in triplicate; read outs were given as the mean of three triplicates. Calibration standards were analyzed initially, followed by a blank. A flow rate of 1 mL/min was implemented with flush time of 10 seconds. A 30 s wash of 2% HNO3 was applied between each sample to eliminate any carry over.
Cell culture and maintenance
All cell culture techniques were performed under a sterile tissue culture hood (Gelaire BSB 4a laminar flow hood; Gelaire Pty Ltd, Australia or SterilGard, The Baker Company, Sanford, Maine). All solutions and equipment were bought sterile or sterilized by autoclave when required. A549 alveolar cells, HeLa carcinoma cells and MDA-MB231 breast cancer cells (all from Public Health England Culture Collections (PHECC), London UK) and THP-1 leukemia cells (Health Protection Agency Culture Collections (HPACC), UK) were cultured at 37 °C in 5% (v/v) CO2 atmosphere in T75 culture flasks (Invitrogen, UK) containing DMEM (Lonza) or RPMI 1640 media (Lonza) supplemented with 10% FBS (v/v) (BioSera Ltd., Boussens, France) (FBS) and 1% P/S (100 µg/mL, Invitrogen, UK). Adherent cells were grown to confluence and passaged using a standard trypsin-EDTA (0.25%:0.2%) protocol (Invitrogen, UK). Suspension cells were maintained at 2x10⁵ cells/mL and passaged by medium splitting.
THP1 differentiation
THP-1 cells (4 x 10⁴) were plated per well of a 24-well glass-bottom MatTek plate (MatTek Corp, Maryland, USA) or in 24 well plastic dishes containing 13 mm coverslips in complete RPMI containing 200 nM phorbol 12-myristate 13-acetate (PMA) (Sigma-Aldrich, UK) for 72 hours. Following PMA treatment, differentiation of THP-1 cells was enhanced by replacement of PMA containing medium with normal SCM without PMA and incubation for a further 48 hours in this PMA rest (PMAr) phase (Daigneault et al. Citation2010).
General NP uptake
HeLa, A549, MDA or THP-1 cells were cultured in appropriate dishes (35 mm MatTek dishes; 24-well MatTek cell culture imaging plates; gridded MatTek for correlative studies) and incubated overnight. Cells were treated with Sienna+ SPIONS prepared as previously described to final concentrations of 280 µg/mL, 112 µg/mL or 56 µg/mL in SCM for either 1 hour, 15 mins or 5 minutes (detailed in the relevant experiments). Following incubation, cells were washed with PBS (x3) and then treated with CellTracker Orange (CTO) diluted 1:1000 using the standard protocol (Invitrogen, UK) for 30 minutes. Cells were then washed twice with PBS followed by SCM incubation for 30 min. Cells were washed twice with PBS and then fixed using 4% PFA unless otherwise stated. Prior to imaging, PBS was replaced with Vectashield (VS) mounting medium containing 4',6-Diamidino-2-Phenylindole, Dihydrochloride (DAPI) (Vector Laboratories Ltd, Peterborough, United Kingdom). Coverslips were removed from wells using tweezers and mounted cell side down with VS containing DAPI, with excess mountant removed by blotting with tissue. Coverslips were held in place with nail varnish. Slides were stored at 4 °C in a refrigerator prior to imaging.
DNA and siRNA constructs
The Rab5-mRFP construct was a gift from Ari Helenius (Institute of Biochemistry, ETH, Zurich). The Rab11-mRFP construct was a gift from Prof. Thomas Kirchausen (Harvard Medical School, Boston, USA). A non-silencing control (NSC) siRNA (ON-TARGETplus NON-targeting siRNA; Dharmacon) designed for use with rat, mouse or human cell lines was employed as a negative control. The α-adaptin (AP2 inhibition) siRNA was custom made with target sequence: 5′-AAGAGCAUGUGCACGCUGGCCA-3′ as used in previous studies (Rappoport and Simon Citation2009). The caveolin-1 siRNA was a SMARTpool of 4 siRNAs (ON-TARGETplus Human Cav1 siRNA; Dharmacon) targeted to caveolin-1. The P21-protein activated kinase (PAK-1) siRNA was custom made with target sequence: 5′-UGAAUGUCUAGGCCGUUAU-3′.
Transfection: cDNA transfection
Cells (1x10⁵) were plated in each well of a glass-bottom 24-well MatTek plate (MatTek), or 24 well plastic bottom dishes containing 13 mm coverslips, 24 hours prior to transfection to give approximately 70-80% confluence. Cells were then either transfected with cDNA for Rab5a, Rab7 or Rab11a or left untransfected for treatment with Lysotracker DND-99 (Invitrogen, UK). To perform the transfection: per well, one tube containing 0.5 µg cDNA with 50 µL of Opti-MEM medium (Thermofisher, UK) solution and a second tube containing 1.5 µL lipofectamine 2000 (LF2000; Invitrogen) with 50 µL Opti-MEM medium were prepared. Following 5 minute Room Temperature (RT) incubation, the tubes were combined and incubated for a further 15 minutes at RT. The mixture was then added drop-wise to the cells. Cells were incubated for 3 hours before the medium was replaced with fresh SCM. A second round of transfection was carried out 24 hours post initial transfection to increase transfection efficiency. Following 48 hr transfection, cells were treated with SPIONs diluted in SCM, prepared as previously described, for one hour. For the lysosomal colocalization studies, 15 minutes before the end of the incubation cells were treated with Lysotracker to stain acidic lysosomal compartments. Following treatment, cells were washed with PBS (X3) and fixed in 4% PFA as described above.
Transfection: SiRNA transfection
Cells (2 x 10⁵) were plated per well of a 6-well plate 24 hours prior to transfection. Culture media was replaced with Opti-MEM media just prior to transfection treatment. Per well, one tube containing 7.5 µL Lipofectamine RNAiMAX with 150 µL OptiMEM medium and a second tube containing 3.75 µL (or 25 pmol) of siRNA with 150 µL Opti-MEM medium was prepared. Following 5 minutes incubation at RT, the tubes were combined and incubated for a further 15 minutes at RT. The mixture was then added drop-wise to the cells. Medium was replaced with fresh SCM 24 hours post transfection to maximize efficiency and cell viability. A second round of transfection is often necessary to increase transfection efficiency of stable proteins such as AP2 (Motley et al. Citation2003). Therefore 24 hours post transfection cells were detached and re-plated into 24 well plates using a standard trypsin EDTA protocol. A second round of transfection was then carried out 48 hours post initial transfection. Following the 72 hrs siRNA transfection treatment performed as described, cells were treated for 1 hour with 280 µg/mL SPIONs prepared as previously described, followed by a further 30 min incubation with CTO. Cells were then washed with PBS (X3) and fixed in 4% PFA, and stored at 4 °C for imaging.
Western blotting was used to quantify relative protein levels following knockdown via siRNA transfection. Following the specific treatment, cells were lysed in 1% Triton X-100 (Sigma, UK) in PBS containing protease inhibitor cocktail (Roche, UK). Lamelli buffer (3X) was added in a 2:1 ratio to the lysate. Western blots were performed using the Mini-Protean Tetra Electrophoresis System (BioRad) with the standard protocol. All acrylamide gel details, running, transfer and Tris-Buffered Saline with Tween (TBST) buffer recipes were prepared as standard. Briefly, proteins were separated by Sodium Dodecyl Sulfate (SDS) Polyacrylamide Gel Electrophoresis (PAGE) on a 12.5% acrylamide resolving gel with a 4% acrylamide stacking gel at 100 mV. Gels were transferred onto nitrocellulose membranes. The membrane was blocked in 5% milk solution for 1 hr at RT and subsequently probed with the relevant primary antibody in 5% milk overnight at 4 °C. The next day the membranes were washed (4 x TBST) and probed with the relevant secondary antibody for 2 hours at RT. Primary antibodies used were polyclonal rabbit anti-AP2 (Santa Cruz Biotechnology), polyclonal rabbit anti-Cav1 (Abcam), polyclonal rabbit anti-Pak1 (Abcam) and monoclonal mouse anti-Tubulin (Tub) (Sigma). Secondary antibodies used were goat anti-rabbit IRDye 800 and goat anti-mouse IRDye 680 (Li-Cor Biosciences) for use with an Odyssey Infrared Detection System (Li-Cor Biosciences). Quantification of knockdowns was done relative to Tub and Non-Silencing Control (NSC) using ImageJ/FIJI software.
Protein corona isolation
Western blotting was used to identify proteins present in the protein corona following isolation from SCM using stepwise centrifugation steps (Monopoli et al. Citation2013). Following protein separation with PAGE, coomassie and silver staining were employed for identification of protein corona constituents. Gels were first washed with dH20. Gels were then stained with coomassie brilliant blue R-250 (Thermo Fisher Scientific) at RT for one hour as per the manufacturer’s protocol. Gels were de-stained overnight at RT to visualize bands, again as per manufacturer’s standard protocol. Following coomassie staining, silver staining was performed using Proteosilver Staining Kit (Sigma-Aldrich, UK) as per the manufacturer’s protocol to identify proteins of low concentration (sensitivity 0.1 ng/mm2). Briefly, gels were washed with ethanol, sensitized with silver stain sensitizer, washed with dH2O, then developed with developer solution. The reaction is stopped when bands become visible. Bands were then excised from the gels for LC-MS/MS analysis. Proteins were reduced for 15 min at 60 °C using 10 nM DTT and then alkylated at room temperature for 45 minutes with 50 mM iodoacetamide. Proteins were subsequently digested for 16 h at 37 °C using trypsin. Peptides were enriched using ZIPTIPs to remove any remaining surfactants and other contaminants. Samples were injected onto an Ultimate 3000 HPLC (Dionex, Sunnyvale, CA, USA) for sample concentration and separation. Peptides were concentrated on a Thermo C18 PepMAp 100 trapping column (3 µM, 75 µm x 2 cm) and separated on a Thermo Nano Series C18 PepMax Nano Series column (3 µM, 75 µm x 15 cm, 100 Å) (Thermofisher Scientific, UK). The solvent system was 0.1% formic acid in water (mobile phase A) and 0.1% formic acid in acetonitrile (solvent B), with a linear gradient of 3.2% A to 44% B in 30 minutes at 350 nL/min. Peptides were eluted directly via a Triversa Nanomate nanospray source (Advion Biosciences, NY) into an LTQ Orbitrap Elite mass spectrometer (ThermoFisher Scientific, Germany). In full scan mode spectra were collected over a m/z range of 380–1800 at a resolution of 120,000 (at 400 m/z), data dependant analysis precursor selection was implemented to take the top 7 most intense ions in each survey scan for collision induced dissociation MS/MS analysis at a normalized collision energy of 35%. The MS and MS/MS scans were searched against the Uniprot database using Proteome Discoverer 1.4 for human and bovine (ThermoFisher Scientific) with SequestHT algorithm using carbamidomethylation for fixed modifications and variable modifications for acetylation (N terminus), acetylation (K), oxidation (M) and phosphorylation (STY). The precursor mass tolerance was 10 ppm and the MS/MS mass tolerance was 0.8 Da. Two missed cleavages were allowed and the data were filtered with a strict false discovery rate (FDR) of 0.01 and a relaxed FDR of 0.05. The protein grouping filter was applied and a minimum of two high confident peptides (strict FDR 0.01) were accepted as a real hit.
TEM processing and microscopy
SPIONs (8 µL) were dropped onto 200 mesh Formvar film copper grids (Agar Scientific, UK). Following blotting, grids were left to dry for 24 hours prior to imaging with TEM. TEM images were recorded on a LaB 6 filament JEOL1200 TEM operating at an accelerating voltage of 80 keV at a 50,000X magnification. Images were recorded by a Gatan wide-angle CCD camera.
Cellular TEM processing was carried out using standard TEM processes of fixation, dehydration, infiltration, trimming and sectioning as detailed previously (Guggenheim et al. Citation2016). Cellular TEM imaging was carried out on an FEI Tecnai G2 Spirit operating at 80 keV (FEI, Center for Advanced Microscopy, Northwestern University, Chicago, IL). Images were taken with a Gatan imaging camera. 200 mesh Formvar coated copper TEM grids were loaded into the TEM and cells of interest, that were previously imaged during RCM and R-SIM experiments, were located on low (690X) magnification, and then imaged at higher magnification (up to 49,000X) to visualize individual and clusters of NPs. TEM processing was performed as previously described for correlative experiments (Guggenheim et al. Citation2016).
Microscopy: confocal and SIM
Cells immersed in VS or PBS were imaged using a Nikon A1R inverted confocal microscope (Nikon Corp, Japan). Images were acquired using Nikon A1R (BALM, UK or NIC, Chicago). To set up the reflectance optical configuration in NIS Elements, the first dichroic mirror was set to B520/80 to facilitate light transmission and reflectance, the fourth channel was set up for reflectance imaging using the 488 nm laser, and all channel light paths were set to through. The CTO stain was excited using the 561 nm laser, DAPI nuclear stain was excited using the 405 nm laser. Red fluorescent protein (RFP) and lysosomal stain were also excited using the 561 nm laser. The same samples were imaged using reflectance Structured Illumination Microscopy (R-SIM) (Nikon Corp., Japan) with an EM-CCD camera iXon3 DU-897E (Andor Technology Ltd.). To facilitate reflectance SIM image acquisition, a half mirror (50% transmitted/50% reflected) filter cube was placed into the light path. The 488 nm or 405 nm laser was used to illuminate the sample using 2 D-SIM imaging. The 561 nm laser was used to excite cytoplasmic CTO stain in wide-field mode. The 561 nm laser was also used to excite RFP and lysosomal stain in 3 D-SIM acquisitions.
Image processing and analysis
Image processing and analysis were conducted with FIJI (ImageJ) or MATLAB 2011 b/2016a/2017b. For TEM imaging: image filtering was performed (filter size 4; sigma 2), and objects were detected using thresholding. The boundaries of the regions detected in the original image, Supplementary Figure S1(B), are shown in red in Supplementary Figure S1(C). Once the objects were detected, the area of each object was measured as a pixel area, which was converted into a diameter (in nm) using πr2 and the known pixel size using the assumption of a sphere. For all cell experiments, cells were segmented manually or automatically using FIJI and MATLAB. Results were calculated as an average over the specified number of cells. For NP uptake experiments, NP regions were also segmented (MATLAB) and where fluorescent markers were used these too were segmented automatically. The automated procedure is indicated in Supplementary Figure S4). Briefly, it comprises the use of image filtering, background subtraction, and signal detection (NP (reflectance), cell outline (fluorescent 561 nm) and nuclear outline (fluorescent 405 nm)) through K-means unsupervised clustering. This is followed by an iterative process that assesses properties of cells on an individual basis using ‘for’ loops, collates the data and displays it graphically (Supplementary Figure S4).
Statistical analysis
Statistical analysis was performed using students t-test where two comparisons were being made or determined by ANOVA and subsequent multiple comparisons (Tukey-Kramer) in MATLAB when more than two sets of results were being compared. In each case the significance levels were: ***p < 0.001; **p < 0.01; *p < 0.05.
Results
Nanoparticle characterization: TEM
TEM was performed to examine the Sienna+ SPION stock solution. TEM is the gold standard for NP imaging due to the ultrahigh-resolution offered and the ability to visualize individual NPs. The mean of the 902 detected regions or NP cores was 4.5 nm ± 2.7; the median value was 4.1 nm. This agrees with the manufacturer’s specifications of a 4.2 nm core. As seen in Supplementary Figure S1(A), the SPION size distribution is relatively narrow, with the peak between 4 and 5 nm. However, SPIONs appear as larger structures (possible agglomerates) in some areas (Supplementary Figure S1(A,B)). This was evidenced in the distribution plot in Supplementary Figure S1(A), where a small percentage of NPs are observed with a diameter >10 nm. The maximum diameter observed is 25.99 nm.
NP characterization: DLS and zeta potential
NP properties, including Zeta potential, size, and size distribution (as indicated by the polydispersity index, PDI) by DLS were measured in the different media, including Phosphate Buffered Saline (PBS), Dulbecco’s Modified Eagles Medium (DMEM) Serum Containing Media (SCM), Roswell Park Memorial Institute (RPMI) SCM and Artificial Lysosomal Fluid (ALF) (). The p-value for the 1-way ANOVA performed on the data for size, zeta, PDI and pH respectively are (0.0012, 0.0046, 0.1699 and 1.7x10⁻¹²). Post-Hoc testing (Tukey-Kramer) in MATLAB indicated that the size of the SPIONs measured by DLS is statistically significantly different between ALF and the other three conditions. The same method of post hoc testing also indicated that the measured zeta potential of the PBS sample was significantly different from the zeta potential of the other three media tested. No significant difference was seen between observed PDIs.
Table 1. Summary of the main physiological properties of SPIONs in the different media used for experiments including control measurements in PBS, SCM (DMEM and RPMI) and the artificial lysosomal fluid (ALF).
According to the manufacturer, the nominal average hydrodynamic diameter of Sienna+ SPIONs is 60 nm (4 nm core plus coating); this appears to agree with our results obtained in PBS solution where a z-average diameter of 58 ± 3.9 nm and peak-1 intensity of 70.16 nm ± 0.25 nm was observed. DLS data for the suspension DMEM-SCM control without NP presence gave rise to two peaks at 10 nm and 70 nm of similar magnitude, corresponding to protein and lipid aggregates from the serum (Supplementary Figure S2(A)). Upon NP immersion into biological media, DMEM-SCM and RPMI-SCM ( and Supplementary Figure S2), the hydrodynamic size of the NPs increased compared to the NP-PBS sample up to 65.05 nm and 65.7 respectively; this likely indicates a combination of agglomeration and protein adsorption to the surface of the NPs. There was also a decrease in the observed 10 nm peak intensity with increasing concentration of NPs compared to the SCM control, indicating a decrease in the contribution of free protein in the media due to NP-protein binding (Supplementary Figure S2(B)). The PDI of the NP preparation also increased following the addition of DMEM/RPMI-SCM (). This may be expected, as protein adsorption to the NP surface can lead to changes in the hydrodynamic size as well as inducing bridging between NPs. The properties of the SPIONs were also measured in the ALF solution to indicate their properties inside the acidic lysosome environment.
Properties of NP suspensions can also change over time; when dispersed in an aqueous media NPs tend to interact with their surroundings. This can lead to agglomeration into larger loosely bound structures or strongly bound aggregates. Therefore, the physicochemical properties were measured over a 2-hour time course (the duration of the uptake and localization experiments), in DMEM/RPMI-SCM. No significant change in size, size distribution or charge, and in solution pH were observed throughout the 2-hour experimental time course (Supplementary Figure S2). Given that the Sienna+ SPIONs are coated in carboxydextran, it is likely that steric effects are the main initial stabilizing forces within these NP suspensions, as is also the case for dextran-coated SPIONs in suspension (Sonvico et al. Citation2005).
Toxicity of SPIONs measured by SYTOX staining intensity
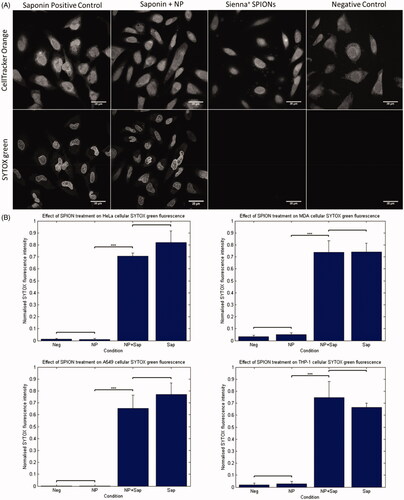
Sienna+ toxicity was assessed in MDA, HeLa, and A549 cancer cells, along with THP-1 derived macrophages via assessment of membrane permeabilization. THP-1 monocytes were differentiated into macrophages using a published protocol (Daigneault et al. Citation2010). Differentiation was confirmed using microscopy, known morphology of THP-1 derived macrophages and FACS to assess side scatter, forward scatter, and CDC36 expression (Supplementary Figure S3). Cancer cells and THP-1 derived macrophages were exposed to SPIONs at a concentration of 280 µg/mL. SYTOX green was applied to the cells 24 hrs post SPION incubation and cells were fixed and mounted in VS containing DAPI. A positive control for membrane damage (saponin) was included. Saponins selectively interact with membrane cholesterol, removing it and forming membrane pores allowing SYTOX uptake into the cell where it binds DNA leading to fluorescence (Lacaille-Dubois and Wagner Citation1996).
The characteristic SYTOX staining of nuclei can be seen in cells treated with saponin, however, this was not evident in SPION treated cells or negative controls. NP treatment at 280 µg/mL, therefore, does not appear to have caused cellular damage or death, as measured by membrane permeabilization (). Previous evidence suggests that some NPs can bind to, or react with, some toxicity assay components causing interference and limiting the interpretation of the particular assay without appropriate controls (Ong et al. Citation2014). To rule out the possibility of NPs binding to SYTOX dye, thus preventing fluorescence in the presence of membrane damage, a saponin + SPION treated control was included. shows example confocal images from HeLa cells depicting the SYTOX green staining and cell cytoplasm stain. It is clear that no SYTOX intensity is visualized in the negative control or SPION treated samples. These same trends were seen in all other cell lines tested (MDA, A549 and THP-1 derived macrophages). No statistically significant difference was seen between the negative control cells and the Sienna+ treated cells in any cell line tested. Additionally, no significant difference was seen between saponin treated cells and the NP-saponin treated cells. There was however a significant difference between the NP treated group/negative control and the cells that included saponin in the treatment (). The addition of the NP-saponin indicated that NPs caused an apparent small reduction in the amount of nuclear staining compared to the saponin alone positive control, however this was not statistically significant.
Figure 1. SYTOX green assay for membrane permeabilization. (A) HeLa cells exposed to Saponin, Saponin + NP, NP alone and control. The top panel shows cytoplasmic stain, 24 h following NP incubation with 280 µg/mL SPIONs. Bottom panel shows SYTOX green fluorescence that is evident in both samples treated with saponin, and not in the negative control or NP treated samples. (B) Graphical representation of the quantification of nuclear SYTOX intensity, analyzed automatically using MATLAB. Significant differences were seen between saponin treated samples and non-saponin treated samples only. Students t-Test gave significance of p < 0.001 between saponin treated and non-saponin treated samples in each cell line.
Uptake of SPIONs into different cancer cell lines: A549, MDA, HeLa, and THP-1 derived macrophages
The uptake of SPIONs was assessed in four different cell types including A549, HeLa, MDA and THP-1 derived macrophages at a variety of exposure times (1 hr, 15 mins and 5 mins) and concentrations (280 µg/mL, 112 µg/mL and 56 µg/mL). It is apparent from , in the treated images compared to the controls, that SPIONs are efficiently internalized into all cell lines tested under these exposure conditions, indicating that all cell lines are capable of internalizing SPIONs. Although uptake is clearly seen, when comparing treated ( top panel) and control cells ( bottom panel), it is very difficult to ascertain differences between the cell lines themselves based on judgment alone. The uptake of SPIONs into these different types of cells can be quantified using verified automated processing and analysis workflows (Supplementary Figure S4). Although any number of different parameters can be measured during this process, intensity measurements across single cells and number of detected regions are the primary indications for NP uptake assessed here.
Figure 2. Uptake of SPIONs into cancer cells and THP-1 derived macrophages. (A) RCM images show SPION internalization into different cell lines. Uptake is evident in all cell lines. NPs highlighted with arrows. (B) The graphs show comparisons of the average (mean) intensity of cells following a treatment with 280 µg/mL SPIONs for different time points (left) and incubated for 1 h at different concentrations (right). Statistical significance was calculated using MATLAB ANOVA, ‘anova1’, and ‘multcompare’ functions. Multcompare uses Tukey-Kramer post hoc testing by default. THP-1 cells appeared to internalize NPs significantly more than the cancer cells p < 0.001.
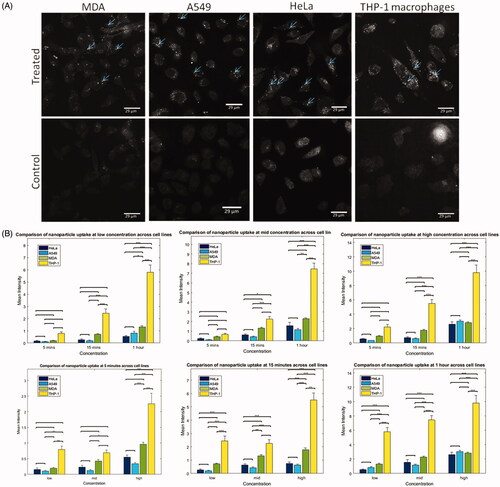
Supplementary Figure S5 compares the mean cellular intensity for the exposed cells for each cell line tested, grouped by concentration and time points. Increased SPION exposure time and exposure concentration lead to increased cellular intensity in all cell lines tested (Supplementary Figure S5) as expected, with no indication of saturation. In some cases, significant differences between different time points treated with the same concentration were observed (THP-1, MDA, and A549). This may indicate a stronger dependence on time for uptake. MDA cells show significantly different uptake amounts at nearly all concentrations and time points tested, which may indicate an increased sensitivity to NP uptake, through an increased amount of receptor availability at the surface of these cell types, or as a result of MDA cells utilizing multiple pathways or experiencing a certain level of membrane damage, leading to increased NP internalization, particularly at the earlier time points. Due to the small differences seen between uptake amounts at lower concentrations and time points (Supplementary Figure S5), the results obtained for each cell line at the highest tested concentration and longest exposure time points were compared (). THP-1 macrophages internalize more NPs when compared to the cancer cell models, however when uptake is compared at the shortest time point the difference was not significant. Macrophages possess specialized internalization capabilities, termed phagocytosis which differs from conventional endocytosis, and involves formation of large intracellular phagosomes (>5µm in size), resulting in the engulfment of large amounts of foreign material (Aderem and Underhill Citation1999). Based on the results seen here, it may be inferred that the route of uptake within macrophages could differ to that of other cell types, which has previously been suggested (Wahajuddin and Arora Citation2012). Again, time seems to have a more significant effect than concentration on THP-1 uptake of NPs (based on the 56 μg/mL and 5 mins results) (). When comparing MDA, HeLa and A549 cells, similar levels of uptake are observed, and no statistical difference between groups is seen, as measured by an ANOVA and multiple comparisons (Tukey-Kramer) in MATLAB. This may imply a similar route of uptake in these cell lines that may differ to that of macrophages.
To consider the possibility of differences in uptake amount between the cell lines at the lower concentrations and time points, results were also plotted for the mid and low concentrations and the 15- and 5-minute time points. When looking at the data, there are very few statistically significant differences between the cancer cell lines themselves, not including the THP-1 cell line, as seen from the graphs in , and as measured by an ANOVA and multiple comparisons (Tukey-Kramer) in MATLAB. A significant difference between MDA and A549 cells was found in only three cases: in the mid concentration experiment with one-hour time point (*), and then again in the 15 minutes incubation group, at the mid and high concentrations (**). Interestingly, there is no significant difference between A549 and HeLa cells at any concentration or time point, indicating that there is a similar level of uptake in these cell types, highlighting a consistent mechanism of uptake and sensitivity to the particles. However, the MDA cells show significantly different uptake patterns to A549 cells and HeLa cells when looking at the 15 minutes incubation group and the high and mid concentrations. This could indicate that the MDA cells are internalizing NPs more quickly than the A549 and HeLa cells, supporting data that indicates the MDA cells might be more sensitive to these particles.
Neighboring cells have been seen to undergo different responses to NP treatments, and cell averaging has been suggested to mask subtle changes that occur in minority populations. To overcome this, the distribution of cell intensities was binned to highlight distinct differences in the uptake across times and concentrations (Supplementary Figure S5(C)). For each cell line, in each group there is evidence of a portion of cells that do not internalize any NPs (indicated by the visible bars at the far left of the figure at 0); however, as time and concentration increase there is a clear increase in cellular intensity and therefore internalization across all cell lines. Although increases in time and concentration both lead to an increase in the observed NP uptake intensity, analyses again indicate that time is a more significant contributor than concentration (Supplementary Figure S5(A,C)). MDA cells appear to show what looks like a more spread out distribution of uptake based on the binned data analysis, as a lot of treatment groups have cells that exhibit high intensities (to the right side of the histogram), compared to the A549 and HeLa cells, where mainly the high concentration and long exposure time groups exhibit high intensities.
Supplementary Figure S5(C) shows that the cells that experience the longest duration of incubation generally show largest proportions of higher intensity cells when compared to the incubations for shorter times at the higher concentrations. This could be confirming the importance of exposure time. This could potentially indicate a receptor-density limited nature of the uptake occurring. Likewise, exposure time is known to have an effect due to the increased sedimentation of particles over time, potentially leading to a higher effective dose of NPs at the cell surface. Dosimetry of NP cultures is becoming increasingly important to model and understand to enable determination of the dose received by different cell lines, and how these change over time. Although this is beyond the scope of the current article, a detailed analysis modeling the transport of NMs to the cell surface considering cell-specific receptor densities and types, would be very interesting for future work (DeLoid et al. Citation2015 and Hinderlinter et al. 2010).
The cells that experience higher NP exposure concentrations appear to have more cells internalize some NPs (i.e. broad peaks but at a lower intensity) and fewer cells with no NPs. This could indicate that although at higher concentrations a larger proportion of the total cells take up some NPs, at longer time points a greater proportion of the NPs are taken up, potentially due to receptor recycling and continued uptake, in addition to increased sedimentation of NPs through longer exposure periods (Supplementary Figure S5(C)).
Mechanism of uptake: membrane-bound or fluid phase?
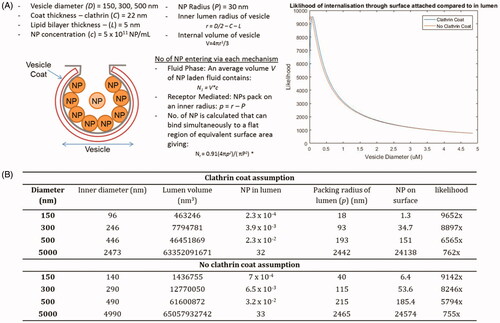
The NPs are known to interact with molecules at the cell surface, and can subsequently be internalized specifically through membrane interactions, via receptor-ligand mediated active processes or electrostatic interactions, or through nonspecific routes such as passive fluid encapsulation within vesicles during internalization processes. A series of calculations were performed to determine the potential for uptake through direct membrane interaction versus uptake due to passive incorporation into vesicles in the liquid phase (Smith et al. Citation2012).
The equations, shown in , can be used to quantitatively estimate the likelihood of NPs entering cells through each mechanism based upon the properties of the vesicles and the NPs themselves (e.g. size) (). The number of NPs/mL of medium can be calculated and substituted into the equations in , to calculate the likelihood of fluid-phase and membrane interaction occurring. In each case, the calculation for NP attachment at the surface is likely to be an over-estimation, partly due to neglecting the membrane surface curvature. The calculations are also based on the assumption that the entire membrane surface has the capacity to be coated in NPs. Despite this, the analyses indicate that NPs are likely to bind specifically to membranes or membrane proteins/receptors at the cell surface and be carried into the cell through direct attachment, rather than being taken up within the vesicular fluid, as evidenced in . However, as the vesicle size itself increases (such as phagosomes >5 µm) the chances of encapsulation increases 10-fold, as seen in .
Figure 3. Calculations to obtain the number of particles that can enter a cell through fluid-phase endocytosis compared to receptor mediated endocytosis. Figures and equations adapted from Smith et al. (Citation2012). (A) The equations can be substituted to determine the most likely means of NP cellular entry: fluid phase, or receptor mediated. The close circle packing density (where all NPs are touching and attached at the surface) is 0.91. The curvature of the membrane is neglected and therefore this will be a slight over estimation. This likelihood is determined computationally using MATLAB for every vesicle diameter between 150 nm and 5000 nm in increments of 1 nm (displayed graphically as ‘likelihood’). (B) The calculation of likelihood is given for 3 examples with and without clathrin coat, each of these gives an example of how ratio of likelihood of internalization through RME compares to that within the fluid phase (based on the extracellular starting concentrations).
Mechanism of SPION uptake into different cancer cell lines: A549, MDA, HeLa, and THP-1 derived macrophages
SiRNA targeted to proteins in common internalization pathways within cells were utilized to elucidate the main uptake pathway of SPIONs. SiRNA targeted toward AP2 was employed to inhibit the CME pathway, with Cav1 targeted to inhibit caveolae mediated endocytosis, and Pak1 to inhibit macropinocytosis. To determine the route of NP uptake, experiments were performed with control cargo known to enter cells through the specific routes (transferrin, cholera toxin and dextran) to determine that the knockdown system was working (Supplementary Figure S6(D)). Western blotting was performed alongside each experiment to ensure knockdown had occurred (Supplementary Figure S6(D)). Following siRNA inhibition, cells were treated with SPIONs and their uptake assessed relative to a non-silenced positive control (100%). Protein expression and knockdown levels were quantified from western blot experiments, normalized to the housekeeping gene tubulin (Tub) and expressed as a percentage of the non-silencing control (NSC) (). The mean inhibition of each pathway was >70% in each cell line and with each siRNA as determined from the expression levels of the knocked-down proteins. Cav1 expression in macrophages has been debated, and some macrophages, notably those derived from human monocytes (HMDMs), have been found to lack expression of cav1 (Gargalovic and Dory Citation2001; Gaus et al. Citation2004; Daigneault et al. Citation2010). Likewise, THP-1 derived macrophage have been found to resemble HMDMs when following the differentiation protocol employed in this work (Daigneault et al. Citation2010). No expression of Cav1 was detected in THP-1 derived macrophages, as seen from the Western blot (Supplementary Figure S6(D)). Therefore, no experiments were performed to assess the effects of cav1 inhibition on THP-1 cells.
Figure 4. Quantification of SPION uptake following siRNA experiments in cancer cell lines by average cell intensity. Quantification of the NP uptake (using MATLAB to determine average cellular intensity) indicating the inhibition of NP uptake when specific pathways are inhibited in different cell lines. The graph on the right shows quantification of average knockdown efficiency from Western blots. A minimum of 238 cells were analyzed per group, from experiments run on 3 or more different days. Mean + SEM is plotted).
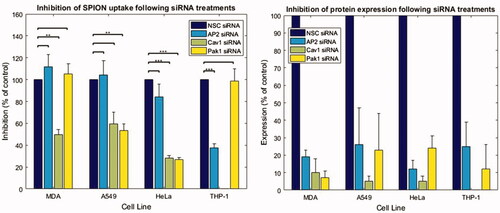
There are cell-type dependant effects on SPION internalization when AP2 is inhibited; the internalization does not decrease significantly in MDA, HeLa, and A549 cell lines (Supplementary Figure S7). THP-1 cells, however, appear to internalize NPs under all siRNA inhibition conditions except for AP2 inhibition, indicating a difference in the internalization mechanisms in these different types of cells. These results indicate that CME is involved in the internalization of Sienna+ SPIONs into THP-1 derived macrophages (Supplementary Figure S7). Intracellular SPION intensity dropped to 40% of that in NSC cells following AP2 inhibition () and is similar to the expression loss of AP2. By contrast, the inhibition of Pak1 protein expression was nearly 90% however the internalization of NPs remained roughly the same as in the NSC cells. A well-known cargo for the CME route is the transferrin receptor (TfR), along with its ligand, transferrin (Tf). Tf is known to bind to many different NPs and thus may offer a mechanism of entry for corona coated SPIONs in these cell types (Raynal et al. Citation2004; Arbab et al. Citation2005). Corona studies performed on the SPIONs used here identified the presence of Tf, indicating this as a potential mechanism of entry into the THP-1 cells through the CME pathway (Supplementary Figure S8); likewise the presence of Tf bound to CeO2 NPs has been shown to be involved in receptor mediated endocytosis via CME (Mazzolini et al. Citation2015).
The quantitative analysis of non-macrophage cells suggests the importance of caveolin mediated endocytosis in Sienna+ NP internalization (). In HeLa and MDA cells the inhibition of caveolin led to a significant decrease in the internalization of SPIONs (p < 0.05). In A549 cells there was a similar decrease, however, this was not significant (p = 0.08). There are limited identified cargo for caveolin mediated endocytosis, but other NPs/QDs of similar size (60 nm) have been found to preferentially accumulate in cells via caveolin mediated endocytosis (Zhang and Monteiro-Riviere Citation2009; Bohmer and Jordan Citation2015). Albumin was found to be present on the surface of the SPIONs used here (Supplementary Figure S8), consistent with studies of the corona composition of dextran coated SPIONs with neutral, or nearly neutral charge (Sakulkhu et al. Citation2015). Albumin binds to gp60 at the cell surface, which binds to Cav1 and forms vesicles, potentially providing a mechanism for internalization of SPIONs, although this is speculative (Miele et al. Citation2009).
The inhibition of macropinocytosis using siRNA directed toward Pak1, a kinase directly involved in macropinocytosis, led to a significant decrease in SPION internalization in HeLa and A549 cells. Interestingly the inhibition of Pak1 in MDA cells did not lead to a decrease in the detected reflectance intensity. However, following Pak1 siRNA treatment, MDA cells consistently appeared to exhibit vacuole formation, evident in the reflectance images (Supplementary Figure S7), such that the contribution of SPIONs to the reflectance signal could not be deduced. More experiments are necessary to determine the effect of Pak1 inhibition on SPION uptake in MDA cells and the reason for the formation of vacuoles.
The contribution of phagocytosis to SPION uptake was also assessed in PMA-differentiated THP-1 cells. Cytochalasin D was used to inhibit phagocytosis, validated by measuring the uptake of 1.1 µm fluorescent polystyrene beads (Supplementary Figure S9). Measurements of the mean intensity of cells indicated that when phagocytosis was inhibited in THP-1 macrophages, the uptake of SPIONs decreased. However, when only 20-30% of phagocytosis functionality remained, 50%-70% of SPIONs still entered the cells (Supplementary Figure S9), presumably, as SPIONs were able to enter through other means such as endocytosis, likely through a CME route as indicated in earlier siRNA inhibition experiments ().
Intracellular fate of SPIONs following uptake into different cancer cell lines: A549, MDA, HeLa, and THP-1 derived macrophages
Tagged proteins involved in endocytic trafficking (Rab5, Rab7, and Rab11) were expressed in HeLa cells to identify potential trafficking routes for SPIONs. SPIONs appear to colocalize with various compartments within the endosomal system over the course of 48 hours (2,880 minutes) (Supplementary Figure S10). Image randomization was also performed, and random object colocalization between SPIONs and randomized fluorescence images was measured, averaging at 7%. SPIONs appear to colocalize with various compartments within the endosomal system, particularly noticeable around the 360 minutes/6-hour point. A portion of the SPIONs appears to colocalize to Rab5 positive compartments ranging from around 10%, with this resembling random colocalization measured at 7%, at 30 minutes, up to 45% at 360 minutes (or 6 hours) (Supplementary Figure S10). Thereafter it begins to plateau at around 20-30%. Colocalization between Rab11 and SPIONs is also evident, starting around 10%, again resembling the value for random colocalization. Increased colocalization occurs by 360 minutes (6 hours) indicating that some of the SPIONs are destined to return to the plasma membrane following internalization, potentially highlighting transcytosis potential. Resovist has previously been reported to be extruded from the cell, visualized extracellularly on TEM images (Chung et al. Citation2015). If SPIONs are being recycled to the surface this could explain, in part, the continued level of association between Rab5 and SPIONs at 1440 min (24 hours) and 2880 min (48 hours) due to release and re-uptake. Colocalization of SPIONs with Rab7 positive compartments represents the accumulation of SPIONs within the more acidic Rab7 late endosome compartments, which is a prerequisite for the maturation and fusion with lysosomes, and subsequent degradation of SPIONs. Colocalization between SPIONs and Rab7 was observed here, ranging from 10-15% at 30 and 60 mins, increasing to 50% at 360 mins (6 hours) and remaining high until 1,440 mins (24 hours), before dropping back to around 30% at the later time points. Rab7 also marks lysosomal compartments. It is likely that during the 24 hour time course Rab7 compartments fuse with lysosomal compartments and therefore may be coupled to the beginning of SPION degradation in the acidic lysosomal environment, which has been reported to occur as early as 24 hours post incubation (Yang et al. Citation2011). Statistical testing was performed using an ANOVA to compare the differences between the different groups of data collected for the Rab5, Rab7 and Rab11 colocalisation studies. The resultant p-value of 7.5 x 10⁻⁸ indicated that significant differences were present within the data. Post-Hoc testing, using the multcompare function using the Tukey-Kramer method, indicated no statistical significance between most groups tested. There was however a significant difference between the colocalization observed with Rab7 at 60 mins compared to 360 min (6 hours) and 1440 min (24 hours), and Rab 5 at 30 min, and Rab5 at 360 min (6 hours).
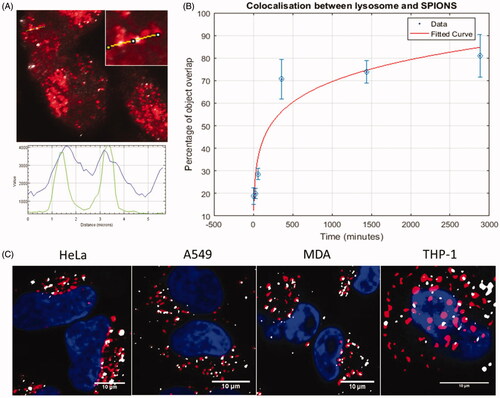
The colocalization of SPIONs with the lysosome compartment was visualized using Lysotracker Red DND-99 with the SPIONs visualized by reflectance (). Little colocalization was observed at the earliest time points, however, colocalization increased notably at 6 hrs, similar to the increase in colocalization observed between SPIONs and Rab7 (Supplementary Figure S10). This is not surprising as lysotracker can also mark late endosomes, due to its pH sensitivity. Likewise, Rab7 has been determined necessary for fusion (in conjunction with other proteins such as SNARES) of late endocytotic structures and the lysosome; Rab7 can therefore also act as a marker for lysosomal compartments (Bucci et al. Citation2000; Vanlandingham and Ceresa Citation2009). Lysosomal accumulation of SPIONs reaches a maximum of 81%, but the curve appears to plateau (), which could be indicative of lysosomal saturation or the onset of particle dissolution and degradation. These colocalization studies indicate that the lysosome is the predominant destination for SPIONs once internalized within macrophages. This was also confirmed in MDA, A549 and THP-1 cells at the 24-hour time point following SPION treatment (.
Figure 5. Colocalization of SPIONs with the lysosome. A high degree of colocalization can be visualized at longer incubation time points (24 hours and 48 hours especially). This can be seen from (A) the overlay (top left; SPIONs = gray, Lysosome = red) and the line intensity profile (lysosome = blue, SPION = green). These images can be computationally post processed and different parameters assessed (such as the degree of signal overlap) and used to make quantitative conclusions about particle tracking and fate, shown in (B). Plotted points show the mean result for each time point, error bars show the standard error of the mean (SEM). Example images showing the colocalization between the lysosomes and the SPIONs at 24 hours, in the four cell lines tested are displayed in (C).
Super-resolution imaging of lysosomal colocalization
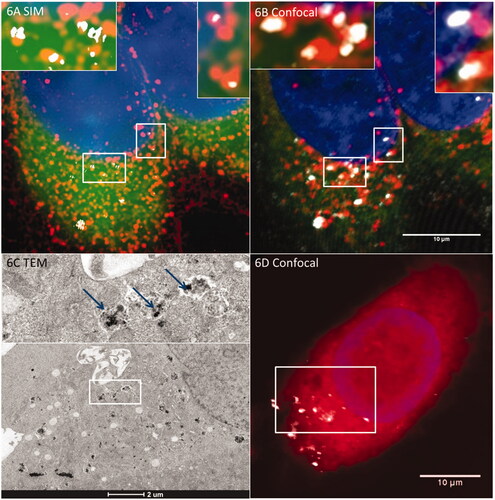
Super-resolution microscopy can offer added benefit when performing colocalization studies. shows the lysosomal colocalization of Sienna+ imaged with RCM and R-SIM in conjunction with fluorescent labelling of the lysosomes. The resolution increase is clearly demonstrated in compared to . This supports the above findings that a large proportion of the NPs do indeed colocalize with the lysosome following cellular internalization in as little as one hour. Techniques such as R-SIM have been shown to reduce the colocalization uncertainty found in light microscopy studies; however the disadvantages of R-SIM include the high level of background signal which leads to a decrease in NP detection when compared to confocal (Guggenheim et al. Citation2016; Guggenheim et al. Citation2017). Combination of techniques in so called correlative methodologies can provide increased certainty to the observations made from confocal and SIM investigations, as shown previously for SPIONs and cerium dioxide NPs (Guggenheim et al. Citation2016). shows a TEM micrograph of Sienna+ NPs following uptake into HeLa cells that had previously been imaged using light microscopy. The intracellular NPs from the lower portion of the cell are evident (as indicated by the white box on (although it should be stated that this confocal image is itself a Z-projection), as is the membrane that encapsulates the NPs, confirming that the NPs are internalized through the endo-lysosomal system.
Figure 6. R-SIM provides increased resolution for colocalization studies of metallic (e.g. SPION) NPs. When combined with TEM this can indicate definitive localization. NPs with lysosomes in HeLa cells after an hour-long incubation. (A) Cells imaged with R-SIM, (B) Confocal of SPIONs indicates colocalization with the lysosome, emphasizing the substantial resolution improvement of R-SIM and confirming the findings that a large proportion of NPs colocalize to lysosomal compartments. TEM can also be included in the workflow as described in detail in Guggenheim et al. (Citation2017); an example of a TEM image showing the membrane-bound structures containing SPIONs is indicated in (C) which corresponds to the cell shown in (D).
Dissolution of NPs in lysosomal mimic fluid
Dissolution studies were performed in H2O at pH 7 or pH 4. The DLS, pH and Zeta potential were taken at 24-hour intervals following initial incubation of the SPIONs (Supplementary Figure S11). Some changes were observed in the SPION preparations (7000 ppm/7 µg/mL) over the period of 144 hours when incubated at pH4 and 37 °C in H2O, however, there was no indication that dissolution was occurring and DLS indicated that size was increasing. The carboxydextran coating is linked to the NP surface via multiple hydrogen bonds. At low pH, the carboxyl groups become protonated (Di Marco et al. Citation2007). The oxygen becomes electro-negatively charged, and the hydrogen electro-positively charged due to the electron withdrawing effect of oxygen. Therefore, electrostatic interactions between neighboring molecules could lead to agglomeration of NPs under this condition, which would explain the observed increase in diameter of the NPs. This data indicates that low pH alone is insufficient to induce the dissolution of the SPIONs, which is in agreement with previous studies (Arbab et al. Citation2005).
Dissolution measurements were also performed in an artificial lysosomal fluid (ALF) (Stebounova, Guio and Grassian Citation2011). It had been theorized that after 96 hours SPIONs would have dissolved completely within lysosomal fluid (Arbab et al. Citation2005). The DLS, pH, Zeta potential and PDI were taken at 24-hour intervals following initial incubation (). Correlating samples were also analyzed at each time point to measure the reflectance intensity using RCM (.
Figure 7. Dissolution of SPIONs in citrate containing ALF over a 96-hour time course. (A) A decrease in reflectance intensity is seen over time with RCM. A decrease in the diameter (nm) (B) and zeta potential (C) is also observed, and this is paralleled by an increased release of iron ions measured by ICP-OES (D) and an increase in the PDI (E) of the solution. Little change is observed in the pH of the solution (F).
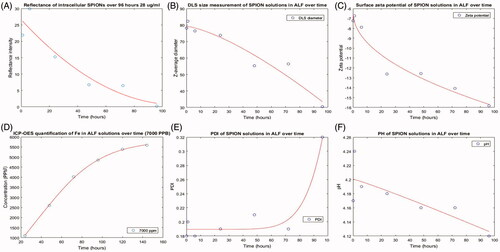
Reflectance intensity was measured through automatic background subtraction and manual delineation due to the high confluence of cells at these longer time points. A decrease in reflectance intensity was observed during the 96 hours in A459 cells () but this may be due to NP distribution to daughter cells during mitosis (Mazzolini et al. Citation2015). During the dissolution study in ALF, decreases in the observed diameter were observed from T = 0 (78.1 ± 3.3 nm) to T = 96 (30.5 ± 4.4 nm) indicating dissolution of the NPs in ALF (. The zeta potential also became more negative, from T = 0 (−7.24 mV ± 0.39 mV) to T = 96 (−15.83 mV ± 0.32 mV) indicating an increase in negative charge at the slipping plane of the NPs (. The change in zeta potential is particularly evident at T = 24h which could indicate a reduction in steric stabilization of the solution coinciding with breakdown of the carboxydextran coating. There was also an evident increase in PDI from T = 0 (0.18 ± 0.0036) to T = 96 (0.32 ± 0.1) which indicates an increase in size distribution and is also suggestive of the loss of the sterically stabilizing coating (. Taken together, the initial studies to assess dissolution indicate that SPIONs may be dissolving in the ALF solution. To confirm these findings, SPIONs incubated in ALF were also monitored for dissolved iron over the time course of 144 hours (7 days) using ICP-OES. On each day, starting 24 hours post initial measurement, samples were prepared as described for elemental ICP-OES analysis to separate the dissolved ions from the NP fraction. A time dependant increase in the amount of Fe ions present in solution was observed at each concentration of SPIONs incubated in ALF () (Motley et al. Citation2003; Stebounova, Guio, and Grassian Citation2011). However full dissolution did not appear to occur as the curve did not plateau as would be expected at full dissolution. This supports the conclusion that SPIONs are indeed partially dissolving in the low pH ALF solution. An important consideration is the toxic effects of the intermediates formed during this dissolution process; not only the resultant free Fe that is released. It is likely that there is a complex interplay between the dissolution products and biological responses.
Discussion
Many of the traditional biomedical applications of SPIONs rely on the selective cellular uptake of the SPIONS by macrophage cells. However, over recent years it has become more and more apparent that NP uptake occurs across a wide range of cell types, including non-phagocytotic cells. Cellular outcomes following exposure to NPs are dependent upon a variety of factors, including NP environment, NP primary particle properties, NP evolving properties and the cell lines they encounter. Different cells have evolved to carry out different functions, and as such have varied cell surface properties which may affect the uptake potential of NPs such as SPIONs. The uptake kinetics of various SPIONs (DMSA-coated, PEGylated, pullulan coated, Dextran coated) have previously been studied in a variety of cell lines (MCF-7, MDCK, NIH-3 T3, CHO-K1, Brain Capillary Endothelial Cells (BCEC), human Blood Outgrowth Endothelial Cells (hBOEC)), measured through a host of techniques including magnetization measurements, Prussian blue staining, AFM, TEM and fluorescence imaging (Soenen et al. 2010; Thomsen et al. Citation2013; Calero et al. Citation2015; Hanot et al. Citation2015; Silva et al. Citation2016). However, previous studies did not made use of label-free imaging, instead utilizing fluorescent imaging (Soenen et al. 2010; Thomsen et al. Citation2013; Calero et al. Citation2015; Silva et al. Citation2016). NP labeling encompasses a host of potential problems, including loss of label following uptake, difficulty in label attachment, modification of NP surface properties in addition to phototoxicity and photobleaching effects in cells. Reflectance imaging, as used here, provides an obvious alternative that negates the need for labeling of NPs that are optically dense (Guggenheim et al. Citation2016).
Label-free RCM of SPIONs, applied in conjunction with fluorescence labeling of cell structures allowed the visualization and automated quantification of intracellular Sienna+ SPION uptake under a variety of conditions. Automation vastly increases the sample size that can be studied, in addition to increasing result consistency and confidence. Initial studies indicated the efficient internalization of SPIONs across all cell lines, at all time points and concentrations tested. The time and concentration dependence of uptake was established in multiple cancer cell types, benchmarked against the widely studied macrophage model, indicating distinct uptake behavior and patterns. This is in accordance with other results investigating the time and concentration dependence of uptake for a variety of NPs (e.g. polystyrene and gold) and cell lines (Johnston et al. Citation2010; Trono et al. Citation2011; Smith et al. Citation2012; Mazzolini et al. Citation2015).
Longer exposure times were found to exhibit a greater effect on NP uptake compared to higher concentrations for shorter exposure times. This could be broadly related to the dosimetry and particle transport properties in the suspension media – particles can sediment over time, which could lead to higher effective doses at the cell surface. Understanding the interactions between NMs and the surrounding environment in terms of transport is of emerging importance in this type of study, and thus provides a new avenue for investigation in future work to understand and model this process (Guggenheim et al. Citation2018). Whilst we monitored the NP suspension properties for the duration of the study, and saw no significant change in the hydrodynamic size, we cannot rule out that particles are sedimenting over time, leading to a higher effective concentration at the cell surface at longer exposure times.
The uptake patterns of HeLa, A549, MDA, and THP-1 cells were compared to see if differences were observed between different cell types. The uptake of SPIONs into THP-1 cells was significantly different from the uptake in any other cancer cell under a variety of conditions, including all high concentration experiments and all 1 hour exposure times, indicating that the THP-1 cells do indeed internalize a larger amount of SPIONs compared to other cell types. There is little difference in the uptake of SPIONs in A549 and HeLa cells, with no significant difference seen between these cell lines at any time point or concentration, indicating a similar response to the dosage of SPIONs by these cell types. Analyses of the uptake of SPIONs in MDA cells across time and concentration groups indicated a potential increase in sensitivity of the MDA cells to SPIONS, as significant differences were seen across different treatment groups of MDA cells (Supplementary Figure 5 and . Likewise, some differences were highlighted between the uptake seen in MDA cells and the uptake seen in A549 cells, however, these occurred only at the mid-time points and concentrations, supporting earlier data that indicates the MDA cells might be more sensitive to these particles ( and S5).
The increase in uptake over time could also be indicative that a receptor-mediated interaction is primarily responsible for the uptake of Sienna+ SPIONs. This could indicate that uptake may be limited by the number and availability of receptors at the cell surface and thus that receptors must be freed before uptake can continue. To investigate this idea, the likelihood of the NPs entering through fluid-phase or through direct membrane interaction was theoretically calculated. The results also suggested, based on the uptake amount in THP-1 macrophages compared to cancer cells, that different mechanisms may be responsible for the uptake in different cell lines.
The NPs can be efficiently internalized by a variety of cell types through a combination of uptake routes, including, but not limited to, clathrin-mediated endocytosis (CME), caveolar endocytosis, macropinocytosis and, in specialized cells, phagocytosis (Ivanov Citation2008; Sahay, Alakhova, and Kabanov Citation2010; Gu et al. Citation2011; Zhao et al. Citation2011; Kafshgari, Harding, and Voelcker Citation2015). In macrophage cells multiple endocytotic mechanisms have previously been found responsible for the internalization of SPIONs, including CME, caveolae dependent mechanisms, macropinocytosis and phagocytosis (Raynal et al. Citation2004; Xu et al. Citation2010; Gu et al. Citation2011; Lunov et al. Citation2011; Schlorf et al. Citation2010; Yang et al. Citation2011). The internalization of SPIONs into macrophage models has been widely studied compared to non-macrophage cell types. Fewer studies have focused on non-phagocytosing cells, and those that do have experimental flaws or artifacts. For example, SPIONs were combined with uptake enhancing agents, such as transfection medium or modified with peptides (Daldrup-Link et al. Citation2003; Matuszewski et al. Citation2005). To investigate this further, the mechanism of SPION uptake by each cell line was assessed.
In this work, several pathways were implicated in the uptake of SPIONs. The uptake was determined to be a result of internalization through membrane interactions and several key proteins were identified that may be instrumental in facilitating the internalization of these NPs, particularly Cav1 and Pak1 in cancer cell lines. Conversely, in macrophage cells, AP2 and the CME pathway appeared to play a larger role in the internalization efficiency, along with the classical mechanism of phagocytosis, specific to macrophage cell types. It is possible, or even likely, that there is a complex interplay of pathways and compensation occurring within the cell types, particularly under siRNA inhibition conditions. Considering the variety of surface coatings and surface properties that are possible for different NPs, and how the cellular surface constituents modulate the NP surface and therefore nano-cell interactions, it is likely that changing the identity of surface adhered biomolecules (the biocorona) will cause different mechanisms to play a role in the NP internalization. Investigation into the NP associated biocorona was also performed here to determine potential key proteins that may be involved in the uptake kinetics of the SPIONs into the cancer cell lines tested here. Transferrin and albumin were both detected as bound to the SPIONS (Supplementary Figure S8), providing additional support for the uptake routes proposed.
Many drug delivery strategies require NPs to reach, or remain at, particular sites within the cell, and therefore understanding of the trafficking and biotransformation of NPs is important in ensuring success and safety, in addition to ascertaining potential for inadvertent toxicity. Various types of SPIONs have been found to localize to endo-lysosomal compartments in vitro and previous studies, in vitro and in vivo, indicate that the main fate of SPIONs is degradation within the lysosome (Lunov et al. Citation2010b; Levy et al. Citation2011). Most of these studies have been performed in macrophage models using fluorescently tagged NPs (Soenen et al. Citation2010a; Levy et al. Citation2011). However, it is particularly important to examine cellular interactions of the unmodified Sienna+ SPIONs (i.e. without fluorescent tags) to avoid modifying the surface chemistry and thus potentially affecting the cellular outcome. In some of the previous studies colocalization was determined using fluorescence, TEM and EDX, none of which can provide absolute certainty of the localization of unlabeled SPIONs to a particular compartment such as the lysosome (Lunov et al. Citation2010b; Levy et al. Citation2011). The data presented here (Supplementary Figure S10) suggests that SPIONs are trafficked through the endosomal transport system to the lysosome, utilizing Rab5 and Rab7 positive compartments, with a fraction (increasing at later timepoints) being released extracellularly through Rab11 mediated recycling at each time point upward of 6 hours. Evidence of SPION colocalization with the lysosome also increased significantly beyond 24 hours in all the cell types tested. SPIONs were thus found to follow a classical pathway that result in the lysosomal accumulation and subsequent degradation into free iron. The relationship between intracellular NP location and the endo-lysosomal system/lysosomes was identified using colocalization studies with the labeled lysosomal compartment.
One of the drawbacks of conventional diffraction-limited microscopy, such as confocal, is the resolution limit (Verdat Citation1869; Abbe Citation1873; Rayleigh Citation1903). Therefore, two detected signals that appear to co-localize may actually be, theoretically, up to 200–250 nm apart, and practically even further (Cox and Sheppard Citation2004). Reflectance SIM (R-SIM) offers a substantial resolution increase compared to confocal microscopy with no additional sample preparation (Chang et al. Citation2011; Guggenheim et al. Citation2016; Guggenheim et al. Citation2017). This can improve the likelihood of observing true colocalization between two detected signals. The use of R-SIM increased confidence in the conclusions that the NP are localizing to within lysosomes following intracellular trafficking; the further inclusion of TEM imaging indicated that intracellular NPs were localized within membrane bound structures. Taken together, this indicates that SPIONs are taken up in a receptor mediated fashion through cell surface interactions, internalized and transported through the endolysosomal system with the ultimate fate of lysosomal degradation in all cell lines tested. This localization could be advantageous for therapeutic strategies, such as those that employ a pH modulated cleavage of drug bound cargo within the endo-lysosomal system (Zhang et al. Citation2013).
Once trafficked into the lysosome, the presence of chelates with a high affinity for Fe3+ and an acidic environment could cause SPIONs to dissolve in as little as 96 hours (Arbab et al. Citation2005), although complete dissolution of the SIENNA+ SPIONs was not observed over this timescale in the ALF dissolution studies presented here. Dissolution would lead to the release of iron ions within the lysosome and cytoplasm; the deleterious effects of free iron release and overload are well known (Arbab et al. Citation2005; Yang et al. Citation2015). Indeed Arbab et al. saw evidence for dissolution of PLL-SPIONs over 96 hours, but they also observed some undissolved SPIONs within membrane bound organelles of treated cells (Arbab et al. Citation2005). Dextran functionalization is one of the most favored routes for stabilization of SPIONs, and the Sienna+ SPIONs are coated in carboxydextran, however it is suggested that the dextran coat is not firmly attached at the SPIONs surface, therefore they may not remain stable within the acidic lysosome. The iron core and it's coatings are thought to be degraded by the acidic environment leading to the release of free iron into the cytoplasm (Lunov et al. Citation2010a). Interestingly, the data for SIENNA + presented here shows that pH alone was not sufficient to induce dissolution, but that in the citrate containing ALF fluid, which mimics lysosomal fluid, the SPIONs did undergo partial dissolution.
Together, the results of this study indicate that SPIONs are efficiently internalized into all cell lines tested, regardless of whether they are cancer cells or macrophages. This contradicts the idea that SPIONs are selectively taken up by macrophages, and not by cancer cells, which forms the basis of some therapeutic uses of these SPIONs, particularly for MRI imaging. It is clear that macrophages internalize significantly more SPIONs then cancer cells, and this enhanced uptake is likely to occur through different mechanisms, highlighting a potential difference that could be targeting for therapeutic intervention where NP uptake is desired in specific cell populations. This also offers promise for the use of SPIONs as drug delivery vehicles. This, combined with their ability to be magnetically targeted to specific locations in the body could offer a very attractive cancer therapy strategy. However, it is worth noting that the studies performed here are carried out on 2 D cell cultures. Future studies should make use of new cell culture methods that can recreate 3 D cellular environments, to identify the translocation and penetration of SPIONs into 3 D cellular structures. Modeling of this process could also be performed to understand how this might impact SPION uptake in solid tumors of different sizes.
Conclusions
Metal oxide NPs, such as SPIONs, have applications from the inexpensive in vivo detection and screening of diseases such as cancer to the remediation of polluted soils (Sokolov et al. Citation2004; Santra et al. Citation2009; Shipley, Engates, and Guettner Citation2011; Li et al. Citation2013; Wang and Cuschieri Citation2013; Dave and Chopda Citation2014). Some magnetite NPs have been identified in the human brain as a result of particulate pollution resulting from combustion (Maher et al. Citation2016). As with all NPs, SPIONs encompass a huge range of preparation types, each with different properties that can lead to a variety of effects within cellular systems and exposed organisms. Therefore, the characterization of formulation physical chemical properties, uptake into target and non-target cells, localization and trafficking are of utmost importance to try and prevent unwanted toxicities in addition to successful application. Here, methods based around the detection of unlabeled NPs, exploiting the inherent reflectance from SPIONs, provide information regarding the unlabelled particle uptake into a variety of cell lines.
SPIONs are efficiently internalized into A549, MDA, HeLa and THP-1 derived macrophages through receptor mediated endocytosis, trafficked through the endo-lysosomal system to the degradative lysosome. Here, it appears SPIONs begin to degrade in the acidic lysosomal environment. It is critical to understand more regarding the uptake, localization, trafficking and fate of SPIONs in order to safely apply them within biomedicine and allow them to reach their full potential as therapeutic or diagnostic agents without unwanted or unexpected consequences. The present work makes important strides in this direction, indicating that while the behavior in non-phagocytotic cell lines is broadly similar to that in the specialist macrophage cells, some differences in the mechanisms of internalization exist, that could potentially be exploited to reduce off-target effects.
RCM offers tremendous benefit for NP investigations as it is quick, inexpensive and label-free, resulting in high-quality images that can be subsequently analyzed computationally as demonstrated in this work and previously (Mazzolini et al. Citation2015; Guggenheim et al. Citation2016, Citation2017). Combining this work with automated analysis methods provides a powerful workflow for obtaining quantitative information regarding NP uptake and localization in a non-biased manner. Continuation of this type of investigation will ultimately lead to more accurate predictions regarding the behavior of NPs within cells and tissues, with the goal of improving the likelihood of success in subsequent translation to clinical trials. Despite increasing research into NP based therapies, few of these realize their full potential within a clinical setting (Alexis et al. Citation2010; Duncan and Gaspar Citation2011; Venditto and Szoka Citation2013). RCM may be influential in reducing the number of formulations that are progressed to in vivo studies with limited chance of success in future clinical trials. Refinement of the experimental procedures utilized in 2 D cell cultures, such as siRNA inhibition or localization studies, to allow the application in 3 D culture models, could also prove indispensable in the future.
Author contributions
EJG designed and performed the experiments, interpreted the data and drafted the manuscript, IL and JZR designed the experiments, interpreted the data and edited the manuscript.
TNAN-2019-OR-0112-File003.docx
Download MS Word (19.7 MB)Disclosure statement
No potential conflict of interest was reported by the authors.
Data availability statement
All relevant data are included in the manuscript; however, data are available on request (achieved via BEAR services at the University of Birmingham).
Additional information
Funding
Related Research Data
References
- Abbe, E. 1873. “Beiträge Zur Theorie Des Mikroskops Und Der Mikroskopischen Wahrnehmung.” Archiv Für Mikroskopische Anatomie 9 (1): 413–418. doi:10.1007/BF02956173.
- Aderem, A., and D. M. Underhill. 1999. “Mechanisms of Phagocytosis in Macrophages.” Annual Review of Immunology 17 (1): 593–623. doi:10.1146/annurev.immunol.17.1.593.
- Alexis, F., E. M. Pridgen, R Langer, and O. C. Farokhza. 2010. “Nanoparticle Technologies for Cancer Therapy.” Handbook of Experimental Pharmacology 2010 (197): 55–86. doi:10.1007/978-3-642-00477-3_2.
- Arbab, A. S., L. B. Wilson, P. Ashari, E. K. Jordan, B. K. Lewis, and J. A. Frank. 2005. “A Model of Lysosomal Metabolism of Dextran Coated Superparamagnetic Iron Oxide (SPIO) Nanoparticles: implications for Cellular Magnetic Resonance Imaging. NMR in Biomedicine 18 (6): 383–389. doi:10.1002/nbm.970.
- Bahrami, B., M. Hojjat-Farsangi, H. Mohammadi, E. Anvari, G. Ghalamfarsa, M. Yousefi, F. Jadidi-Niaragh, et al. 2017. “Nanoparticles and Targeted Drug Delivery in Cancer Therapy.” Immunology Letters 190: 64–83. doi:10.1016/j.imlet.2017.07.015.
- Bartczak, D., M.-O. Baradez, H. Goenaga-Infante, and D. Marshall. 2015. “Label-Free Monitoring of the Nanoparticle Surface Modification Effects on Cellular Uptake, Trafficking and Toxicity.” Toxicology Research 4 (1): 169–176. doi:10.1039/C4TX00105B.
- Bean, C. P., and J. D. Livingston. 1959. “Superparamagnetism.” Journal of Applied Physics 30 (4): S120–S129. doi:10.1063/1.2185850.
- Bohmer, N., and A. Jordan. 2015. “Caveolin-1 and CDC42 Mediated Endocytosis of Silica-Coated Iron Oxide Nanoparticles in HeLa Cells.” Beilstein Journal of Nanotechnology 6 (1): 167–176. doi:10.3762/bjnano.6.16.
- Bolte, S., and F. P. Cordelieres. 2006. “A Guided Tour into Subcellular Colocalisation Analysis in Light Microscopy.” Journal of Microscopy 224 (3): 213–232. doi:10.1111/j.1365-2818.2006.01706.x.
- Böse, K., M. Koch, C. Cavelius, A. K. Kiemer, and A. Kraegeloh. 2014. “A Correlative Analysis of Gold Nanoparticles Internalized by A549 Cells.” Particle & Particle Systems Characterization 31 (4): 439–448. doi:10.1002/ppsc.201300308.
- Bucci, C., R. G. Parton, I. H. Mather, H. Stunnenberg, K. Simons, B. Hoflack, and M. Zerial. 1992. “The Small GTPase rab5 Functions as a Regulatory Factor in the Early Endocytic Pathway.” Cell 70 (5): 715–728. doi:10.1016/0092-8674(92)90306-W.
- Bucci, C., P. Thomsen, P. Nicoziani, J. McCarthy, and B. van Deurs. 2000. “Rab7: A Key to Lysosome Biogenesis.” Molecular Biology of the Cell 11 (2): 467–480. doi:10.1091/mbc.11.2.467.
- Bulte, J. W. M., and D. L. Kraitchman. 2004. “Iron Oxide MR Contrast Agents for Molecular and Cellular Imaging.” NMR in Biomedicine 17 (7): 484–499. doi:10.1002/nbm.924.
- Byrne, J. D., T. Betancourt, and L. Brannon-Peppas. 2008. “Active Targeting Schemes for Nanoparticle Systems in Cancer Therapeutics.” Advanced Drug Delivery Reviews 60 (15): 1615–1626. doi:10.1016/j.addr.2008.08.005.
- Calero, M., M. Chiappi, A. Lazaro-Carrillo, M. J. Rodríguez, F. J. Chichón, K. Crosbie-Staunton, A. Prina-Mello, et al. 2015. “Characterization of Interaction of Magnetic Nanoparticles with Breast Cancer Cells.” Journal of Nanobiotechnology 13 (1): 16. doi:10.1186/s12951-015-0073-9.
- Chang, B.-J., S. H. Lin, L. J. Chou, and S. Y. Chiang. 2011. “Subdiffraction Scattered Light Imaging of Gold Nanoparticles Using Structured Illumination.” Optics Letters 36 (24): 4773–4775. doi:10.1364/OL.36.004773.
- Choi, S. H., W. K. Moon, J. H. Hong, K. R. Son, N. Cho, B. J. Kwon, J. J. Lee, et al. 2007. “Lymph Node Metastasis: Ultrasmall Superparamagnetic Iron Oxide-Enhanced MR Imaging versus PET/CT in a Rabbit Model.” Radiology 242 (1): 137–143. doi:10.1148/radiol.2421060093.
- Chung, T.-H., J.-K. Hsiao, M. Yao, S.-C. Hsu, H.-M. Liu, and D.-M. Huang. 2015. “Ferucarbotran, a Carboxydextran-Coated Superparamagnetic Iron Oxide Nanoparticle, Induces Endosomal Recycling, Contributing to Cellular and Exosomal EGFR Overexpression for Cancer Therapy.” RSC Advances 5 (109): 89932–89939. doi:10.1039/C5RA18810E.
- Cox, G., and C. J. R. Sheppard. 2004. “Practical Limits of Resolution in Confocal and Non-Linear Microscopy.” Microscopy Research and Technique 63 (1): 18–22. doi:10.1002/jemt.10423.
- Daigneault, M., J. A. Preston, H. M. Marriott, M. K. B. Whyte, and D. H. Dockrell. 2010. “The Identification of Markers of Macrophage Differentiation in PMA-Stimulated THP-1 Cells and Monocyte-Derived Macrophages.” PloS One 5 (1): e8668. doi:10.1371/journal.pone.0008668.
- Daldrup-Link, H. E., M. Rudelius, R. A. J. Oostendorp, M. Settles, G. Piontek, S. Metz, H. Rosenbrock, et al. 2003. “Targeting of Hematopoietic Progenitor Cells with MR Contrast Agents.” Radiology 228 (3): 760–767. doi:10.1148/radiol.2283020322.
- Dave, P. N., and L. V. Chopda. 2014. “Application of Iron Oxide Nanomaterials for the Removal of Heavy Metals.” Journal of Nanotechnology 2014: 1–14. doi:10.1155/2014/398569.
- DeLoid, G. M., J. M. Cohen, G. Pyrgiotakis, S. V. Pirela, A. Pal, J. Liu, J. Srebric, and P. Demokritou. 2015. “Advanced Computational Modeling for In Vitro Nanomaterial Dosimetry.” Particle and Fibre Toxicology 12. doi:10.1186/s12989-015-0109-1.
- Di Marco, M., et al. 2007. “Physicochemical Characterization of Ultrasmall Superparamagnetic Iron Oxide Particles (USPIO) for Biomedical Application as MRI Contrast Agents.” International Journal of Nanomedicine 2 (4): 609–622. doi: citeulike-article-id:2348535.
- dos Santos, T., J. Varela, I. Lynch, A. Salvati, and K. A. Dawson. 2011a. “Effects of Transport Inhibitors on the Cellular Uptake of Carboxylated Polystyrene Nanoparticles in Different Cell Lines.” PLoS ONE 6 (9): e24438. doi:10.1371/journal.pone.0024438.
- dos Santos, T., J. Varela, I. Lynch, A. Salvati, and K. A. Dawson. 2011b. “Quantitative Assessment of the Comparative Nanoparticle-Uptake Efficiency of a Range of Cell Lines.” Small 7 (23): 3341–3349. doi:10.1002/smll.201101076.
- Duncan, R., and R. Gaspar. 2011. “Nanomedicine(s) under the Microscope.” Molecular Pharmaceutics 8 (6): 2101–2141. doi:10.1021/mp200394t.
- Elkin, S. R., A. M. Lakoduk, and S. L. Schmid. 2016. “Endocytic Pathways and Endosomal Trafficking: A Primer.” Wiener Medizinische Wochenschrift 166 (7–8): 196–204. doi:10.1007/s10354-016-0432-7.
- European Medicines Agency. 2008. Withdrawal Assessment Report for SINEREM. https://www.ema.europa.eu/en/documents/withdrawal-report/withdrawal-assessment-report-sinerem_en.pdf
- Feng, Y., B. Press, and A. Wandinger-Ness. 1995. “Rab 7: An Important Regulator of Late Endocytic Membrane Traffic.” The Journal of Cell Biology 131 (6): 1435–1452. doi:10.1083/jcb.131.6.1435.
- Fortuin, A. S., R. Brüggemann, J. van der Linden, I. Panfilov, B. Israël, T. W. J. Scheenen, and J. O. Barentsz. 2017. “Ultra-Small Superparamagnetic Iron Oxides for Metastatic Lymph Node Detection: Back on the Block.” Wiley Interdisciplinary Reviews: Nanomedicine and Nanobiotechnology 10 (1): e1471. doi:10.1002/wnan.1471.
- Freeman, M. W., A. Arrott, and J. H. L. Watson. 1960. “Magnetism in Medicine.” Journal of Applied Physics. 31 (5): S404. doi:10.1063/1.1984765.
- Fuchigami, T., R. Kawamura, Y. Kitamoto, M. Nakagawa, and Y. Namiki. 2012. “A Magnetically Guided anti-Cancer Drug Delivery System Using Porous FePt Capsules.” Biomaterials 33 (5): 1682–1687. doi:10.1016/j.biomaterials.2011.11.016.
- Gao, X., Y. Cui, R. M. Levenson, L. W. K. Chung, and S. Nie. 2004. “In Vivo Cancer Targeting and Imaging with Semiconductor Quantum Dots.” Nature Biotechnology 22: 969–976. doi:10.1038/nbt994.
- Gargalovic, P., and L. Dory. 2001. “Caveolin-1 and Caveolin-2 Expression in Mouse Macrophages: High Density Lipoprotein 3-Stimulated Secretion and a Lack of Significant Subcellular co-Localization.” Journal of Biological Chemistry 276 (28): 26164–26170. doi:10.1074/jbc.M011291200.
- Gaus, K., L. Kritharides, G. Schmitz, A. Boettcher, W. Drobnik, T. Langmann, C. M. Quinn, et al. 2004. “Apolipoprotein A-1 Interaction with Plasma Membrane Lipid Rafts Controls Cholesterol Export from Macrophages.” The FASEB Journal 18 (3): 574–576. doi:10.1016/S1567-5688(03)90298-4.
- Goodwin, S., C. Peterson, C. Hoh, and C. Bittner. 1999. “Targeting and Retention of Magnetic Targeted Carriers (MTCs) Enhancing Intra-Arterial Chemotherapy.” Journal of Magnetism and Magnetic Materials 194 (1–3): 132–139. doi:10.1016/S0304-8853(98)00584-8.
- Gu, J., H. Xu, Y. Han, W. Dai, W. Hao, C. Wang, N. Gu, et al. 2011. “The Internalization Pathway, Metabolic Fate and Biological Effect of Superparamagnetic Iron Oxide Nanoparticles in the Macrophage-like RAW264.7 Cell.” Science China Life Sciences 54 (9): 793–805. doi:10.1007/s11427-011-4215-5.
- Guggenheim, E. J., A. Khan, J. Pike, L. Chang, I. Lynch, and J. Z. Rappoport. 2016. “Comparison of Confocal and Super-Resolution Reflectance Imaging of Metal Oxide Nanoparticles.” PLOS One 11 (10): e0159980. doi:10.1371/journal.pone.0159980.
- Guggenheim, E. J., I. Lynch, and J. Z. Rappoport. 2017. “Imaging in Focus: Reflected Light Imaging: Techniques and Applications.” The International Journal of Biochemistry & Cell Biology 83: 65–70. doi:10.1016/j.biocel.2016.12.008.
- Guggenheim, E. J., S. Milani, P. J. F. Röttgermann, M. Dusinska, C. Saout, A. Salvati, J. O. Rädler, I. Lynch. 2018. “Refining In Vitro Models for Nanomaterial Exposure to Cells and Tissues.” NanoImpact 10: 121–142. doi:10.1016/j.impact.2018.02.008.
- Handy, R. D., R. Owen, and E. Valsami-Jones. 2008. “The Ecotoxicology of Nanoparticles and Nanomaterials: current Status, Knowledge Gaps, Challenges, and Future Needs.” Ecotoxicology 17 (5): 315–325. doi:10.1007/s10646-008-0206-0.
- Hanot, C., Y. Choi, T. Anani, D. Soundarrajan, and A. David. 2015. “Effects of Iron-Oxide Nanoparticle Surface Chemistry on Uptake Kinetics and Cytotoxicity in CHO-K1 Cells.” International Journal of Molecular Sciences 17 (1): 54. doi:10.3390/ijms17010054.
- Hansen, S. F., E. S. Michelson, A. Kamper, P. Borling, F. Stuer-Lauridsen, and A. Baun. 2008. “Categorization Framework to Aid Exposure Assessment of Nanomaterials in Consumer Products.” Ecotoxicology 17 (5): 438–447. doi:10.1007/s10646-008-0210-4.
- Harisinghani, M. G., J. Barentsz, P. F. Hahn, W. M. Deserno, S. Tabatabaei, C. H. van de Kaa, J. de la Rosette, et al. 2003. “Noninvasive Detection of Clinically Occult Lymph-Node Metastases in Prostate Cancer.” New England Journal of Medicine 348 (25): 2491–2499. doi:10.1056/NEJMoa022749.
- Hofmann-Amtenbrink, M., et al. 2009. “Superparamagnetic Nanoparticles for Biomedical Applications.” Journal of Magnetism and Magnetic Materials 293 (1): 483–496. doi:10.1016/j.jmmm.2005.01.064..
- Ivanov A. I. 2008. Exocitosis and Endocytosis. Methods in Molecular Biology. Clifton, N.J: Humana Press.
- Iyer, A. K., G. Khaled, J. Fang, and H. Maeda. 2006. “Exploiting the Enhanced Permeability and Retention Effect for Tumor Targeting.” Drug Discovery Today 11 (17–18): 812–818. doi:10.1016/j.drudis.2006.07.005.
- Johnston, H. J., M. Semmler-Behnke, D. M. Brown, W. Kreyling, L. Tran, and V. Stone. 2010. “Evaluating the Uptake and Intracellular Fate of Polystyrene Nanoparticles by Primary and Hepatocyte Cell Lines in Vitro.” Toxicology and Applied Pharmacology 242 (1): 66–78. doi:10.1016/j.taap.2009.09.015.
- Jovic, M., M. Sharma, J. Rahajeng, and S. Caplan. 2010. “The Early Endosome: A Busy Sorting Station for Proteins at the Crossroads.” Histology and Histopathology 25 (1): 99–112. doi:10.1016/j.bbi.2008.05.010.
- Kafshgari, M. H., F. J. Harding, and N. H. Voelcker. 2015. “Insights into Cellular Uptake of Nanoparticles.” Current Drug Delivery 12 (1): 63–77. doi:10.2174/1567201811666140821110631.
- Karakatsanis, A., P. M. Christiansen, L. Fischer, C. Hedin, L. Pistioli, M. Sund, N. R. Rasmussen, et al. 2016. “The Nordic SentiMag Trial: A Comparison of Superparamagnetic Iron Oxide (SPIO) Nanoparticles versus Tc99and Patent Blue in the Detection of Sentinel Node (SN) in Patients with Breast Cancer and a Meta-Analysis of Earlier Studies.” Breast Cancer Research and Treatment 157 (2): 281–294. doi:10.1007/s10549-016-3809-9.
- Karreman, M. A., V. Hyenne, Y. Schwab, and J. G. Goetz. 2016. “Intravital Correlative Microscopy: Imaging Life at the Nanoscale.” Trends in Cell Biology 26 (11): 848–863. doi:10.1016/j.tcb.2016.07.003.
- Kievit, F. M., and M. Zhang. 2011. “Surface Engineering of Iron Oxide Nanoparticles for Targeted Cancer Therapy.” Accounts of Chemical Research 44 (10): 853–862. doi:10.1021/ar2000277.
- Kolhatkar, A. G, A. C. Jamison, D. Litvinov, R. C. Willson, and T. R. Lee. 2013. “Tuning the Magnetic Properties of Nanoparticles.” International Journal of Molecular Sciences 14 (8): 15977–16009. doi:10.3390/ijms015977.
- Kuhn, D. A., D. Vanhecke, B. Michen, F. Blank, P. Gehr, A. Petri-Fink, B. Rothen-Rutishauser, et al. 2014. “Different Endocytotic Uptake Mechanisms for Nanoparticles in Epithelial Cells and Macrophages.” Beilstein Journal of Nanotechnology 5 (1): 1625–1636. doi:10.3762/bjnano.5.174.
- Kumar, A., P. K. Jena, S. Behera, R. F. Lockey, S. Mohapatra, and S. Mohapatra. 2010. “Multifunctional Magnetic Nanoparticles for Targeted Delivery.” Nanomedicine: Nanotechnology, Biology, and Medicine 6 (1): 64–69. doi:10.1016/j.nano.2009.04.002.
- Kwon, B., E. Han, W. Yang, W. Cho, W. Yoo, J. Hwang, B.-M. Kwon, et al. 2016. “Nano-Fenton Reactors as a New Class of Oxidative Stress Amplifying Anticancer Therapeutic Agents.” ACS Applied Materials & Interfaces 8 (9): 5887–5897. doi:10.1021/acsami.5b12523.
- Lacaille-Dubois, M. A., and H. Wagner. 1996. “A Review of the Biological and Pharmacological Activities of Saponins.” Phytomedicine 2 (4): 363–386. doi:10.1016/S0944-7113(96)80081-X.
- Levy, M., N. Luciani, D. Alloyeau, D. Elgrabli, V. Deveaux, C. Pechoux, S. Chat, et al. 2011. “Long Term in Vivo Biotransformation of Iron Oxide Nanoparticles.” Biomaterials 32 (16): 3988–3999. doi:10.1016/j.biomaterials.2011.02.031.
- Li, L.,W. Jiang, K. Luo, H. Song, F. Lan, Y. Wu, Z. Gu, et al. 2013. “Superparamagnetic Iron Oxide Nanoparticles as MRI Contrast Agents for Non-Invasive Stem Cell Labeling and Tracking.” Theranostics 3 (8): 595–615. doi:10.7150/thno.5366.
- Loehr, J., D. Pfeiffer, D. Schüler, and T. M. Fischer. 2016. “Magnetic Guidance of the Magnetotactic Bacterium Magnetospirillum gryphiswaldense.” Soft Matter 12 (15): 3631–3635. doi:10.1039/C6SM00384B.
- Lunov, O., T. Syrovets, B. Büchele, X. Jiang, C. Röcker, K. Tron, G. U. Nienhaus, et al. 2010a. “The Effect of Carboxydextran-Coated Superparamagnetic Iron Oxide Nanoparticles on c-Jun N-Terminal Kinase-Mediated Apoptosis in Human Macrophages.” Biomaterials 31 (19): 5063–5071. doi:10.1016/j.biomaterials.2010.03.023.
- Lunov, O., T. Syrovets, C. Röcker, K. Tron, G. U. Nienhaus, V. Rasche, V. Mailänder, et al. 2010b. “Lysosomal Degradation of the Carboxydextran Shell of Coated Superparamagnetic Iron Oxide Nanoparticles and the Fate of Professional Phagocytes.” Biomaterials 31 (34): 9015–9022. doi:10.1016/j.biomaterials.2010.08.003.
- Lunov, O., V. Zablotskii, T. Syrovets, C. Röcker, K. Tron, G. U. Nienhaus, T. Simmet, et al. 2011. “Modeling Receptor-Mediated Endocytosis of Polymer-Functionalized Iron Oxide Nanoparticles by Human Macrophages.” Biomaterials 32 (2): 547–555. doi:10.1016/j.biomaterials.2010.08.111.
- Lynch, I., A. Ahluwalia, D. Boraschi, H. J. Byrne, B. Fadeel, P. Gehr, A. C. Gutleb, M. Kendall, M. G. Papadopoulos. 2013. “The Bio-Nano-Interface in Predicting Nanoparticle Fate and Behaviour in Living Organisms: Towards Grouping and Categorising Nanomaterials and Ensuring Nanosafety by Design.” Bionanomaterials 14 (3–4): 195–216. doi:10.1515/bnm-2013-0011.
- Lynch, I., K. A. Dawson, J. R. Lead, and E. Valsami-Jones. 2014. “Macromolecular Coronas and Their Importance in Nanotoxicology and Nanoecotoxicology.” Frontiers of Nanoscience 7: 127–156. doi:10.1016/B978-0-08-099408-6.00004-9.
- Maher, B. A., I. A. M. Ahmed, V. Karloukovski, D. A. MacLaren, P. G. Foulds, D. Allsop, D. M. A. Mann, et al. 2016. “Magnetite Pollution Nanoparticles in the Human Brain.” Proceedings of the National Academy of Sciences 113 (39): 10797–10801. doi:10.1073/pnas.1605941113.
- Mahmoudi, M., S. Sant, B. Wang, S. Laurent, and T. Sen. 2011. “Superparamagnetic Iron Oxide Nanoparticles (SPIONs): Development, Surface Modi fi Cation and Applications in Chemotherapy.” Advanced Drug Delivery Reviews 63 (1–2): 24–46. doi:10.1016/j.addr.2010.05.006.
- Matuszewski, L., T. Persigehl, A. Wall, W. Schwindt, B. Tombach, M. Fobker, C. Poremba, W. Ebert, W. Heindel, and C. Bremer. 2005. “Cell Tagging with Clinically Approved Iron Oxides: feasibility and Effect of Lipofection, Particle Size, and Surface Coating on Labeling Efficiency.” Radiology 235 (1): 155–161. doi:10.1148/radiol.2351040094.
- Mayor, S., E. Presley, and F. R. Maxfield. 1993. “Sorting of Membrane Components from Endosomes and Subsequent Recycling to the Cell Surface Occurs by a Bulk Flow Process.” The Journal of Cell Biology 121 (6): 1257–2018. https://www.ncbi.nlm.nih.gov/pmc/articles/PMC2119709/pdf/jc12161257.pdf. doi:10.1083/jcb.121.6.1257.
- Mazzolini, J., A. Khan, E. Guggenheim, R. Shaw, K. Chipman, R. J. M. Weber, H. S. Chen, M. Viant, and J. Z. Rappoport. 2015. “Protein Corona Modulates Cellular Entry and Toxicity of Nanoceria via Transferrin Dependent Clathrin-Mediated Endocytosis.” The Biological bulletin 231 (1): 40–60.
- Miele, E., G. P. Spinelli, E. Miele, F. Tomao, and S. Tomao. 2009. “Albumin-Bound Formulation of Paclitaxel (Abraxane&Reg; ABI-007) in the Treatment of Breast Cancer.” International Journal of Nanomedicine 4: 99–105. doi:10.2147/IJN.S3061.
- Monopoli, M. P., A. S. Pitek, I. Lynch, and K. A. Dawson. 2013. Nanomaterial Interfaces in Biology. Methods in Molecular Biology. Clifton, NJ: Humana Press.
- Moore, M. N. 2006. “Do Nanoparticles Present Ecotoxicological Risks for the Health of the Aquatic Environment?” Environment International 32 (8): 967–976. doi:10.1016/j.envint.2006.06.014.
- Motley, A., N. A. Bright, M. N.J. Seaman, and M. S. Robinson. 2003. “Clathrin-Mediated Endocytosis in AP-2-Depleted Cells.” The Journal of Cell Biology 162 (5): 909–918. doi:10.1083/jcb.200305145.
- Nemmar, A., S. Beegam, P. Yuvaraju, J. Yasin, S. Tariq, S. Attoub, and B.H. Ali. 2016. “Ultrasmall Superparamagnetic Iron Oxide Nanoparticles Acutely Promote Thrombosis and Cardiac Oxidative Stress and DNA Damage in Mice.” Particle and Fibre Toxicology 13 (1): 22. doi:10.1186/s12989-016-0132-x.
- Neuwelt, A., N. Sidhu, C.-A. A. Hu, G. Mlady, S. C. Eberhardt, and L. O. Sillerud. 2015. “Iron-Based Superparamagnetic Nanoparticle Contrast Agents for MRI of Infection and Inflammation.” American Journal of Roentgenology 204 (3): W302–13. doi:10.2214/AJR.14.12733.
- Ong, K. J., T. J. MacCormack, R. J. Clark, J. D. Ede, V. A. Ortega, L. C. Felix, M. K. M. Dang, G. Ma, H. Fenniri, J. G. C. Veinot, and G. G. Goss. 2014. “Widespread Nanoparticle-Assay Interference: Implications for Nanotoxicity Testing.” PLOS One 9 (3): e90650. doi:10.1371/journal.pone.0090650.
- Park, B., K. Donaldson, R. Duffin, L. Tran, F. Kelly, I. Mudway, J.-P. Morin, et al. 2008. “Hazard and Risk Assessment of a Nanoparticulate Cerium Oxide-Based Diesel Fuel Additive – a Case Study.” Inhalation Toxicology 20 (6): 547–566. doi:10.1080/08958370801915309.
- Patskovsky, S., É. Bergeron, D. Rioux, M. Simard, and M. Meunier. 2014. “Hyperspectral Reflected Light Microscopy of Plasmonic Au/Ag Alloy Nanoparticles Incubated as Multiplex Chromatic Biomarkers with Cancer Cells.” The Analyst 139 (20): 5247–5253. doi:10.1039/C4AN01063A.
- Pike, J. A., I. B. Styles, J. Z. Rappoport, and J. K. Heath. 2017. “Quantifying Receptor Trafficking and Colocalization with Confocal Microscopy.” Methods 115: 42. doi:10.1016/j.ymeth.2017.01.005.
- Quinn, M. K., N. Gnan, S. James, A. Ninarello, F. Sciortino, E. Zaccarelli, J. J. McManus, et al. 2015. “How Fluorescent Labelling Alters the Solution Behaviour of Proteins.” Physical Chemistry Chemical Physics 17 (46): 31177–31187. doi:10.1039/C5CP04463D.
- Rappoport, J. Z. and S. M. Simon. 2009. “Endocytic Trafficking of Activated EGFR is AP-2 Dependent and Occurs through Preformed Clathrin Spots.” Journal of Cell Science 122 (9): 1301–1305. doi:10.1242/jcs.040030.
- Rastar, A., M. E. Yazdanshenas, A. Rashidi, and S. M. Bidoki. 2013. “Theoritical Review of Optical Properties of Nanoparticles.” Journal of Engineering Fibers and Fabrics 8 (2): 85–96. doi:10.1109/JLT.2005.861943.
- Rayleigh, L. 1903. “On the Theory of Optical Images, with Special Reference to the Microscope.” Journal of the Royal Microscopical Society 23 (4): 474–482. doi:10.1111/j.1365-2818.1903.tb04831.x.
- Raynal, I., P. Prigent, S. Peyramaure, A. Najid, C. Rebuzzi, and C. Corot. 2004. “Macrophage Endocytosis of Superparamagnetic Iron Oxide Nanoparticles: mechanisms and Comparison of Ferumoxides and Ferumoxtran-10.” Investigative Radiology 39 (1): 56–63. doi:10.1097/01.rli.0000101027.57021.28.
- Re, F., R. Moresco, and M. Masserini. 2012. “Nanoparticles for Neuroimaging.” Journal of Physics D: Applied Physics 45 (7). doi:10.1088/0022-3727/45/7/073001.
- Reimer, P., N. Jähnke, M. Fiebich, W. Schima, F. Deckers, C. Marx, N. Holzknecht, and S. Saini. 2000. “Hepatic Lesion Detection and Characterization: Value of Nonenhanced MR Imaging, Superparamagnetic Iron Oxide–Enhanced MR Imaging, and Spiral CT—ROC Analysis.” Radiology 217 (1): 152–158. doi:10.1148/radiology.217.1.r00oc31152.
- Reimer, P., and B. Tombach. 1998. “Hepatic MRI with SPIO: detection and Characterization of Focal Liver Lesions.” European Radiology 1204 (8): 1198–1204. doi:10.1007/s003300050535.
- Sahay, G., D. Y. Alakhova, and A. V. Kabanov. 2010. “Endocytosis of Nanomedicines.” Journal of Controlled Release 145 (3): 182–195. doi:10.1016/j.jconrel.2010.01.036.
- Sakulkhu, U., M. Mahmoudi, L. Maurizi, J. Salaklang, and H. Hofmann. 2015. “Protein Corona Composition of Superparamagnetic Iron Oxide Nanoparticles with Various Physico-Chemical Properties and Coatings.” Scientific Reports 4 (1): 5020. doi:10.1038/srep05020.
- Sandin, P., L. W. Fitzpatrick, J. C. Simpson, and K. A. Dawson. 2012. “High-Speed Imaging of Rab Family Small GTPases Reveals Rare Events in Nanoparticle Trafficking in Living Cells.” ACS Nano American Chemical Society, 6 (2): 1513–1521. doi:10.1021/nn204448x.
- Santra, S., C. Kaittanis, J. Grimm, and J. M. Perez. 2009. “Drug/Dye-Loaded, Multifunctional Iron Oxide Nanoparticles for Combined Targeted Cancer Therapy and Dual Optical/Magnetic Resonance Imaging.” Small 5 (16): 1862–1868. doi:10.1002/smll.200900389.
- Schlorf, T., M. Meincke, E. Kossel, C.-C. Glüer, O. Jansen, and R. Mentlein. 2010. “Biological Properties of Iron Oxide Nanoparticles for Cellular and Molecular Magnetic Resonance Imaging.” International Journal of Molecular Sciences 12 (1): 12–23. doi:10.3390/ijms1012.
- Schütz, C. A., L. Juillerat-Jeanneret, H. Mueller, I. Lynch, and M. Riediker. 2013. “Therapeutic Nanoparticles in Clinics and Under Clinical Evaluation.” Nanomedicine 8 (3): 449–467. doi:10.2217/nnm.13.8.
- Shen, Y., Z. Huang, X. Liu, J. Qian, J. Xu, X. Yang, A. Sun, et al. 2015. “Iron-Induced Myocardial Injury: An Alarming Side Effect of Superparamagnetic Iron Oxide Nanoparticles.” Journal of Cellular and Molecular Medicine 19 (8): 2032–2035. doi:10.1111/jcmm.12582.
- Shipley, H. J., K. E. Engates, and A. M. Guettner. 2011. “Study of Iron Oxide Nanoparticles in Soil for Remediation of Arsenic.” Journal of Nanoparticle Research 13 (6): 2387–2397. doi:10.1007/s11051-010-9999-x.
- Sigmund, W., H. El-Shall, D. O. Shah, and B. M. Moudgil. 2008. Particulate Systems in Nano- and Biotechnologies. Boca Raton, FL: CRC Press. https://books.google.com/books?id=3MWSicRibZsC&pgis=1.
- Silva, A. H., E. Lima, M. V. Mansilla, R. D. Zysler, H. Troiani, M. L. M. Pisciotti, C. Locatelli, et al. 2016. “Superparamagnetic Iron-Oxide Nanoparticles mPEG350- and mPEG2000-Coated: Cell Uptake and Biocompatibility Evaluation.” Nanomedicine: Nanotechnology, Biology, and Medicine 12 (4): 909–919. doi:10.1016/j.nano.2015.12.371.
- Singh, N. 2010. “Potential Toxicity of Superparamagnetic Iron Oxide Nanoparticles (SPION).” Nano Reviews 1: 1–15. doi:10.3402/nano.v1i0.5358.
- Smith, P. J., M. Giroud, H. L. Wiggins, F. Gower, J. A. Thorley, B. Stolpe, J. Mazzolini, et al. 2012. “Cellular Entry of Nanoparticles via Serum Sensitive Clathrin-Mediated Endocytosis, and Plasma Membrane Permeabilization.” International Journal of Nanomedicine 7: 2045–2055. doi:10.2147/IJN.S29334.
- Soenen, S. J. H., N. Nuytten, S. F. De Meyer, S. C. De Smedt, and M. De Cuyper. 2010a. “High Intracellular Iron Oxide Nanoparticle Concentrations Affect Cellular Cytoskeleton and Focal Adhesion Kinase-Mediated Signaling.” Small 6 (7): 832–842. doi:10.1002/smll.200902084.
- Soenen, S. J. H., U. Himmelreich, N. Nuytten, T. R. Pisanic, A. Ferrari, and M. De Cuyper. 2010b. “Intracellular Nanoparticle Coating Stability Determines Nanoparticle Diagnostics Efficacy and Cell Functionality.” Small 6 (19): 2136–2145. doi:10.1002/smll.201000763.
- Sokolov, K., M. Follen, J. Aaron, I. Pavlova, A. Malpica, R. Lotan, and R. Richards-Kortum 2003. “Real-Time Vital Optical Imaging of Precancer Using anti-Epidermal Growth Factor Receptor Antibodies Conjugated to Gold Nanoparticles ” Cancer Research. 63 (9): 1999–2004.
- Sonvico, F., S. Mornet, S. Vasseur, C. Dubernet, D. Jaillard, J. Degrouard, J. Hoebeke, et al. 2005. “Folate-Conjugated Iron Oxide Nanoparticles for Solid Tumor Targeting as Potential Specific Magnetic Hyperthermia Mediators: Synthesis, Physicochemical Characterization, and in Vitro Experiments.” Bioconjugate Chemistry 16 (5): 1181–1188. doi:10.1021/bc050050z.
- Stark, D. D., R. Weissleder, G. Elizondo, P. F. Hahn, S. Saini, L. E. Todd, J. Wittenberg, et al. 1988. “Superparamagnetic Iron Oxide: clinical Application as a Contrast Agent for MR Imaging of the Liver.” Radiology 168 (2): 297–301. doi:10.1148/radiology.168.2.3393649.
- Stebounova, L. V., E. Guio, and V. H. Grassian. 2011. “Silver Nanoparticles in Simulated Biological Media: A Study of Aggregation, Sedimentation, and Dissolution.” Journal of Nanoparticle Research 13 (1): 233–244. doi:10.1007/s11051-010-0022-3.
- Sugden, J. K. 2004. “Photochemistry of Dyes and Fluorochromes Used in Biology and Medicine: some Physicochemical Background and Current Applications.” Biotechnic & Histochemistry 79 (2): 71–90. doi:10.1080/10520290412331292400.
- Thomsen, L. B., T. Linemann, K. M. Pondman, J. Lichota, K. S. Kim, R. J. Pieters, G. M. Visser, et al. 2013. “Uptake and Transport of Superparamagnetic Iron Oxide Nanoparticles through Human Brain Capillary Endothelial Cells.” ACS Chemical Neuroscience 4 (10): 1352–1360. doi:10.1021/cn400093z.
- Trono, J. D., K. Mizuno, N. Yusa, T. Matsukawa, K. Yokoyama, and M. Uesaka. 2011. “Size, Concentration and Incubation Time Dependence of Gold Nanoparticle Uptake into Pancreas Cancer Cells and Its Future Application to X-Ray Drug Delivery System.” Journal of Radiation Research 52 (1): 103–109. doi:10.1269/jrr.10068.
- Ullrich, O., S Reinsch, S. Urb, M. Zerial, and R. G. Parton 1996. “Rab11 Regulates Recycling through the Pericentriolar Recycling Endosome.” The Journal of Cell Biology 135 (4): 913–924. doi:10.1083/jcb.135.4.913.
- Vanlandingham, P. A., and B. P. Ceresa. 2009. “Rab7 Regulates Late Endocytic Trafficking Downstream of Multivesicular Body Biogenesis and Cargo Sequestration.” Journal of Biological Chemistry 284 (18): 12110–12124. doi:10.1074/jbc.M809277200.
- Venditto, V. J., and F. C. Szoka. 2013. “Cancer Nanomedicines: So Many Papers and so Few Drugs!.” Advanced Drug Delivery Reviews 65 (1): 80–88. doi:10.1016/j.addr.2012.09.038.
- Verdat M. E. 1869. Leçons D’optique Physique. Paris: L’Imprimierie Imperiale.
- Wahajuddin and S. Arora. 2012. “Superparamagnetic Iron Oxide Nanoparticles: magnetic Nanoplatforms as Drug Carriers.” International Journal of Nanomedicine 7: 3445–3471. doi:10.2147/IJN.S30320.
- Wang, Y. J. 2011. “Superparamagnetic Iron Oxide Based MRI Contrast Agents: Current Status of Clinical Application.” Quantitative Imaging in Medicine and Surgery 1 (1): 35–40. doi:10.3978/j.issn.2223-4292.2011.08.03.
- Wang, Y.-X. J. 2015. “Current Status of Superparamagnetic Iron Oxide Contrast Agents for Liver Magnetic Resonance Imaging.” World Journal of Gastroenterology 21 (47): 13400–13402. doi:10.3748/wjg.v21.i47.13400.
- Wang, Z., and A. Cuschieri. 2013. “Tumour Cell Labelling by Magnetic Nanoparticles with Determination of Intracellular Iron Content and Spatial Distribution of the Intracellular Iron.” International Journal of Molecular Sciences 14 (5): 9111–9125. doi:10.3390/ijms14059111.
- Xu, H., W. Dai, Y. Han, W. Hao, F. Xiong, Y. Zhang, J.-M. Cao, et al. 2010. “Differential Internalization of Superparamagnetic Iron Oxide Nanoparticles in Different Types of Cells.” Journal of Nanoscience and Nanotechnology 10 (11): 7406–7410. doi:10.1166/jnn.2010.2830.
- Yang, C. Y., M.-F. Tai, C.-P. Lin, C.-W. Lu, J.-L. Wang, J.-K. Hsiao, and H.-M. Liu. 2011. “Mechanism of Cellular Uptake and Impact of Ferucarbotran on Macrophage Physiology.” PLOS One 6 (9): e25524. doi:10.1371/journal.pone.0025524.
- Yang, L., H. Kuang, W. Zhang, Z. P. Aguilar, Y. Xiong, W. Lai, H. Xu, et al. 2015. “Size Dependent Biodistribution and Toxicokinetics of Iron Oxide Magnetic Nanoparticles in Mice.” Nanoscale 7 (2): 625–636. doi:10.1039/C4NR05061D.
- Zhang, J., Y. Nazarenko, L. Zhang, L. Calderon, K.-B. Lee, E. Garfunkel, and S. Schwander. 2013. “Impacts of a Nanosized Ceria Additive on Diesel Engine Emissions of Particulate and Gaseous Pollutants.” Environmental Science & Technology 47 (22): 13077–13085. doi:10.1021/es402140u.
- Zhang, L. W., and N. A. Monteiro-Riviere. 2009. “Mechanisms of Quantum Dot Nanoparticle Cellular Uptake.” Toxicological Sciences 110 (1): 138–155. doi:10.1093/toxsci/kfp087.
- Zhang, Z., R. D. Ross, and R. K. Roeder. 2010. “Preparation of Functionalized Gold Nanoparticles as a Targeted X-ray Contrast Agent for Damaged Bone Tissue.” Nanoscale 2 (4): 582–586. doi:10.1039/b9nr00317g.
- Zhao, F., Y. Zhao, Y. Liu, X. Chang, C. Chen, and Y. Zhao. 2011. “Cellular Uptake, Intracellular Trafficking, and Cytotoxicity of Nanomaterials.” Small 7 (10): 1322–1337. doi:10.1002/smll.201100001.