
 ?Mathematical formulae have been encoded as MathML and are displayed in this HTML version using MathJax in order to improve their display. Uncheck the box to turn MathJax off. This feature requires Javascript. Click on a formula to zoom.
Abstract
No detailed information on in vivo biokinetics of CeO2 nanoparticles (NPs) following chronic low-dose inhalation is available. The CeO2 burden for lung, lung-associated lymph nodes, and major non-pulmonary organs, blood, and feces, was determined in a chronic whole-body inhalation study in female Wistar rats undertaken according to OECD TG453 (6 h per day for 5 days per week for a 104 weeks with the following concentrations: 0, 0.1, 0.3, 1.0, and 3.0 mg/m3, animals were sacrificed after 3, 12, 24 months). Different spectroscopy methods (ICP-MS, ion-beam-microscopy) were used for the quantification of organ burden and for visualization of NP distribution patterns in tissues. After 24 months of exposure, the highest CeO2 lung burden (4.41 mg per lung) was associated with the highest aerosol concentration and was proportionally lower for the other groups in a dose-dependent manner. Imaging techniques confirmed the presence of CeO2 agglomerates of different size categories within lung tissue with a non-homogenous distribution. For the highest exposure group, after 24 months in total 1.2% of the dose retained in the lung was found in the organs and tissues analyzed in this study, excluding lymph nodes and skeleton. The CeO2 burden per tissue decreased from lungs > lymph nodes > hard bone > liver > bone marrow. For two dosage groups, the liver organ burden showed a low accumulation rate. Here, the liver can be regarded as depot, whereas kidneys, the skeleton, and bone marrow seem to be dumps due to steadily increasing NP burden over time.
Introduction
Lung clearance of inhaled particles of low solubility and intrinsic toxicity is quite different to that for soluble ones. In the literature, this specific group of particles is also referred to as ‘poorly soluble particles of low toxicity’ (PSLT; Dankovic, Kuempel, and Wheeler Citation2007), ‘poorly soluble particles of low cytotoxicity’ (PSP; Oberdorster Citation2002), or respirable ‘granular biodurable particles without known significant specific toxicity’ (GBP, Roller and Pott Citation2006). This category of particles comprises commercially relevant nanomaterials (NMs) like carbon black, titanium dioxide (TiO2), or cerium dioxide (CeO2).
For risk assessment, it is important to understand the capability of PSLT particles to accumulate in the lung and to get insight into the particle distribution in extra-pulmonary organs after chronic exposure. However, lung cancer (e.g. adenocarcinoma) has been observed in chronic rat inhalation studies only at extremely high exposure concentrations (Heinrich et al. Citation1994, Citation1995; Mauderly et al. Citation1994; Nikula et al. Citation1995). Therefore, lung cancer (Cullen et al. Citation1999, Citation2000; Lee et al. Citation1986; Snipes et al. Citation1993) has been associated with ‘overloading’ of lungs with particles which caused chronic inflammation and fibrosis. Under these overload conditions (Morrow Citation1988, Citation1992), it has been hypothesized that overload occurs when alveolar macrophages are loaded with ≥6% of their volume with PSLT particles.
For chronic low-dose exposure, however, where inhalation of PSLT particles is extended over a time span of 12 months or longer, the natural defense mechanisms of the lung may become impaired. The question therefore arises whether, provided that the aerosol exposure concentration is so low that no inflammation is to be expected, no risk of lung cancer is to be anticipated even under long-term conditions (Borm, Cassee, and Oberdorster Citation2015).
For CeO2 nanoparticles (NPs), it was suggested that the behavior is not fundamentally different from chronic exposure with dust particles (AGS Citation2015; Landsiedel et al. Citation2014; Oberdorster et al. Citation1992; Pauluhn Citation2017) and consequently a threshold of aerosol exposure concentration could be found where no adverse effects are expected.
Previous studies focusing on the inhalation of CeO2 NPs (NM-212) have determined a retention half-time of 40 days and a lung burden of 41 μg/lung after an exposure time of 28 days with an postexposure time of 40 days at aerosol concentrations of 0.5 mg/m3 (Keller et al. Citation2014). The same study found indications for a retarded retention half-time with a lung burden of 500 μg CeO2/lung at an aerosol concentration of 5 mg/m3. Here, the observed lung burdens remained constant during the post-exposure period (Keller et al. Citation2014). This finding is in line with the retention half-times of particles of low solubility from other studies, which resulted in half-times between 60 and 70 days (Oberdorster Citation2002).
As in vivo toxicity studies of NPs following chronic low-dose inhalation are scarce, and no data exist for CeO2 NPs, an organ burden study with CeO2 (NM-212) was performed according to the Organization for Economic Co-operation and Development (OECD) test guideline (TG) no. 453 to close the existing knowledge gap (OECD Citation2009).
Furthermore, the question of whether long-term exposure to PSLT may lead to adverse effects in extra-pulmonary organs is currently unanswered. This has been identified as one of the major obstacles for risk assessors in the field of NM regulation (Becker et al. Citation2011). Thus, additionally in this study we determined the organ burden of all major extra-pulmonary organs including liver, kidneys, spleen, heart, brain, olfactory bulb as well as bone and bone marrow. Accumulation in one of these organs may suggest the potential for toxicity. While the total organ burden of CeO2 was calculated based on the cerium (Ce) ion content measured using inductively coupled plasma mass spectrometry (ICP-MS), time-of-flight secondary ion mass spectrometry (ToF-SIMS) and ion beam microscopy (IBM) techniques, such as micro-resolved proton induced X-ray emission (µPIXE) and micro-resolved Rutherford backscattering (µRBS), were used for visualization of NP distribution patterns in tissue, their localization in single cells as well as for particle identification.
Methods
CeO2 NPs
This study used CeO2 NPs (NM-212), which were also part of the ‘Nanomaterial Testing Sponsorship Program’ of the OECD (Citation2007). NM-212 was provided by the Fraunhofer Institute for Molecular Biology and Applied Ecology (Fh-IME, Schmallenberg, Germany). The NP characterization was done by the European Commission Joint Research Center (JRC) Nanomaterial Repository (Ispra, Italy). NM-212: primary particle size 28.4 nm, mean BET surface area 27.2 m2/g, water solubility <1 μg/L, purity >99.5% (Information provided by Singh et al. (Citation2014) and Fh-IME Schmallenberg). Characterization, generation, and monitoring of the aerosolized CeO2 NPs were carried out at BASF SE (Ludwigshafen, Germany).
Study design
Animals
The protocols for the long-term inhalation studies were approved by the local authorizing agency at the ‘Landesuntersuchungsamt’, Koblenz, Germany. The procedures for inhalation exposure, aerosol generation, and the monitoring system have been described elsewhere (Konduru et al. Citation2014). Female Wistar Han rats were obtained at 7 weeks of age from Charles River Laboratories (Sulzfeld, Germany). The animals were maintained in groups of up to five animals in polysulfon cages (TECNIPLAST, Germany) with access to wooden gnawing blocks, GLP certified feed (Kliba laboratory diet, Provimi Kliba SA, Kaiseraugst, Basel, Switzerland), and water ad libitum. The low-dose long-term inhalation study was performed in line with OECD TG 453 (OECD Citation2009). The animals were exposed to CeO2 aerosols for a total of 104 weeks (2 years). Exposure to CeO2 NPs was 5 days a week for 6 h per day. Aerosol concentrations were 0 mg/m3 (control group, filtered air), 0.1 mg/m3 (Group #1), 0.3 mg/m3 (Group #2), 1.0 mg/m3 (Group #3), and 3.0 mg/m3 (Group #4). These concentrations were chosen on the basis of results from a preliminary 28 day study (Keller et al. Citation2014). For Groups #1 and #2 no indications of toxicity were anticipated. For Group #3, minor toxicological effects were expected due to exposure concentrations beyond a possible no observed adverse effect level (NOAEL). Dose Group #4 should cause significant adverse effects as it was anticipated that the deposited doses in the lung would reach the level at which the overload of the lungs would occur. Additionally, a control group of animals with no NP exposure was established. Animals were sacrificed at 3, 12, and 24 months. For the 3 and 12 months’ time point, three animals per dose group were sacrificed, for the 24 months’ time point four animals per dose group were used in the study.
The animals were exposed whilst being in wire cages located in a stainless-steel whole-body inhalation chamber (V = 2.8 m3 or V = 1.4 m3). The aerosols entered the inhalation chambers with the supply air and were removed by an exhaust air system with 20 air changes per hour.
Characterization, generation, and monitoring of aerosols, animal whole-body exposure, and all clinical pathology were performed at BASF SE Ludwigshafen, Germany.
NP concentrations and MMAD values
Aerosol characterization was undertaken according to the methods described previously by Wohlleben et al. (Citation2013) and the results reported by Keller et al. (Citation2014).
The aerosol target levels in all four dose groups during the whole two-year exposure were met and maintained with no significant deviation from the target exposure concentrations (Supplementary Table S1). The particle size distribution ensured the respirability of the aerosols for rats. The results indicate an agglomerated micron-sized aerosol, which varied with concentration (1.4–2.3 µm; Supplementary Table S1).
Details describing the exposure system and the aerosol generation are reported elsewhere (Keller Citation2015; Keller et al. Citation2015, Supplementary Table S1; Ma-Hock et al. Citation2007).
Preparation of biological samples
For organ and tissue sampling, animals were sacrificed under pentobarbitone at BASF SE Ludwigshafen, Germany. For the 2-year study, the following tissues were removed after 3, 12, and 24 months of exposure (n = 3 for time points 3 and 12 month; n = 4 for the 24 month time point): brain, olfactory bulbs, lungs, kidneys, liver, heart, spleen, and small intestine (jejunum) and immediately stored at –80 °C (Kittel et al. Citation2004; Morawietz et al. Citation2004; Ruehl-Fehlert et al. Citation2003). Feces were taken directly from the intestine of the sacrificed animals of the appropriate dose group. Additionally, bone, bone marrow, and blood samples were taken at the same time points. For further details of the techniques used for bone and bone marrow sample extraction and blood sampling see the work by Konduru et al. (Citation2014). Information about the preparation of the bone sections are given in the Supplementary Information section. For the lymph nodes, a distinction was made between tracheobronchial, mediastinal, and mesenteric lymph nodes. The tracheobronchial lymph nodes were analyzed after 3, 12, and 24 months of exposure, while the mesenteric lymph nodes were removed at 12 and 24 month time points and the mediastinal at 24 months. During sample preparation, special attention was paid to prevent cross contamination. Organ weights are given in Supplementary Table S2.
ICP-MS quantification
Organ burdens were determined using ICP-MS. Concentrations (e.g. ng/g) are quoted with respect to their wet weight. For all ICP-MS measurements, the measured Ce content was converted to CeO2 content throughout the whole study. The total organ burden of CeO2 was calculated based on the cerium (Ce) ion content measured using ICP-MS.
After microwave digestion (see Supplementary Information for details), the organ samples were subjected to ICP-MS-analysis. 140Ce and 142Ce were quantified using 115In and 175Lu as internal standards. For the ICP-MS analysis, an XSeries II (Thermo Scientific, Bremen, Germany) equipped with an Apex Microflow perfluoroalkoxy alkane nebulizer and a cyclonic quartz spray chamber was used. Limits of detection for 140Ce and 142Ce were 0.004 ng and 0.009 ng per milligram tissue. The recoveries for different tissues, bone, bone marrow, feces, and blood were within the range of 86% (brain) and 120% (feces). This has been determined in three independent analyses for three different concentrations each (0.2, 2.0, and 20 ppb, Supplementary Table S3).
For the calculation of the limit of detection for blood, the reference material Seronorm™ trace elements whole blood level 1 (LGC Standards GmbH, Wesel, Germany) was used. Additionally, the following reference material was used to quantify the cerium content: BCR 667 (Reference Material BCR 667. Citation2001): Estuarine sediment.
The estimation of the measurement uncertainty was calculated according to DIN V ENV 13005:1999-06 for three concentrations (0.2 ng; 2.0 ng, and 20 ng 140Ce per mg with 115In as internal standard, based on 10 replicates per tissue). It varied between 0.0028 and 0.541 ng/mg.
Modeling of lung burden
Experimentally quantified lung burdens were compared with predictions of the deposited alveolar burden using the software. ‘Multiple path particle dosimetry (MPPD, Citation2019) model version 3.04’ was used. Input data defining the aerosol are as provided in Supplementary Table S1, for all other input data MPPD default values were used.
Based on the aerosol characteristics measured during NP exposure, a prediction of the deposited alveolar fraction was generated using the MPPD model.
For the four aerosol concentrations (#1–#4), an alveolar deposition fraction of around 12% was determined. The following two equations were used to calculate the retained mass after one day of exposure (6 h, approximation as no clearance is considered; deposition fraction see ) and the retained dose after t days of exposure considering an exposure regime of 6 h per day for 5 days per week.
(1)
(1)
(2)
(2)
where Dep(1) = retained mass (μg) after exposure day 1, LungBu(t) = retained mass (μg) after t exposure days, t = exposure time (days), t1 = exposure time, day 1 (min), MV = minute volume rat (L/min); 0.2 L/min (Office of Environmental Health Hazard Assessment California Environmental Protection Agency Citation2018), C = nanoparticle concentration (mg/m3), DF = deposition fraction, and k = elimination constant (k = ln(2)/t1/2).
EquationEquation (2)(2)
(2) was also applied to calculate the clearance half time using the measured lung burden values. For the density of the particles, a default value of 1.0 g/cm3 was used. A default elimination half-time (where t1/2 is the clearance half time) of 70 days was applied for the aerosol concentrations #1–#3 and 200 days for #4 taking into account the potential overload situation for the lung (Keller et al. Citation2015; Schwotzer et al. Citation2017). For the calculation of the effective clearance half-time an iterative approach was used.
It has to be noted that EquationEquations (1)(1)
(1) and Equation(2)
(2)
(2) are simplistic representations of what is happening during the experiment and are designed to give an indication of the pattern of change of the lung burden. MV is an average value with error bars and is not a constant throughout the exposure, so Dep(day = x) is not a constant. As the animals grow during the exposure their lungs increase in size (Supplementary Table S1) and their MV will increase proportionally.
Time of flight secondary ion mass spectrometry
Reconstructed ion images and the associated mass spectra were acquired using a time of flight secondary ion mass spectrometry (ToF-SIMS) V instrument (ION-TOF GmbH, Münster, Germany) with a 30 keV nano-bismuth primary ion beam source (-cluster ion source with a BiMn emitter). The ion currents were 0.5 pA at 5 kHz using a Faraday cup. A pulse of 0.7 ns from the bunching system resulted in a mass resolution that usually exceeded 6000 (full width at half-maximum) at m/z <500 in positive ion mode. The primary ion dose was controlled below 1012 ions cm−2 to ensure static SIMS conditions. Charge compensation on the sample was obtained by a pulsed electron flood gun with 20 eV electrons.
The primary ion gun scanned a field of view of 500 µm × 500 μm applying a 2048 × 2048 pixel measurement raster. Seven micrometer thick, paraffin-embedded lung sections (prepared as described in Supplementary Information) were de-parafinized and analyzed. Liver and bone sections, prepared as described in Supplementary Information, were also analyzed using the same technique. Once the primary ion gun was aligned, ToF-SIMS mass spectra were generated by summing the detected secondary ion intensities and plotting them against the mass channels. The data were evaluated using the Surface Lab software (ION-TOF GmbH, Muenster, Germany).
Particle calculation
For particle detection, ion images of the CeO+-derived fragment ion m/z 156.12 were considered. Particles were detected using the freeware spot detection program of the software packet ‘ImageJ’. Counts of CeO+-agglomerate signals from a minimum of 12 tissue sections (1.5 mm × 1 mm, 6144 pixel × 4096 pixel) from three lung tissues per dose group were recorded and categorized into 10 groups. Group #1: 1–1.49 µm2; Group #2: 1.5–2.49 µm2; Group #3: 2.5–3.49 µm2; Group #4: 3.5–4.49 µm2; Group #5: 4.5–6.09 µm2; Group #6: 6.1–12.16 µm2; Group #7: 12.17–16.37 µm2; Group #8: 16.38–30.41 µm2; Group #9: 30.42–200 µm2; Group #10: >200 µm2 particle area.
Ion beam microscopy
Ion beam microscopy (IBM) was used as a tool to visualize and quantify chemical elements as well as NPs in cells in the ppm range (Baum et al. Citation2016; Carmona, Deves, and Ortega Citation2008; Collins et al. Citation2017; Govil Citation2001; Lichtenstein et al. Citation2017; Llop et al. Citation2014; Zhou et al. Citation2014). Seven micrometer thick, paraffin-embedded lung sections were de-paraffinized and embedded in DePeX for IBM analysis. IBM was performed at the Leipzig ion nanoprobe laboratory LIPSION using a 2.25 MeV proton beam with a spot size of approximately 1 µm. Under the vacuum of 10−6 Torr, IBM techniques, such as micro-resolved proton induced X-ray emission (µPIXE) and micro-resolved Rutherford backscattering (µRBS), were used simultaneously to study the spatial distribution of cellular elements as well as cerium in lung tissues. Extracted µRBS spectra from regions-of-interest (ROIs) were analyzed to determine accumulated charge, area density (atoms/cm2), and cell matrix element composition (C, N, O). These parameters were then used as input for µPIXE analysis by means of GeoPIXE software (CSIRO Earth Science and Resource Engineering, Australia) to quantify element concentrations in lung sections (for details see Meyer et al. Citation2019).
Information about the statistical analysis is given in the Supplementary Information.
Results
Lung and lymph node burden
During the 2-year inhalation study, the lung burden was evaluated after 3, 12, and 24 months of low-dose exposure. After 24 months of exposure, the maximum CeO2 lung burden (5.88 mg CeO2/lung) with a mean value of4.4 ± 1.0 mg/lung was found associated with the highest aerosol concentration of Group #4 ().
Table 1. Lung burden and predicted clearance half-times of exposed rats.
Based on the aerosol characteristics measured during NP exposure, a prediction of the deposited alveolar fraction was generated using the MPPD model (MPPD model version 3.04). For further details see method section.
For all aerosol concentrations tested (Groups #1 to #4), a linear increase in lung burden was observed over time (; R2 values ranging from 0.96 to 0.99). No difference in the curve shape between the lowest and the highest dose group was observed. The highest dose group of 3 mg/m3 (m = 172) showed approximately a threefold higher slope than the next lower exposure concentration (dose Group #3; m = 56). The same relationship was found between the other dose groups, except dose Group #1 with a slightly lower m value as expected (m = 3). This indicates a proportional relationship for exposure dose versus time and amongst at least for the aerosol exposure Groups #2–#4.
Figure 1. Measured versus predicted lung burden: CeO2 contents were measured in lungs of rats exposed to 0.1, 0.3, 1.0 or 3.0 mg/m3 CeO2 NP for up to 24 months. Predicted values (right site) were based on retention fractions calculated with the MPPD model and expected first order elimination with half-times of 70 days (0.1–1.0 mg/m3) or 200 days (3.0 mg/m3).
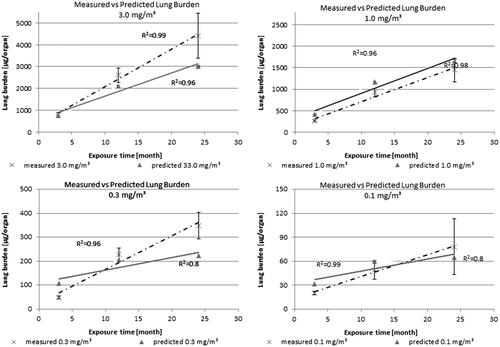
Thus, the data do not suggest hyperbolic curve over the whole study. At an overload situation a hyperbolic curve shape would be expected, where a reduced clearance is observed. For enhanced clearance, a sigmoid curve shape would be foreseen. A change in curve shape from which a threshold could be derived as anticipated by Morrow (Citation1988, Citation1992) could not be located. The corresponding predicted retention half-times calculated using EquationEquation (2)(2)
(2) are summarized in . Notably, a retention half-time of 164 days was calculated for dose Group #3, which was higher than expected. The calculated retention half-time for Group #4 is 200, which would mean the overload condition of the lung is reached.
A presentation of the predicted versus the measured lung burdens is given in . and illustrate the trends for the actual measured and predicted scenario. The results show that the predicted and measured lung burden matched reasonably well. However, there is a tendency when applying the mentioned calculations previously, to underestimate the measured lung burden values, especially after the 12-month time point.
Table 2. Predicted lung burden and deposition fraction of exposed animals.
As lymph nodes play a key role in lung clearance, three different lymph node regions were investigated to measure their CeO2 load. The lung associated lymph nodes (LALN), comprising the tracheobronchial plus the mediastinal lymph nodes and the mesenteric lymph nodes were analyzed individually for all four dose groups ( and , Supplementary Tables S4 and S5). The NP contents of LALN reached a level of 2400 ± 1000 µg CeO2 (n ≥ 3 ( and ). These results show that the LALN carry the highest CeO2 burden from all investigated organs besides the lung, for all dose groups at all studied time points, whereas CeO2 values of the mesenteric lymph nodes are more than 10 000 times lower (<80 ng of total CeO2 in all mesenteric lymph nodes n > 3 collected). Thus, of all investigated organs excluding the lung, lymph nodes in close proximity of the lung carry the highest NP burden resulting from particles deposited in the alveolar region indicating the primary excretory route.
Figure 2. CeO2 content in (A) LALN, (B) liver, (C) kidneys and (D) spleen: (Exposure conditions: Control (0.0 mg/m3), 0.1 mg/m3, 0.3 mg/m3, 1.0 mg/m3 and 3.0 mg/m3).
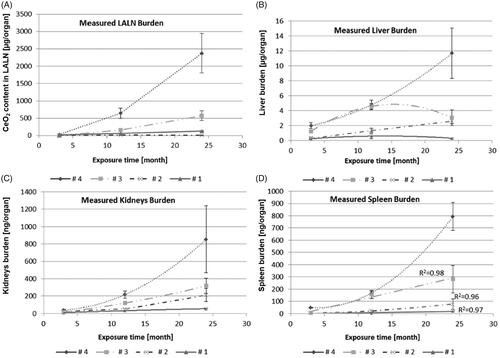
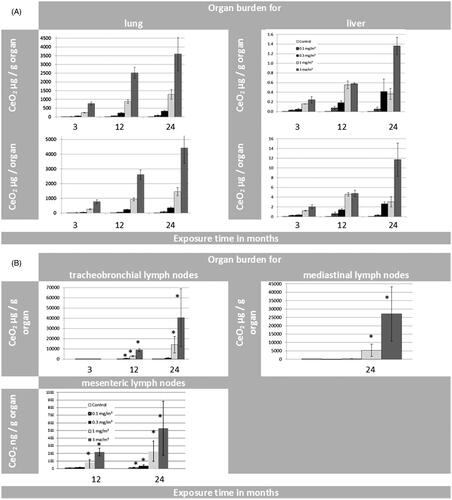
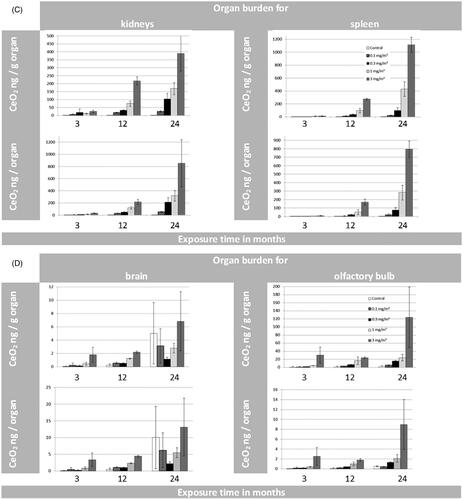
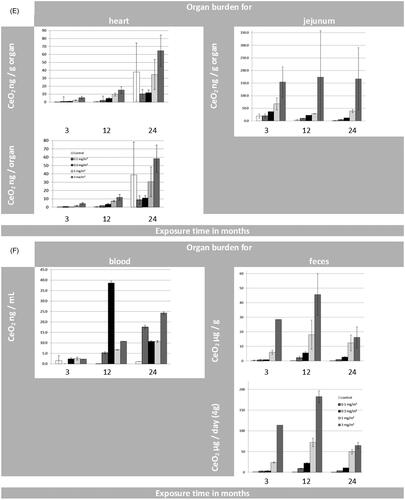
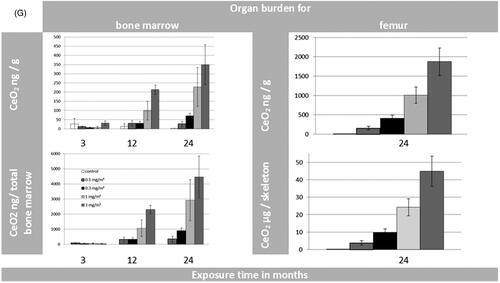
Figure 3. (A) Organ burden of lung and liver expressed as CeO2 [µg/g organ] and CeO2 [µg/organ] during 24 months of exposure. (B) Organ burden of lymph nodes: for tracheobronchial and mediastinal nodes as CeO2 [µg/g organ] and for mesenteric nodes as CeO2 [ng/g organ] during 24 months of exposure. (*p ≤ 0.05 to control). (C) Organ burden of kidneys and spleen as CeO2 [ng/g organ] and CeO2 [ng/organ] during 24 months of exposure. (D) Organ burden of brain and olfactory bulb as CeO2 [ng/g organ] and CeO2 [ng/organ] during 24 months of exposure. (E) Organ burden of heart as CeO2 [ng/g organ] and CeO2 [ng/ organ] during 24 months of exposure in addition to the CeO2 content of jejunum [ng/g organ]. (F) CeO2 concentration of blood [ng/mL] and feces [µg/g or µg/day] during 24 months of exposure. (Here the results were calculated for 4 grams of feces per rat per day as well). (G) CeO2 content of bone and bone marrow expressed as CeO2 [ng/g] or [per skeleton (6% of whole body weight) and total bone marrow (3.2% of whole body weight) respectively] (Travlos Citation2006) during 24 months of exposure.
CeO2 NP visualization in lung tissue samples
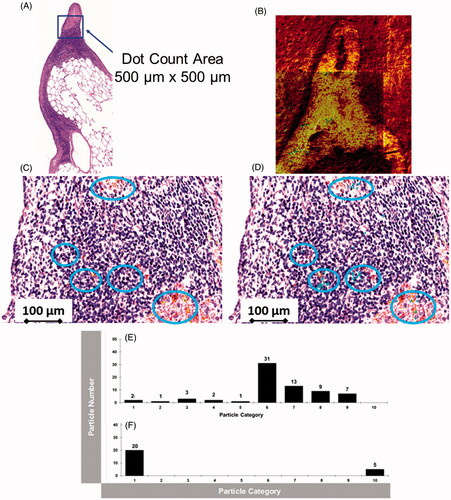
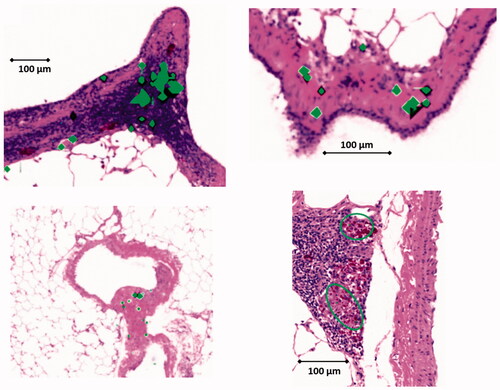
A validated approach was applied to examine lung tissue sections of the 2-year study using the exposure concentration of 3 mg/m3 (Group #4; Veith et al. Citation2018). ToF-SIMS images from the highest aerosol concentration were compared to histopathological light microscope pictures () acquired from a subsequent lung tissue section. The overlay of the mass spectrometry image with the histopathological light microscopy picture () indicates the location of NP agglomerates (shown as blue points in blue circles in ) within the lung tissue section.
Figure 4. (A): Histopathological lung tissue section from the 2-year inhalation study (3.0 mg/m3). The blue square indicates the area, where ToF-SIMS was applied (B). CeO2 NP agglomerates were correlated with histopathological light microscope image (C). (D): Overlay picture (500 µm × 500 µm) of ToF-SIMS signal for CeO2 NP (blue) with histopathological image (b). CeO2 NPs are associated with the BALT (bronchusassociated lymphoid tissue). (E,F): Counts of CeO + agglomerate signals from six image sections (1.5 mm × 1 mm, 6144 pixel × 4096 pixel) from three different lung slices (two each from one lung slice, a total of 36 pictures were counted for (E) and (F) each) at 24-month time point (E) 1.0 mg/m3 and (F) 3.0 mg/m3). The CeO2 NP agglomerates were categorized into 10 groups. Group #1: 1–1.4 µm2; Group #2: 1.5–2.4 µm2; Group #3: 2.5–3.5 µm2; Group #4: 3.5–4.5 µm2; Group #5: 4.5–6.1 µm2; Group #6: 6.1–12.17 µm2; Group #7: 12.17–16.38 µm2; Group #8: 16.38–30.42 µm2; Group #9: 30.42–200 µm2; Group 10: >200 µm2 particle area.
µ-PIXE overview images taken at three different tissue positions at the low exposure concentration of 0.3 mg/m3 also revealed a strongly inhomogeneous NP distribution pattern within the lung tissue (). The particles were found mainly in macrophages indicated through the overlay in green (macrophage identity was confirmed by a H & E stained histopathological image from a subsequent tissue section). In addition, the alveolar septum contained some smaller NP agglomerates (small green spots). Tissue sections of the 2-year study revealed not only an inhomogeneity at the 0.5 mm scale, but also throughout the whole lung. So, NP concentrations in different lung tissue areas varied rather widely (small green spots in ). PIXE and RBS spectra yielded concentrations of 1400 µg/g, 390 µg/g, and 5940 µg/g corresponding to the images from left to right (; Meyer et al. Citation2019). The highest dose corresponded to the largest accumulation of macrophages (Veith et al. Citation2018). Pronounced spots of NPs with very high local concentration can be observed in macrophages and the alveolar septum at exposure dose Group #2 (0.3 mg/m3; ).
Figure 5. µPIXE images of lung tissue slices from the 2-year study (0.3 mg/m3) at three different positions. Sulfur and cerium distributions are shown in overview images with a scanning area of 310 × 540 µm2. Green dots denote the position of cerium overlaid with the image of the sulfur distribution. (For data interpretations see also Veith et al. Citation2018).
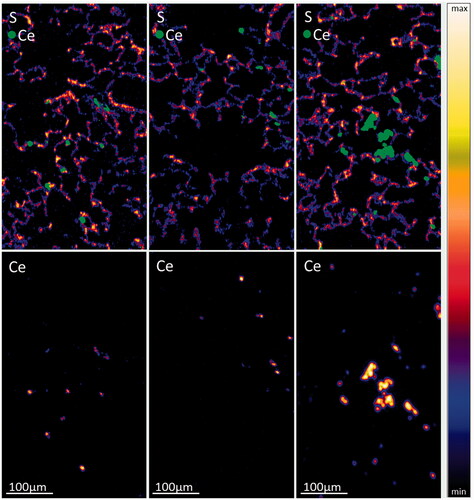
The volume concentration of CeO2 in macrophages at exposure Condition #2 was in the order of 0.6%–2% and 2%–6% assuming the tightest NP packing or the presence of a protein corona around particles, respectively. (For calculations of the volume concentration, see Meyer et al. Citation2019).
In both independent types of analysis, ToF-SIMS imaging mass spectrometry and PIXE, there are significant large NP agglomerates visible, which are concentrated in the bronchus-associated lymphoid tissue (BALT) with smaller agglomerates distributed throughout the remaining lung tissue.
Results for NP categorization are shown in (procedure applied as described by Jungnickel et al. Citation2016). During the chronic inhalation study, very large agglomerates (category 10: >200 µm2) of CeO2 NP are formed in the highest test group after 24 months of exposure. The small- and medium-sized agglomerates, on the contrary, are either significantly less abundant or completely absent. Additionally, a fraction of very small agglomerates (category 1: 1–1.49 µm2) is present in the lung tissue samples of the highest test group (with MMAD 1.4 μm assuming density 1 g/cm3) after 24 months of exposure. When the next lower dose (with MMAD 1.5 μm assuming density 1 g/cm3) from the 2-year inhalation study (#3) was investigated after 24 months (), all observed NP agglomerates were smaller than 200 µm2 and NP agglomerates were observed in all categories besides category 10 (>200 µm2). The highest number of agglomerates was observed in category 6 (6.1–12.17 µm2). These trends in the formation of agglomerates of different sizes can also be seen in .
Figure 6. CeO2 NP agglomerates were correlated with identical histopathological light microscope image using ToF-SIMS analysis. (A–D) show overlay pictures (500 µm × 500 µm) consisting of ToF-SIMS signal for CeO2 NP (green) and their corresponding histopathological images. CeO2 NPs are associated with the BALT (bronchus-associated lymphoid tissue); (a total of 36 pictures were analyzed at 24-month time point, images of dose Group #4 are shown).
Extra-pulmonary organ distribution
In addition to the CeO2 content of the lung and the LALN, organ burdens of the following extra-pulmonary organs were determined after 3, 12, and 24 months of exposure: liver (, Supplementary Table S6), spleen (, Supplementary Table S7), kidneys (, Supplementary Table S8), brain, and olfactory bulb (, Supplementary Table S9), and heart (, Supplementary Table S10). Furthermore, a validated ICP-MS procedure was applied for all mentioned organs including jejunum (, Supplementary Table S12), blood and feces () as well as for the bone and bone marrow (; Supplementary Tables S13 and S14).
For all the non-pulmonary organs, the absolute CeO2 concentrations in the control groups for each time point were very low. The average values ranged from 0.001 to 0.04 ng/mg for tissue and from 0.0001 µg/mg to 0.02 µg/mg for feces. The cerium blood concentrations for all dose groups were below or close to the limit of detection (0.04 µg/mL) and thus negligible.
ANOVA testing was performed for the organ burdens of liver, kidneys, and spleen after 24 months of exposure for significant differences in comparison to the control groups. The results are shown in Supplementary Table S15. Grubbs test revealed significant outliers (p ≤ 0.05) for heart (control group, 24 months), brain (control group, 24 months) and olfactory bulb (control group, 24 months), and tracheobronchial lymph node (#4, 24 month; Grubbs Citation1950).
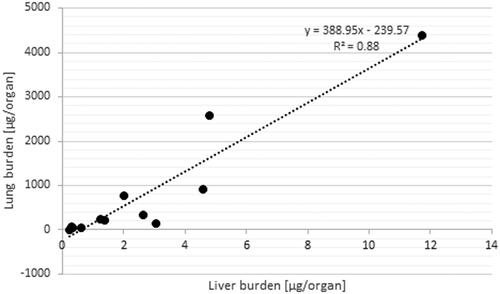
Generally, the highest extra-pulmonary organ burden was detected in Group #4 and was lower in Groups 3, 2, and 1 (Supplementary Tables S6–S12). Besides the LALN, CeO2 burden was highest in liver with the following ranking liver > kidneys, spleen ⋙ heart > brain > olfactory bulb after 24 months (Supplementary Tables S6–S12). The low liver burden is in agreement with the liver sections analyzed with ToF-SIMS (). The ratios of liver to lung burdens are low with a peak at the 12-month time point followed by a leveling off or reduction for all investigated exposure concentrations. Furthermore, a linear relationship between the retained dose in the lung ([µg/organ]) and the organ burden of the liver ([µg/organ]) was detected (, R2 = 0.88; Buckley et al. Citation2017).
Figure 7. ToF-SIMS spectra (A,B) and ion image (C) from a liver tissue section of the liver exposed to 3.0 mg/m3 CeO2 NP at 24-month time point (1000 × 1500 µm). (A): CeO2 NP specific agglomerates represented by the CeO + ion, which were not observed in unexposed liver tissue samples (B). (C): The reconstructed ion overlay image (1000 × 1500 µm) of CeO2 agglomerates in red. White circles show areas, where predominantly CeO2 NM localize in the liver section.
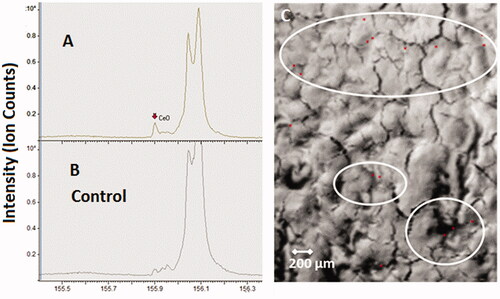
Figure 8. Relationship between lung and liver organ burden.
For the organ burden over time, the following assumption was made: if CeO2 NP accumulation is not affected by the amount in the organ and there is a steady clearance in the same incremental way, then organ accumulation should directly correlate with exposure and time. However, looking at the nonlinear curve shapes of the liver burden over all aerosol concentrations over 24 months, a different picture for the clearance is shown (). Dose Group #4 shows a hyperbolic curve shape which indicates either a reduced clearance or a higher accumulation rate up to 24 months. Thus, for this aerosol exposure concentration, the liver might be considered as a ‘dumping’ site. The smaller dose groups (#3 and #1) show a sigmoid curve shape instead of indicating an enhanced clearance over time. Thus, at these conditions the liver might be considered as deposit ().
Considering the organ burden of kidney and spleen it can be stated that these organ burdens are lower by an order of magnitude than that of the liver. Using the same approach as for the liver, a different picture can be shown for the organ burden of spleen (, Supplementary Table S7) and kidneys (, Supplementary Table S8) over time. For all aerosol exposure groups, the kidneys show hyperbolic curve shapes which indicate either a very slow removal from the kidneys or an increased transfer from the lung to the kidneys with associated higher accumulation rates in the kidneys. So the kidneys might be considered as ‘dumping’ site (). The spleen () on the other hand displays only for the highest aerosol exposure concentration this behavior. Dose Groups #1–#3 follow a linear trend (R2 = 0.96–0.99), which indicates a steady clearance in constant increments throughout the 24 months of exposure.
For brain (, Supplementary Table S9) and heart (, Supplementary Table S10), on the other hand, no significant changes in CeO2 organ burden compared to control levels were detected after 24 months of exposure. This holds also true for the Ce-concentrations measured in blood ().
CeO2 NPs in femur and bone marrow
In comparison to all other investigated extra-pulmonary organs, except the LALN (), ICP-MS results from the 2-year study showed relatively high amounts of Ce present in femur bones and bone marrow (, Supplementary Tables S13 and S14). Additionally, CeO2 concentrations for the given femur tissue were used to calculate the concentration for the whole skeleton of the rat. This calculation was based on the assumption of a homogenous distribution and a skeleton weight of 6% of the body weight of the rat (Travlos Citation2006). At the aerosol concentration of Group #4, a content of up to 44.9 µg/skeleton was calculated derived from the amount of Ce-ions measured by ICP-MS. Under these assumptions, around 1.1% of the lung burden (4412 µg/lung) would be retained in the skeleton (#4). In comparison, 1.2% of the lung burden was found in all investigated extra-pulmonary organs excluding lymph nodes and skeleton. ToF-SIMS imaging mass spectrometry was used to answer the question in which chemical entity Ce was present in the femur sections of exposed rats (#4). Via mass spectrometry, we could clearly identify and distinguish CeO+ ions and cerium phosphate ions from other ions like calcium phosphate ().
Figure 9. ToF-SIMS spectra from a bone tissue section of the femur exposed to 3.0 mg/m3 CeO2 NP at 24-month time point (250 × 250 µm). (A,B): CeO2 NP specific agglomerates represented by the CeO + ion, which were not observed in unexposed bone tissue samples. (C,D): The same tissue section analyzed for cerium phosphate ion (CePO4+), which was not observed in unexposed bone tissue samples. (E): The reconstructed ion overlay image (300 µm × 300 µm) of CeO2 agglomerates and cerium phosphate; green: CeO2 NM, red: CePO4+-signal. Green circles show areas, where predominantly CeO2 NM localize in/or near the bone marrow, whilst red circles indicate areas on the trabeculae, where cerium phosphate is concentrated.
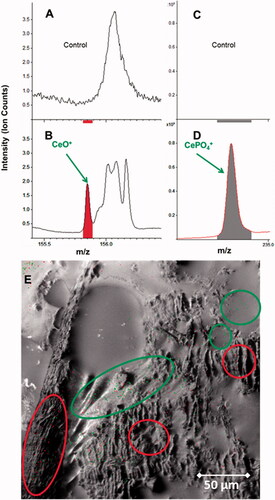
Particle agglomerates from CeO2 and cerium phosphate were located in distinctive areas of the femur bone tissue sections (), where both chemical entities form large sized agglomerates. Whilst cerium phosphate locates predominantly in the trabeculae of the spongy bone section (red circles, (), the CeO2 NP agglomerates locate close to the bone marrow (green circles, ). This indicates that the CeO2 NP might enter the bone through the bone marrow canals and afterward mineralize as cerium phosphate within areas where calcium phosphate is already present.
Discussion
The current knowledge gap with regards to potential adverse effects of PSLT particles under realistic exposure concentrations relevant for consumer and occupational health with focus on long-term exposure hampers the progress in risk assessment for airborne NP. The effects to the respiratory tract after inhalation of CeO2 NP has been investigated in a number of studies (Alapati et al. Citation2014; Demokritou et al. Citation2013; Gosens et al. Citation2014; Guo et al. Citation2019; Keller et al. Citation2014; Landsiedel et al. Citation2014) stating the onset of inflammatory reactions after CeO2 NP inhalation. Only a few of these studies used aerosol exposure concentrations as low as 0.1 mg/m3.
The main objective of the study was to address the organ burden, distribution, and localization of CeO2 NP after inhalation over a period of two years at extremely low aerosol exposure concentrations (0.1 mg/m3), whereby not only the CeO2 load on the respiratory tract, but also the organ burden on non-pulmonary key tissues were included.
Most studies which look at lung clearance tend to do this by considering the clearance after the end of exposure. In this study, the investigation of the lung clearance has been done by studying the lung burdens during exposure. This is subject to significantly greater uncertainties due to differences in accumulation and depletion over a very long time span. The rate of lung clearance might change during the exposure, for example when overload conditions are reached. Any derived clearance half-time is an effective value representing a combination of the potentially variable daily clearance rates. Also the effect of clearance half-time in EquationEquation (2)(2)
(2) means that a wide range of clearance half-times will provide a reasonable fit to the data.
The CeO2 NP aerosol exposure concentrations resulted in a linear increase in the measured lung burdens over 24 months in a dose group dependent manner. This is comparable to the 28-day or 90-day inhalation studies using CeO2 NM212 (Keller et al. Citation2015; Schwotzer et al. Citation2017). A summary of the lung burden results after 104 weeks of exposure to CeO2 (NM 212) NP compared with 1, 4, 13, and 52 weeks of exposure is given in . The lung burden findings for the 2-year chronic low-dose study are in good correlation with the results from the 13 and the 52 weeks study (Keller et al. Citation2015). Based on the 2-year study, starting with a lung burden value for 13 weeks of exposure, this value had doubled after 52 weeks, and quadrupled after 104 weeks of treatment at aerosol concentrations of 0.1 mg/m3 and 3.0 mg/m3 showing clearly its linearity. Taking the nose only inhalation study by Schwotzer et al. (Citation2017) into account it is noticeable that the lung burden values during the 13 weeks study resemble the same trend as the equivalent whole body exposure studies. In contrast to the 2-year study with BaSO4 (Molina et al. Citation2019), there was no plateau after 12 months. In this study, we found that the deposition rate was greater than the clearance rate over the entire study period. In general, it can be stated that studies applying other PSLT NM like TiO2 NP in in vivo studies with aerosol exposure concentrations at slightly higher dose range achieved comparable lung burden results (Bermudez et al. Citation2004).
Table 3. Summary of lung burdens of related studies.
Based on retention half-times of earlier studies with shorter duration times and a focus on CeO2 NP for dose Groups #1 and #2, the predicted mean clearance values in literature are slightly below the value of the effective particle clearance calculated for our study. For the highest dose Group (#4), where the calculated half time is exceeding the 200 day mark a distinct impairment is to be expected. A summary of the published retention half times based on measured and modeled data is given in .
Table 4. Comparison of post exposure retention half times depending on the exposure conditions.
As there are no post-exposure values for this 2-year study available, the retention half time prediction was calculated using EquationEquation (2)(2)
(2) and compared to the theoretical model by Pauluhn (Citation2017, Citation2018). Here, special attention was paid to the experimentally determined 12- and 24-month lung burden values. The progression of the curve for the cumulative volumetric lung burdens of CeO2 NP during 104 weeks shows a slightly steeper slope than the measured data indicate. This seems to be true for all dose groups. Based on these comparisons, lower retention half-times might be expected.
For all these predictions of overload and retention half-times, it has been hypothesized by Morrow that the volumetric volume of the alveolar macrophage is of central interest and in specific the particle density. He specified a particulate matter load of 60 μm3 per alveolar macrophage as critical value. This corresponds to 1 mg lung burden with a particle density of 1 g/cm3 (equals to 1 μL PM/g lung). It has been stated by DeLoid et al. (Citation2014) and Pauluhn (Citation2017, Citation2018) that special care has to be taken into account when selecting the density for inhaled NP like CeO2. Different values have been suggested in literature. Pauluhn (Citation2017, Citation2018) concluded, by using the cumulative volumetric lung load, applicable for micro-sized and agglomerated nanosized CeO2 alike, density values between 0.25 g/cm3 and 0.7 g/cm3. However, DeLoid et al. (Citation2014) determined density values between 1.5 and 2.4 g/cm3 by considering different specific surface areas of the particles or agglomerates.
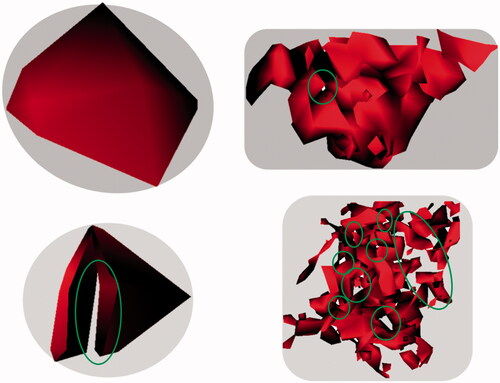
Ion-beam investigations of the CeO2 agglomerates, as well as mass spectrometry data derived from ToF-SIMS, which were detected in the lung after 24 month of exposure underpin these differences in density. Highly irregular-shaped structures with numerous smaller and bigger voids in between () were identified. Therefore, it may be important to consider that such agglomerates formed under physiological conditions in the body may vary highly not only in size and shape, but also in density. illustrates clearly that in particular the internal surface areas of such particles are of high complexity (indicated by green circles). In order to select the most appropriate method for overload calculations, the physico-chemical properties (e.g. density values) of the selected material under in vivo conditions should be taken into account to allow an accurate interpretation of the effects induced by NP deposition.
Figure 10. CeO2 NP agglomerates from lung tissue sections (reconstructed from ToF-SIMS using CeO2 mass spectrometry intensity information only; 50 × 50 µm; with 1.0 mg/m3 aerosol concentration at 24-month time point). The exemplary selected CeO2 agglomerates show holes in different numbers, sizes, and positions (indicated by green circles). Therefore, it is very likely that the real density of these agglomerates found in the lung tissue is highly variable.
In addition to the large variation of CeO2 NP in agglomerate structure (e.g. density), the agglomerate size of the NP varied in distribution. Larger agglomerates, localized in BALT areas throughout the lung tissue, are the dominant particle distribution pattern and very small agglomerates of CeO2 NP were found in the alveolar septum. As areas of highly concentrated NP in macrophages as well as in the alveolar septum were observed even at very low exposure concentrations, these high local accumulations of NP could trigger local inflammations.
The lung organ burden results, in combination with the localization and the detailed distribution patterns of the particles, may provide the foundation for a comparison with the predictions of new inhalation dosimetry modeling and may foster a refinement and further development of these models (Pauluhn Citation2017, Citation2018; Schwotzer et al. Citation2017).
In light of the mentioned dose-dependent pulmonary effects of CeO2, surprisingly little attention has been put on putative long-term effects in extra-pulmonary organs. Its relatively poor solubility (Cho et al. Citation2010; Geraets et al. Citation2012; He et al. Citation2010; Keller et al. Citation2014; Molina et al. Citation2014) stipulates that CeO2 NPs can persist in organ tissues over a long time. Therefore, it was crucial to determine distribution and putative accumulation. This pharmaco-dynamic process could possible lead to adverse effects in key organs like liver or bone after long-term exposure to CeO2 NPs. Moreover, the possibility of a dose-dependent toxicological effect of inhaled CeO2 NPs upon distribution from the lungs to extra-pulmonary organs cannot be excluded (Keller et al. Citation2014; Morrow Citation1988; Yokel, Hussain, et al. Citation2014; Yokel, Unrine, et al. Citation2014).
For the chronic low-dose study, the CeO2 burden could be determined in all major extra-pulmonary organs investigated, with the liver and the bones having the highest content. In liver and in the femur bone section, CeO2 agglomerates could be unequivocally identified by imaging spectroscopy techniques. Considering the skeleton approximation, this was followed by the CeO2 content found in bones and bone marrow. Additionally, cerium phosphate was identified in the bones. This indicates particle dissolution of CeO2 NPs and the formation of cerium-ions on the way from the lung to the bone or the formation of cerium-ions from particles directly in the bone. These processes lead to the formation of CePO4. Since cerium ions, similar to barium or strontium ions, are known in the literature as bone seekers (Soltani et al. Citation2018), these are important indications for the accumulation mechanism of cerium – either ionic and/or particulate form – in bone. Overall, one hypothesis could be that rats during their juvenile phase, when the skeleton and the organs are still remodeled and shaped to their final adult state, are incorporating a much higher number of NP in bone marrow than their adult counterparts.
Conclusion
An OECD TG 453 (OECD Citation2009) compliant low dose 2-year study using female Wistar rats conducted with OECD repository material NM-212 CeO2 under GLP conditions was carried out to provide insights into general principles of particle uptake, deposition, and potential accumulation in extra-pulmonary organs. The study results lay the ground for exemplary risk assessment for long-term effects of airborne NP of low solubility and toxicity in the future.
From a risk assessment point of view, these questions could not be answered by either focusing on short-term studies only or by the extrapolation of these studies alone. The scientific uncertainty on the mode of a threshold-like toxic action in the respiratory tract and the possibility of particle distribution to extra-pulmonary organs especially over longer time periods prevented so far a final evaluation.
Some clearance mechanisms of CeO2 depicted in the study are in line with mechanisms predicted for PSLT particles. However, the increasing lung burdens with exposure time up to two years without the indication of reaching a steady-state between 12 and 24 months of exposure may indicate similar incremental clearance over time at all exposure concentrations.
A comparison of the CeO2-agglomerate size and distribution patterns from different aerosol exposure concentrations of the 2-years study shows a concentration of very large agglomerates concentrated in BALT of the lung tissue sections next to very smaller agglomerate sizes in the alveolar septa.
For the chronic low-dose study, a significant cerium burden could be determined for all time points in all major non-pulmonary organs (liver, kidneys, spleen), with liver bearing the highest content followed by the skeleton. In liver, CeO2 agglomerates could be unequivocally identified. The same holds true for bone, where additionally cerium phosphate was identified. For all further investigated tissues negligible CeO2 burdens were determined.
Supplemental Material
Download Zip (391.4 KB)Acknowledgments
The authors express their gratitude for this financial support by the European Commission. The authors acknowledge the service of J. Schoon, G. Duda, and S. Geißler (Julius Wolff Institute and Berlin-Brandenburg Center for Regenerative Therapies, both Charité, Berlin, Germany) who provided cryosections of the bone samples. The authors also thank S. Stumpp (Julius Wolff Institute) and Thomas Fischer, Katrin Maul and Philipp Reichardt (all at BfR) for their unremitting excellent technical assistance.
Disclosure statement
The authors declare no potential conflicts of interest. The authors alone are responsible for the content and writing of the paper.
Correction Statement
This article has been corrected with minor changes. These changes do not impact the academic content of the article.
Additional information
Funding
Related Research Data
References
- AGS, German Committee on Hazardous Substances. 2015. “Assessment Criterion (Reference Value) for Granular Biopersistent Particles Without Known Significant Specific Toxicity (Nanoscaled GBP) (Respirable Dust) Generated From Manufactured Ultrafine Particles.” Accessed October 2019. http://www.baua.de/DE/Aufgaben/Geschaeftsfuehrung-von-Ausschuessen/AGS/pdf/Nanoscaled-GBP.pdf?__blob=publicationFile&v=2.
- Alapati, S., S. Ganapathy, S. Manapura, G. Anumolu, and B. M. Prakya. 2014. “Toxicity and Bio-Accumulation of Inhaled Cerium Oxide Nanoparticles in CD1 Mice.” Nanotoxicology 8 (7): 786–798. doi:10.3109/17435390.2013.829877.
- Baum, P., J. Kosacka, I. Estrela-Lopis, K. Woidt, H. Serke, S. Paeschke, M. Stockinger, et al. 2016. “The Role of Nerve Inflammation and Exogenous Iron Load in Experimental Peripheral Diabetic Neuropathy (PDN).” Metabolism 65 (4): 391–405. doi:10.1016/j.metabol.2015.11.002.
- Becker, H., F. Herzberg, A. Schulte, and M. Kolossa-Gehring. 2011. “The Carcinogenic Potential of Nanomaterials, Their Release from Products and Options for Regulating Them.” International Journal of Hygiene and Environmental Health 214 (3): 231–238. doi:10.1016/j.ijheh.2010.11.004.
- Bermudez, E., J. B. Mangum, B. A. Wong, B. Asgharian, P. M. Hext, D. B. Warheit, and J. I. Everitt. 2004. “Pulmonary Responses of Mice, Rats, and Hamsters to Subchronic Inhalation of Ultrafine Titanium Dioxide Particles.” Toxicological Sciences 77 (2): 347–357. doi:10.1093/toxsci/kfh019.
- Borm, P., F. R. Cassee, and G. Oberdorster. 2015. “Lung Particle Overload: Old School – New Insights?” Particle and Fibre Toxicology 12 (1): 1–5. doi:10.1186/s12989-015-0086-4.
- Buckley, A., J. Warren, A. Hodgson, T. Marczylo, K. Ignatyev, C. Guo, and R. Smith. 2017. “Slow Lung Clearance and Limited Translocation of Four Sizes of Inhaled Iridium Nanoparticles.” Particle and Fibre Toxicology 14 (1): 5–19. doi:10.1186/s12989-017-0185-5.
- Carmona, A., G. Deves, and R. Ortega. 2008. “Quantitative Micro-Analysis of Metal Ions in Subcellular Compartments of Cultured Dopaminergic Cells by Combination of Three Ion Beam Techniques.” Analytical and Bioanalytical Chemistry 390 (6): 1585–1594. doi:10.1007/s00216-008-1866-6.
- Cho, W. S., R. Duffin, C. A. Poland, S. E. M. Howie, W. MacNee, M. Bradley, I. L. Megson, and K. Donaldson. 2010. “Metal Oxide Nanoparticles Induce Unique Inflammatory Footprints in the Lung: Important Implications for Nanoparticle Testing.” Environmental Health Perspectives 118 (12): 1699–1706. doi:10.1289/ehp.1002201.
- Collins, R., B. Annangi, L. Rubio, R. Marcos, M. Dorn, C. Merker, I. Estrela-Lopis, M. R. Cimpan, M. Ibrahim, and E. Cimpan. 2017. “High Throughput Toxicity Screening and Intracellular Detection of Nanomaterials.” Wiley Interdisciplinary Reviews: Nanomedicine and Nanobiotechnology 9: e1413. doi:10.1002/wnan.1413.
- Cullen, R. T., C. L. Tran, D. Buchanan, J. M. Davis, K. Donaldson, A. D. Jones, and A. Searl. 1999. Relative Toxicological Potency of Dusts. Investigations into the Pulmonary Effects of Low Toxicity Dusts. Vol. 216. Health and Safety Executive Contract Research Report. Sudbury, UK: Health and Safety Executive. http://www.hse.gov.uk/research/crr_pdf/1999/crr99216a.pdf.
- Cullen, R. T., C. L. Tran, D. Buchanan, J. M. Davis, A. Searl, A. D. Jones, and K. Donaldson. 2000. “Inhalation of Poorly Soluble Particles. I. Differences in Inflammatory Response and Clearance During Exposure.” Inhalation Toxicology 12: 1089–1111. doi:10.1080/08958370050166787.
- Dankovic, D., E. Kuempel, and M. Wheeler. 2007. “An Approach to Risk Assessment for TiO2.” Inhalation Toxicology 19 (Supp1): 205–212. doi:10.1080/08958370701497754.
- DeLoid, G., J. M. Cohen, T. Darrah, R. Derk, L. Rojanasakul, G. Pyrgiotakis, W. Wohleben, and P. Demokritou. 2014. “Estimating the Effective Density of Engineered Nanomaterials for In Vitro Dosimetry.” Nature Communications 5: 3514–3523. doi:10.1038/ncomms4514.
- Demokritou, P., S. Gass, G. Pyrgiotakis, J. M. Cohen, W. Goldsmith, W. McKinney, D. Frazer, et al. 2013. “An In Vivo and In Vitro Toxicological Characterisation of Realistic Nanoscale CeO(2) Inhalation Exposures.” Nanotoxicology 7: 1338–1350. doi:10.3109/17435390.2012.739665.
- Geraets, L., A. G. Oomen, J. D. Schroeter, V. A. Coleman, and F. R. Cassee. 2012. “Tissue Distribution of Inhaled Micro- and Nano-Sized Cerium Oxide Particles in Rats: Results from a 28-Day Exposure Study.” Toxicological Sciences 127 (2): 463–473. doi:10.1093/toxsci/kfs113.
- Gosens, I., L. E. Mathijssen, B. G. H. Bokkers, H. Muijser, and F. R. Cassee. 2014. “Comparative Hazard Identification of Nano- and Micro-Sized Cerium Oxide Particles Based on 28-Day Inhalation Studies in Rats.” Nanotoxicology 8 (6): 643–653. doi:10.3109/17435390.2013.815814.
- Govil, I. M. 2001. “Proton Induced X-Ray Emission – A Tool for Non-Destructive Trace Element Analysis.” Current Science (Bangalore) 80: 1542–1549.
- Grubbs, F. E. 1950. “Sample Criteria for Testing Outlying Observations.” The Annals of Mathematical Statistics 21 (1): 27–58. doi:10.1214/aoms/1177729885.
- Guo, C., S. Robertson, R. Weber, A. Buckley, J. Warren, A. Hodgson, J. Rappoport, et al. 2019. “Pulmonary Toxicity of Inhaled Nano-Sized Cerium Oxide Aerosols in Sprague–Dawley Rats.” Nanotoxicology 13 (6): 733–750. doi:10.1080/17435390.2018.1554751.
- He, X. A., H. F. Zhang, Y. H. Ma, W. Bai, Z. Y. Zhang, K. Lu, Y. Y. Ding, Y. L. Zhao, and Z. F. Chai. 2010. “Lung Deposition and Extrapulmonary Translocation of Nano-Ceria after Intratracheal Instillation.” Nanotechnology 21 (28): 285103. doi:10.1088/0957-4484/21/28/285103.
- Heinrich, U., D. L. Dungworth, F. Pott, L. Peters, C. Dasenbrock, K. Levsen, W. Koch, O. Creutzenberg, and A. Schulte. 1994. “The Carcinogenic Effects of Carbon Black Particles and Tar-Pitch Condensation Aerosol after Inhalation Exposure of Rats.” The Annals of Occupational Hygiene 38: 351–356. doi:10.1093/annhyg/38.inhaled_particles_VII.351.
- Heinrich, U., R. Fuhst, S. Rittinghausen, O. Creutzenberg, B. Bellmann, W. Koch, and K. Levsen. 1995. “Chronic Inhalation Exposure of Wistar Rats and 2 Different Strains of Mice to Diesel-Engine Exhaust, Carbon-Black, and Titanium-Dioxide.” Inhalation Toxicology 7 (4): 533–556. doi:10.3109/08958379509015211.
- Jungnickel, H., R. Pund, J. Tentschert, P. Reichardt, P. Laux, H. Harbach, and A. Luch. 2016. “Time-of-Flight Secondary Ion Mass Spectromety (ToF-SIMS)-Based Analysis and Imaging of Polyethylene Microplastics Formation during Sea Surf Simulation.” Science of the Total Environment 563–564: 261–266. doi:10.1016/j.scitotenv.2016.04.025.
- Keller, J. 2015. Biokinetics and Inhalation Toxicity of Cerium Dioxide and Barium Sulfate Nanoparticles After 1, 4, 13 and 52 Weeks of Exposure. Leipzig: Institut für Veterinär-Pathologie. Accessed May 2019. https://d-nb.info/1078849315/34.
- Keller, J., L. Ma-Hock, K. Kuettler, V. Strauss, S. Groters, K. Wiench, W. Wohlleben, B. van Ravenzwaay, and R. Landsiedel. 2015. “Biokinetics and Inhalation Toxicity of nano-BaSO4 after 1, 4, 13 and 52 Weeks of Exposure.” Toxicology Letters 238 (2): S212. doi:10.1016/j.toxlet.2015.08.630.
- Keller, J., W. Wohlleben, L. Ma-Hock, V. Strauss, S. Groters, K. Kuttler, K. Wiench, et al. 2014. “Time Course of Lung Retention and Toxicity of Inhaled Particles: Short-Term Exposure to Nano-Ceria.” Archives of Toxicology 88 (11): 2033–2059. doi:10.1007/s00204-014-1349-9.
- Kittel, B., C. Ruehl-Fehlert, G. Morawietz, J. Klapwijk, M. R. Elwell, B. Lenz, M. G. O’Sullivan, D. R. Roth, and P. F. Wadsworth. 2004. “Revised Guides for Organ Sampling and Trimming in Rats and Mice – Part 2. A Joint Publication of the RITA and NACAD Groups.” Experimental and Toxicologic Pathology 55 (6): 413–431. doi:10.1078/0940-2993-00349.
- Konduru, N., J. Keller, L. Ma-Hock, S. Gröters, R. Landsiedel, T. C. Donaghey, J. D. Brain, W. Wohlleben, and R. M. Molina. 2014. “Biokinetics and Effects of Barium Sulfate Nanoparticles.” Particle and Fibre Toxicology 11 (1): 55–69. doi:10.1186/s12989-014-0055-3.
- Landsiedel, R., L. Ma-Hock, T. Hofmann, M. Wiemann, V. Strauss, S. Treumann, W. Wohlleben, S. Gröters, K. Wiench, and B. van Ravenzwaay. 2014. “Application of Short-Term Inhalation Studies to Assess the Inhalation Toxicity of Nanomaterials.” Particle and Fibre Toxicology 11 (1): 16. doi:10.1186/1743-8977-11-16.
- Lee, K. P., N. W. Henry, H. J. Trochimowicz, and C. F. Reinhardt. 1986. “Pulmonary Response to Impaired Lung Clearance in Rats Following Excessive Tio2 Dust Deposition.” Environmental Research 41 (1): 144–167. doi:10.1016/S0013-9351(86)80177-3.
- Lichtenstein, D., T. Meyer, L. Böhmert, S. Juling, C. Fahrenson, S. Selve, A. Thünemann, et al. 2017. “Dosimetric Quantification of Coating-Related Uptake of Silver Nanoparticles.” Langmuir 33 (45): 13087–13097. doi:10.1021/acs.langmuir.7b01851.
- Llop, J., I. Estrela-Lopis, R. F. Ziolo, A. Gonzalez, J. Fleddermann, M. Dorn, V. G. Vallejo, et al. 2014. “Uptake, Biological Fate, and Toxicity of Metal Oxide Nanoparticles Part.” Particle & Particle Systems Characterization 31 (1): 24–35. doi:10.1002/ppsc.201300323.
- Ma-Hock, L., A. Gamer, R. Landsiedel, E. Leibold, T. Frechen, B. Sens, G. Huber, and B. van Ravenzwaay. 2007. “Generation and Characterization of Test Atmospheres with Nanomaterials.” Inhalation Toxicology 19 (10): 833–848. doi:10.1080/08958370701479190.
- Mauderly, J. L., M. B. Snipes, E. B. Barr, S. A. Belinsky, J. A. Bond, A. L. Brooks, I. Y. Chang, et al. 1994. “Pulmonary Toxicity of Inhaled Diesel Exhaust and Carbon Black in Chronically Exposed Rats. I. Neoplastic and Nonneoplastic Lung Lesions.” Research Reports Health Effects Institute no. 68 Pt 1: 1–75. Discussion 77–97.
- Meyer, T., T. Venus, H. Sieg, L. Böhmert, B. Kunz, B. Krause, P. Jalili, et al. 2019. “Simultaneous Quantification and Visualization of Titanium Dioxide Nanomaterial Uptake at the Single Cell Level in an In Vitro Model of the Human Small Intestine.” Small Methods 3 (5): 1800540. doi:10.1002/smtd.201800540.
- Molina, R. M., N. V. Konduru, R. J. Jimenez, G. Pyrgiotakis, P. Demokritou, W. Wohlleben, and J. D. Brain. 2014. “Bioavailability, Distribution and Clearance of Tracheally Instilled, Gavaged or Injected Cerium Dioxide Nanoparticles and Ionic Cerium.” Environmental Science – Nano 1 (6): 561–573. doi:10.1039/C4EN00034J.
- Molina, R. M., N. V. Konduru, P. M. Queiroz, B. Figueroa, D. Fu, L. Ma-Hock, S. Groeters, D. Schaudien, and J. D. Brain. 2019. “Fate of Barium Sulfate Nanoparticles Deposited in the Lungs of Rats.” Scientific Reports 9 (1): 8163. doi:10.1038/s41598-019-44551-2.
- Morawietz, G., C. Ruehl-Fehlert, B. Kittel, A. Bube, K. Keane, S. Halm, A. Heuser, and J. Hellmann. 2004. “Revised Guides for Organ Sampling and Trimming in Rats and Mice – Part 3. A Joint Publication of the RITA and NACAD Groups.” Experimental and Toxicologic Pathology 55 (6): 433–449. doi:10.1078/0940-2993-00350.
- Morrow, P. E. 1988. “Possible Mechanisms to Explain Dust Overloading of the Lungs.” Toxicological Sciences 10 (3): 369–384. doi:10.1093/toxsci/10.3.369.
- Morrow, P. E. 1992. “Dust Overloading of the Lungs – Update and Appraisal.” Toxicology and Applied Pharmacology 113 (1): 1–12. doi:10.1016/0041-008X(92)90002-A.
- Multiple path particle dosimetry (MPPD). 2019. Multiple path particle dosimetry (MPPD) model version 3.04. Accessed October 2019. http://www.ara.com/products/multiple-path-particle-dosimetry-model-mppd-v-304.
- Nikula, K. J., M. B. Snipes, E. B. Barr, W. C. Griffith, R. F. Henderson, and J. L. Mauderly. 1995. “Comparative Pulmonary Toxicities and Carcinogenicities of Chronically Inhaled Diesel Exhaust and Carbon Black in F344 Rats.” Toxicological Sciences 25 (1): 80–94. doi:10.1093/toxsci/25.1.80.
- Oberdorster, G. 2002. “Toxicokinetics and Effects of Fibrous and Nonfibrous Particles.” Inhalation Toxicology 14: 29–56.
- Oberdorster, G., J. Ferin, R. Gelein, S. C. Soderholm, and J. Finkelstein. 1992. “Role of the Alveolar Macrophage in Lung Injury – Studies with Ultrafine Particles.” Environmental Health Perspectives 97: 193–199. doi:10.2307/3431353.
- OECD. 2007. OECD’s Working Party on Manufactured Nanomaterials (WPMN). Sponsorship Programme for the Testing of Manufactured Nanomaterials (Testing Programme). Accessed October 2019. http://www.oecd.org/chemicalsafety/nanosafety/testing-programme-manufactured-nanomaterials.htm.
- OECD. 2009. Test No. 453: Combined Chronic Toxicity/Carcinogenicity Studies. Journal [Online] Accessed October 2019. http://www.oecd.org/env/test-no-453-combined-chronic-toxicity-carcinogenicity-studies-9789264071223-en.htm.
- Office of Environmental Health Hazard Assessment California Environmental Protection Agency. 2018. Calculation of rat breathing rate based on bodyweight. Accessed October 2019. http://oehha.ca.gov/media/downloads/crnr/calcuratbreathingrate092818.pdf.
- Pauluhn, J. 2017. “Kinetic Modeling of the Retention and Fate of Inhaled Cerium Oxide Nanoparticles in Rats: The Cumulative Displacement Volume of Agglomerates Determines the Outcome.” Regulatory Toxicology and Pharmacology 86: 319–331. doi:10.1016/j.yrtph.2017.03.023.
- Pauluhn, J. 2018. “Fate of Inhaled Nano-CeO2 Revisited: Predicting the Unpredictable.” Regulatory Toxicology and Pharmacology 97: 63–70. doi:10.1016/j.yrtph.2018.06.005.
- Reference Material BCR 667. 2001. Estuarine sediment. Geel, Belgium: European Commission, JRC-Institute for Reference Materials and Methods. http://irmm.jrc.ec.europa.eu/html/reference_materials_catalogue/catalogue/attachements/BCR-667_report.pdf.
- Roller, M., and F. Pott. 2006. “Lung Tumor Risk Estimates from Rat Studies with Not Specifically Toxic Granular Dusts.” Annals of the New York Academy of Sciences 1076: 266–280. doi:10.1196/annals.1371.064.
- Ruehl-Fehlert, C., B. Kittel, G. Morawietz, P. Deslex, C. Keenan, C. R. Mahrt, T. Nolte, M. Robinson, B. P. Stuart, and U. Deschl. 2003. “Revised Guides for Organ Sampling and Trimming in Rats and Mice – Part 1.” Experimental and Toxicologic Pathology 55 (2–3): 91–106. doi:10.1078/0940-2993-00311.
- Schwotzer, D., H. Ernst, D. Schaudien, H. Kock, G. Pohlmann, C. Dasenbrock, and O. Creutzenberg. 2017. “Effects from a 90-Day Inhalation Toxicity Study with Cerium Oxide and Barium Sulfate Nanoparticles in Rats.” Particle and Fibre Toxicology 14 (1): 23–42. doi:10.1186/s12989-017-0204-6.
- Singh, C., S. Friedrichs, G. Ceccone, N. Gibson, K. A. Jensen, M. Levin, H. Goenaga Infante, D. Calander, and K. Rasmussen. 2014. Cerium Dioxide NM-211, NM-212, NM-213, Characterisation and Test Item Preparation: JRC Repository: NM-Series of Representative Manufactured Nanomaterials. Luxembourg: Publications Office of the European Union.
- Snipes, M. B., E. B. Barr, I. Y. Chang, R. F. Henderson, K. J. Nikula, and J. L. Mauderly. 1993. “Particle Clearance and Distribution Patterns in Rat Lungs as Influenced by Chronic Inhalation of Diesel Exhaust or Carbon-Black.” American Review of Respiratory Disease 147 (4): A388–A388.
- Soltani, F., A. S. Shirvani, M. Sadeghi, S. Heidari, S. A. Bahrami, and K. Yavari. 2018. “Production, Quality Control, and Biodistribution Studies of 141Ce-EDTMP as a Potential Bone Pain Palliation Agent.” Iranian Journal of Pharmacology and Therapeutics 16: 1–7.
- Travlos, G. S. 2006. “Normal Structure, Function, and Histology of the Bone Marrow.” Toxicologic Pathology 34 (5): 548–565. doi:10.1080/01926230600939856.
- Veith, L., J. Böttner, A. Vennemann, D. Breitenstein, C. Engelhard, J. Meijer, I. Estrela-Lopis, M. Wiemann, and B. Hagenhoff. 2018. “Detection of ZrO2 Nanoparticles in Lung Tissue Sections by Time-of-Flight Secondary Ion Mass Spectrometry and Ion Beam Microscopy.” Nanomaterials 2018 8 (1): 44–58. doi:10.3390/nano8010044.
- Wohlleben, W., L. Ma-Hock, V. Boyko, G. Cox, H. Egenolf, H. Freiberger, B. Hinrichsen, S. Hirth, and R. Lancisiedel. 2013. “Nanospecific Guidance in REACH: A Comparative Physical-Chemical Characterization of 15 Materials with Methodical Correlations.” Journal of Ceramic Science and Technology 4: 93–104.
- Yokel, R. A., S. Hussain, S. Garantziotis, P. Demokritou, V. Castranova, and F. R. Cassee. 2014. “The Yin: An Adverse Health Perspective of Nanoceria: Uptake, Distribution, Accumulation, and Mechanisms of Its Toxicity.” Environmental Science – Nano 1 (5): 406–428. doi:10.1039/C4EN00039K.
- Yokel, R. A., J. M. Unrine, P. Wu, B. H. Wang, and E. A. Grulke. 2014. “Nanoceria Biodistribution and Retention in the Rat after Its Intravenous Administration Are Not Greatly Influenced by Dosing Schedule, Dose, or Particle Shape.” Environmental Science – Nano 1 (6): 549–560. doi:10.1039/C4EN00035H.
- Zhou, X. Y., M. Dorn, J. Vogt, D. Spemann, W. Yu, Z. W. Mao, I. Estrela-Lopis, E. Donath, and C. Y. Ga. 2014. “A Quantitative Study of the Intracellular Concentration of Graphene/Noble Metal Nanoparticle Composites and Their Cytotoxicity.” Nanoscale 6 (15): 8535–8542. doi:10.1039/C4NR01763C.