
Abstract
Surface modification by different quaternary ammonium compounds (QAC) makes nanoclays more compatible with various polymeric matrices, thereby expanding their potential applications. The growing industrial use of nanoclays could potentially pose a health risk for workers. Here, we assessed how surface modification of nanoclays modulates their pulmonary toxicity. An in vitro screening of the unmodified nanoclay Bentonite (montmorillonite) and four organomodified nanoclays (ONC); coated with various QAC, including benzalkonium chloride (BAC), guided the selection of the materials for the in vivo study. Mice were exposed via a single intratracheal instillation to 18, 54, and 162 µg of unmodified Bentonite or dialkyldimethyl-ammonium-coated ONC (NanofilSE3000), or to 6, 18, and 54 µg of a BAC-coated ONC (Nanofil9), and followed for one, 3, or 28 days. All materials induced dose- and time-dependent responses in the exposed mice. However, all doses of Bentonite induced larger, but reversible, inflammation (BAL neutrophils) and acute phase response (Saa3 gene expression in lung) than the two ONC. Similarly, highest levels of DNA strand breaks were found in BAL cells of mice exposed to Bentonite 1 day post-exposure. A significant increase of DNA strand breaks was detected also for NanofilSE3000, 3 days post-exposure. Only mice exposed to Bentonite showed increased Tgf-β gene expression in lung, biomarker of pro-fibrotic processes and hepatic extravasation, 3 days post-exposure. This study indicates that Bentonite treatment with some QAC changes main physical-chemical properties, including shape and surface area, and may decrease their pulmonary toxicity in exposed mice.
Introduction
Clay minerals have long been used in composite materials to improve physical and mechanical properties (Patel et al. Citation2006). Bentonite is the commercial name of montmorillonite, a member of the Smectite clay family (swelling clays), and contains an octahedral alumina or magnesia sheet between two tetrahedral silica sheets (Jensen et al. Citation2009). Its chemical functionalization is obtained by substituting the interlayer cations with surface modifiers such as quaternary ammonium compounds (QAC), including benzalkonium chloride (BAC), which generate organomodified clays (ONC). These are amphiphilic and facilitate dispersion of ONC into the composite polymer materials (Carretero, Gomes, and Tateo Citation2006; Jensen et al. Citation2009; Stueckle et al. Citation2018).
Bentonite and ONC are stacked platelet flakes, which are only 1 nm thick and may be 200–400 nm wide in two dimensions. The size and shape of these platelets classify them together with, e.g., nanotubes and graphene, as high aspect ratio nanomaterials (HARN), hence presenting a unique structure and toxicology (Donaldson et al. Citation2011). When inhaled, HARN deposit in all regions of the respiratory tract and induce inflammation and oxidative stress, which could potentially lead to pulmonary and cardiovascular diseases (Møller et al. Citation2014).
The large library of QAC has considerably expanded the applications of ONC in sectors like construction, food packaging, and formulation of drugs for controlled release of therapeutics (Patel et al. Citation2006). Consequently, 25 000–51 000 tons of nanoclays, including Bentonite and ONC, are used each year globally, with production volumes foreseen to increase (Connolly et al. Citation2019). This may result in higher exposure to workers and consumers. However, large exposure to air-borne Bentonite and ONC is likely to occur only in the working environment. In previous occupational exposure studies, air concentrations of 5.2–39.2 mg/m3 have been measured during the production of ONC (Huang et al. Citation2013; Stueckle et al. Citation2018), which includes pulverization and packaging activities. Excessive occupational exposures to nanoclays have been linked to pneumoconiosis, pneumonia, chronic obstructive pulmonary disease, and allergic rhinitis in workers, as well as in private residents living nearby clay mining activities (Phibbs, Sundin, and Mitchell Citation1971; Adamis and Williams Citation1985; Carretero, Gomes, and Tateo Citation2006; Maxim, Niebo, and McConnell Citation2016). In addition, Huang and colleagues showed increased levels of DNA strand breaks and micronucleus frequency in blood cells in workers from factories that produce Bentonite (Huang et al. Citation2013). A recent review of engineered nanomaterials (ENM) defined nanoclays as ENM with a clear potential for occupational exposure, but with limited toxicological effect data to assess occupational risks (Maisanaba et al. Citation2015). Therefore, to develop nanocomposite materials that are safe-by-design, it is of profound importance to elucidate the adverse health effects caused by pulmonary exposure to Bentonite and ONC. A recent inhalation study in mice showed ONC to induce lesser pulmonary inflammation and granuloma formation than the pristine montmorillonite (Stueckle et al. Citation2018). However, only one ONC was assessed in that study. As a large number of QAC is available, it remains a challenge to assess the toxicity of nanoclays and elucidate what drives their toxicity, as different coatings may require a case-by-case approach (Maisanaba et al. Citation2015). It has been suggested that, in some cases, the coating of the ONC may cause the toxicity (Janer et al. Citation2014). Notably, BAC, which is used as biocide, induced inflammation in the lungs of rats after inhalation (Świercz et al. Citation2008, Citation2013; Choi et al. Citation2020), which raises concerns about the safety of BAC-coated ONC.
The objective of the present study was to evaluate how an organic surface modification of Bentonite clay modulates the toxic response in the murine lung. Prior to exposing mice, we assessed in vitro the cytotoxicity of four different ONC, as well as pure QAC, using mouse alveolar epithelial cells (FE1-MML), and compared these to unmodified Bentonite and carbon black. The preliminary in vitro screening and the physico-chemical characterization guided the selection of the ONC to be tested in mice. Mice were then exposed by single intratracheal instillation to two ONC and Bentonite. We have worked intensely on characterizing the carbon black material (Jacobsen et al. Citation2008; Høgsberg et al. Citation2013; Jacobsen and Clausen Citation2015) as well as the toxicity it causes. Carbon black has a high inflammogenicity and production of reactive oxygen species (ROS), leading to damage to the DNA and mutations (Jacobsen et al. Citation2007; Jacobsen et al. Citation2011). Here carbon black was included as benchmark material to allow comparisons with previously assessed materials (Bourdon et al. Citation2012; Saber et al. Citation2012; Poulsen, et al. Citation2013; Kyjovska et al. Citation2015; Modrzynska et al. Citation2018; Bendtsen et al. Citation2019; Hadrup et al. Citation2019, Citation2020; Danielsen et al. Citation2020). Inflammation, acute phase response, pro-fibrotic effects, local and systemic DNA damage, and liver morphology were analyzed 1, 3, and 28 days post-exposure.
Materials and methods
Particles and chemicals
Four organomodified nanoclays; Nanofil®5, Nanofil®8, Nanofil®9, Nanofil®SE3000 were supplied from Süd-Chemie AG, Moosburg, Germany. Nanofil8 and Nanofil9 have since purchase been renamed by the manufacturer to Cloisite 15 A and Cloisite 10 A, respectively, but the chemical compositions remained unchanged. According to the manufacturer, the surface modification on Nanofil9 (33% w/w) consists almost entirely of BAC (94%) of varying chain length. The QAC starting batch is identical for Nanofil5, Nanofil8, and NanofilSE3000; however the quantity, production method, and post treatment vary. The ONC were selected as representative on-market product line used for, e.g., modification of polymeric products. Carbon black Printex 90 was donated by Evonik Degussa (Frankfurt, Germany) and Bentonite was from the same batch of materials as used in the European dustiness standard EN15051. Bentonite consists of 100% natural montmorillonite clay and is the starting material for the production of the four ONC. Relevant characteristics of the tested materials as provided by manufactures are reported in . To assess the cytotoxicity of QAC, we included a number of chemicals in the in vitro toxicity test. All materials with systematic name, product number, and description of chain number and length are listed in .
Table 1. The table lists some important characteristics of the four organomodified nanoclays, Bentonite and carbon black.
Table 2. List of pure the QAC that were obtained with number and length of the long alkyl chain listed.
Characterization of particles
Characterization of carbon black (Jacobsen et al. Citation2007, 2008, Citation2011) and the Bentonite (Jensen et al. Citation2009) used in this study have previously been published. Furthermore, full thermo-gravimetric analysis (TGA) of the four ONC is available (Clausen et al. Citation2019).
The Brunauer, Emmett, and Teller (BET) surface area was determined by the multi-point method (Brunauer, Emmett, and Teller Citation1938). The analyses were conducted on a QUANTACHROME AUTOSORB-3 using N2 at 77 Kelvin (QUANTACHROME GmbH & Co. KG Odelzhausen, Germany). All samples were pretreated under high vacuum. Nanofil5, Nanofil8, and NanofilSE3000 were kept for 2 h at 180 °C, whereas Nanofil9 and Bentonite were kept at 160 °C for 2 h, before measurements.
Scanning electron microscopy (SEM) was performed on a Zeiss Ultra 55 equipped with a field emission electron source. High vacuum conditions were applied and a secondary electron detector was used for image acquisition. The raw samples (untouched samples) were prepared on a carbon tape surface before imaging. Ten μl of each particle sample, sonicated in cell media or Hank’s Balanced Salt Solution (HBSS; 100 μg/ml and 800 μg/ml), were placed on a holey carbon-coated copper grid. All samples were coated with a conductive layer of Au of 10–20 nm thickness before imaging.
To estimate the released amount and composition of QAC from the ONC during preparations for biological exposures, suspensions of 9 μg/ml of the four ONC and Bentonite were prepared by sonication in deionized water. After centrifugation the supernatant was analyzed for content of QAC by high performance liquid chromatography-mass spectrometry (LC-MS). These analyses were performed in a vehicle (water) simulating cell exposure conditions but not in actual cell media, as the high protein and salt concentrations caused analytical difficulties.
In vitro
Particles dispersion
Carbon black, Bentonite, or ONC were dispersed in Dulbecco’s Modified Eagle’s Medium (DMEM) cell culture medium by probe sonication using a Branson Sonifier S-450D (Branson Ultrasonics Corp., Danbury, CT, USA) equipped with a disruptor horn (Model number: 101-147-037). Six to seven mlligrams of dry carbon black, Bentonite, or ONC were sonicated for 3 × 8 min in a 10 ml glass beaker. Before each of the first two sonication steps, 2 ml of cell medium was added. Before the third and final sonication, cell medium was added to a final particle concentration of 800 μg/ml. Samples were continuously cooled on ice during the sonication procedure. The hydrodynamic particle number and volume distribution of the particles in the exposure liquids were analyzed by photon correlation spectroscopy using a Dynamic laser scattering DLS Zetasizer nano ZS (Malvern Inc., Malvern, UK) as previously described (Jacobsen et al. Citation2008). For Bentonite and the four ONC the refractive index was set at 2.54 and the absorption to 0.3. For carbon black the refractive index was set at 2.02 and the absorption to 2.0.
ROS production
The levels of ROS generated by the ONC, Bentonite, and carbon black were determined using both the cellular and the acellular versions of the 2′,7′ dichlorodihydrofluorescein diacetate (DCFH2-DA) assay. The protocols have been described in details elsewhere (Jacobsen et al. Citation2008; Høgsberg et al. Citation2013).
FE1 Muta™Mouse lung epithelial cell line
FE1-MML, a spontaneously immortalized murine pulmonary epithelial cell line established from the lung of the transgenic Muta™Mouse (White et al. Citation2003) was used for the in vitro tests. The generation as well as the description of cell type and response to various toxic exposures have previously been thoroughly described. Briefly, the cell line shows similarities to both type I and II. It has a high level of gene expression similarity to both primary epithelium culture and whole lung (White et al. Citation2003; Berndt-Weis et al. Citation2009). The cells were cultured and maintained as previously described (Jacobsen et al. Citation2008; Bengtson et al. Citation2016). The cell culture medium was DMEM F12 (1:1) +l-glutamine (Invitrogen, Carlsbad, CA, #11320-033) supplemented with 2% v/v heat inactivated fetal bovine serum (FBS; Gibco, Carlsbad, CA, #10106-169), 100 U/ml Penicillin G, 100 µg/ml streptomycin (Gibco, Carlsbad, CA, #15140-122), 2 mM l-glutamine (Merck, Darmstadt, Germany, K21843389), and 1 ng/ml murine epidermal growth factor (Roche, Hvidovre, Denmark, #855-731).
Viability
Viability was assessed in FE1-MML cells in two separate experiments each including two replicates (½, 1, 4, and 24 h) and in one experiment of two replicates (48 h). One hundred thousand cells in 1 ml medium were seeded in each well of a Nunc 24 well-plate (Biotech Line, Slangerup, Denmark). Viability and cell proliferation were determined by performing a live/dead count of exposed and control cells using a NucleoCounter NC-100 (ChemoMetec A/S, Allerød, Denmark). The cells were incubated with either 0, 50, 100, 200, or 400 µg/ml of carbon black, Bentonite, Nanofil5, Nanofil8, and NanofilSE3000 or with 0, 12.5, 25, 50, 100, 200, and 400 µg/ml for Nanofil9. The additional concentrations for Nanofil9 (12.5 and 25 µg/ml) were chosen since it was highly cytotoxic in pilot tests. All pure QAC products listed above (‘Particles and Chemicals’ section) were tested at 0, 6.25, 12.5, 25, 50, and 100 µg/ml in two separate experiments each containing two replicates.
To test the effect of the QAC released into cell medium from the clay surface, materials were sonicated and prepared as described above. The final particle suspensions (800 µg/ml) were then centrifuged (4500 g, 4 °C, 30 min) and divided into sediment and supernatant. The sediment was re-suspended in cell medium to the same concentration (800 µg/ml) and sonicated for 3 × 8 min, with alternating 10 s pulses and 10 s pauses at amplitude of 10%. The supernatant was used as such, representing the release from 800 µg/ml sonicated material, and was diluted 2× to obtain 5 diluted concentrations. The final concentrations of both sediment and supernatant were 0, 50, 100, 200, and 400 µg/ml. The viability of FE1-MML cells exposed to sediment and supernatant was tested in two separate experiments each containing two replicates (24 h). One hundred thousand cells in 1 ml medium were seeded in each well of a Nunc 24 well-plate (Biotech Line, Slangerup, Denmark).
In vivo
Animals
Female C57BL/6 mice 5–7 weeks old were purchased from Taconic (Ry, Denmark). Grouping of the animals and housing conditions have been described previously (Saber et al. Citation2012). All mice were exposed to nanomaterials at 8 weeks of age. The study complied with the EC Directive 86/609/EEC on the use of animals for experiments and they were approved by the Danish ‘Animal Experiments Inspectorate’ under the Ministry of Justice (permission 2010/561-1779) and by the local ethical committee for animal research.
Particles suspension
The particles were suspended in 0.9% NaCl MilliQ water containing 10% v/v acellular BAL fluid, generated by flushing unexposed C57BL/6 mice twice with 0.6 ml 0.9% NaCl, yielding approximately 1 ml of BAL fluid per mouse. Cells were removed from the BAL fluid by centrifugation at 400 g (10 min, 4 °C). The stock samples of particles (4.05 mg/ml) were sonicated with a Branson Sonifier S-450D, (Branson Ultrasonics Corp., Danbury, CT, USA) equipped with a disruptor horn (Model number: 101-147-037), for 16 min, with alternating 10 s pulses and 10 s pauses at amplitude of 10% (total sonication time was 8 min). Samples were kept on ice during the sonication.
Study design and exposure
Based on the in vitro cytotoxicity, material surface area, surface modification, and appearance in SEM images, Nanofil9 and NanofilSE3000 were selected for the intratracheal instillation of ONC. The mice were exposed to 18, 54, and 162 μg of NanofilSE3000, Bentonite and carbon black, or 6, 18, and 54 μg of Nanofil9. The doses were selected to be similar to doses used in previous experiments, including studies on carbon black, which makes it possible to compare the potency of the test materials to previously examined samples. The lower exposure doses used for Nanofil9 were selected due to its high cytotoxicity in the in vitro tests. Mice (n = 6 per dose group) were exposed by intratracheal instillation to 40 µl of sonicated particles suspensions as previously described (Jackson et al. Citation2011; Saber et al. Citation2012). The results for the vehicle controls instilled with 40 µl sonicated vehicle (10% BAL in saline) were pooled in the statistical analysis (n = 22). Carbon black was included as benchmark material in this and a previously published study (Saber et al. Citation2012). Each test material (including vehicle controls) was prepared and instilled on the same day. The dose levels (18, 54, and 162 μg) correspond to the estimated pulmonary deposition during 1, 3, and 9 working days at the Danish occupational exposure to carbon black, assuming that 34.8% of the inhaled mass deposits in the pulmonary region (Jackson et al. Citation2012), air inhalation at 1.8 l/h in mice, and 8 hour working days, while ignoring pulmonary clearance.
Preparation of cells and tissue from the mice
One, 3, or 28 days after intratracheal instillation, the mice were anesthetized with Hypnorm/Dormicum and euthanized. The mice lungs were flushed four times with 0.8 mL of 0.9% sterile saline through the trachea. BAL fluid was kept on ice and the samples were centrifuged at 400xg at 4 °C for 10 min to recover cells, which were resuspended in 100 µL HAM-F12 medium (Prod no. 21765037) containing 10% FBS. Forty microliters of the BAL fluid was mixed with 160 μl of cell medium containing 10% DMSO and stored at −80 °C for analysis in the comet assay. A piece of liver tissue per mice was frozen in cryotubes (NUNC) in liquid N2 and stored at −80 °C for the comet assay on liver cells. Another sample of liver tissue from the left lobe was preserved in 4% neutral buffered formaldehyde for histological examination. These procedures have been previously described in details (Saber et al. Citation2012; Bengtson et al. Citation2017).
Pulmonary influx of inflammatory cells
Pulmonary influx of inflammatory cells was quantified by differential counting of immune cells in BAL fluid. The method has been described elsewhere (Saber et al. Citation2012). Briefly, 50 µL of the cell resuspension in HAM-F12 medium and FBS was transferred to a microscope slide and centrifuged at 10,000 rpm for 4 min by use of a Cytofuge 2 (StatSpin, Bie and Berntsen, Rødovre, Denmark). Cells were fixed by the addition of 96% ethanol and incubated with May-Grünwald-Giemsa stain. The total number of cells in the resuspension was measured with a NucleoCounter NC-100 (Chemometec, Allerød, Denmark) Live/Dead Assay. The differential cell count was carried out on a total of 200 cells per sample.
Total protein in broncho alveolar lavage fluid
Total protein concentration in broncho alveolar lavage fluid (BALF) was quantified by the Pierce®BCA Protein Assay Kit (Thermo Scientific, Carlsbad, CA), as described in the manufacturer protocol. It was used as a proxy marker for membrane permeability and damage. Shortly, acellular BALF samples were analyzed and the protein concentrations were compared to a standard curve. Samples were prepared in duplicates and were incubated 30 min at 37 °C. Absorbance was measured at 550 nm on Victor Wallac-2 1420 (Perkin Elmer, Skovlunde, Denmark).
Gene expression of Saa3 and Tgf-β
Acute phase response and pro-fibrotic effects (tissue repair) were assessed by quantitative real time (RT)-PCR of Saa3 and Tgf-β mRNA expression levels, respectively, in lung tissue. The procedures have been previously described (Saber et al. Citation2012). Briefly, RNA was prepared using the NucleoSpin 96 RNA kit (Macherey-Nagel, Düren, Germany) from the entire left lung of each mouse. The tissues were lysed with a Tissue lyser (Qiagen, Vedbaek, Denmark). The purification was conducted according to the manufacturer descriptions. cDNA was prepared using TaqMan reverse transcription reagents (Applied Biosystems, Foster City, CA), as described by manufacturer. RT-PCR was performed using Universal Mastermix (Applied Biosystems, Naerum, Denmark). The gene expression was quantified in separate wells and samples were quantified in triplicates.
Comet assay
DNA strand breaks levels were quantified by the alkaline comet assay in BAL cells and liver as previously described (Bornholdt et al. Citation2007; Saber et al. Citation2012). Briefly, the frozen samples of BAL cells in 10% DMSO were thawed, and approximately 40 mg of frozen liver samples were squeezed through a metal stapler (diameter 0.5 cm, mesh size 0.4 mm) into cold Merchant’s medium (0.14 M NaCl, 1.47 mM KH2PO4, 2.7 mM KCl, 8.1 mM Na2HPO4,10 mM Na2EDTA, pH 7.4). Samples were embedded in agarose and transferred to Gelbond films, which were placed in lysis buffer overnight. The films were then subjected to alkaline electrophoresis, fixed, and stained for scoring as previously described (Saber et al. Citation2012). A negative and a positive control were included on each Gelbond film, by embedding samples of A549 previously exposed to 0 and 30 μM H2O2 (tail length = 45.13 and 71.91 µm, for negative and positive control). DNA strand break levels as Tail Length (TL) were normalized to the negative control, to reduce the effect of the assay variation (Saber et al. Citation2012).
Liver histology
Liver specimens fixed in 4% neutral buffered formaldehyde originating from 4 to 6 mice from the vehicle control and from the high-dose groups terminated 1, 3, or 28 days after instillation were paraffin-embedded. Thereafter, sections of 4–6 µm were made and stained with hematoxylin and eosin for histological examination. The INHAND recommendation for diagnostic nomenclature of microscopic changes in rodents was followed (Thoolen et al. Citation2010). When present, inflammatory cell infiltrates (focal infiltrations of mono- and polynuclear and/or histiocytic cells), were divided into two categories: small (≤10 inflammatory cells, sporadically accompanied by necrotic hepatocytes with distinct eosinophilic cytoplasms) and big (>10 inflammatory cells surrounded by necrotic hepatocytes with distinct eosinophilic cytoplasms, with apoptotic bodies/debris often present). The severity scores were given for the following changes: presence of hepatocytes with pyknotic nuclei, cytoplasmic vacuolation of hepatocytes, presence of binucleate hepatocytes, Kupffer cells with prominent nuclei (karyomegalic nuclei), apparent increase of Kupffer cells, hyperplasia of perivascular connective tissue, and edema of perivascular connective tissue. The severity was evaluated using a 3-grade system: (a) slight/minimal, (b) moderate/moderate number or size or (c) marked/many/large.
Statistics
The in vivo data were assessed by one- or two-way ANOVA. The post-hoc analysis was a Tukey-type multiple comparison test for effects showing statistical significance in the overall ANOVA test. Statistical significance was tested at the P < 0.05 level. Linear regression models were used to assess correlations between the instilled surface area and neutrophil influx (inflammation) or Saa3 mRNA (acute phase response). The statistical analyses were performed in R (The R Project for Statistical Computing version 3.5.3). The package ggplot2 was implemented in R for plotting of data (Valero-Mora Citation2010). The histological incidences were analyzed by Fisher’s Exact test in Graph Pad Prism 7.02 (Graph Pad Software Inc., La Jolla, CA, USA).
Results
Physicochemical characterization of particles
Selected physical and chemical properties of the materials are shown in . DLS results of all tested materials suspended in cell medium are represented in Supplementary Figure S1. Briefly, Bentonite and NanofilSE3000 hydrodynamic diameters were 0.9 and 0.7 µm, respectively, whereas the other ONC were ∼1.7 µm.
Surface area
Specific surface area was determined by the multi-point Brunauer, Emmett, and Teller (BET) method. The BET surface area () of Bentonite (73.59 m2/g) was considerably larger than all the ONC, with Nanofil9 having highest (24.07 m2/g) and Nanofil5, 8 and NanofilSE3000 having low surface areas (8.44, 5.55, and 2.74 m2/g, respectively). We have previously determined the BET surface area of carbon black to be 338 m2/g (Jacobsen et al. Citation2008).
Scanning electron microscopy
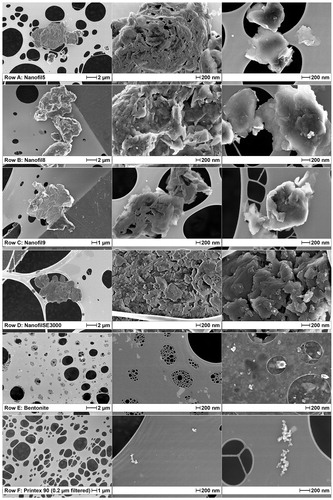
All the materials were analyzed by SEM in HBSS (). The ONC were analyzed also as raw materials in powder (Supplementary Figure S2). As powders, all ONC appear to have similar shape, except for NanofilSE3000, which has a smooth-edged shape. The suspensions of Nanofil9, NanofilSE3000, and especially Bentonite in HBSS seem to exfoliate the clay flakes, as compared to the raw powder. Sonication of the Bentonite particles disaggregates the larger agglomerates into much smaller particles such that very thin, possibly individual flakes were visible.
Figure 1. SEM of nanomaterials suspended in cell media: (a) Nanofil5, (b) Nanofil8, (c) Nanofil9, (d) NanofilSE3000, (e) Bentonite, (f) carbon black. For graphical reasons, light and contrast of Bentonite images (middle and right-row e) were enhanced, and carbon black was 0.2 µm filtered (See supplement for original version – Figure S3).
QAC content in supernatant by HPLC-MS
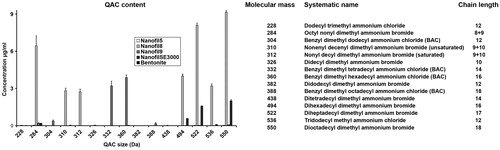
QAC released from the clay materials during dispersion in MilliQ water are shown in . Nanofil9 leaked BAC in the supernatant, while Nanofil8 and NanofilSE3000 leaked various amounts of QAC (varying chain lengths). In fact, Nanofil8 had much higher leakage of QAC, indicative of the excess content of QAC used during the surface treatment of this product. QAC of 284, 310, and 312 Da were also detected in the supernatant of sonicated Nanofil8. Bentonite and Nanofil5 did not leak any QAC.
Figure 2. QAC release from organo modified nanoclays dispersed in water. All nanoparticles were suspended in MilliQ water, and after centrifugation the supernatant was analyzed by LC-MS. The concentration of the individual QAC with different alkyl chain lengths (228–550 Da) is reported. No QAC was released from Bentonite. To the right is a list of QAC with different alkyl chains lengths and their masses (Da).
In vitro
ROS production
Levels of ROS were determined using both the cellular and the acellular versions of the 2′,7′ dichlorodihydrofluorescein diacetate (DCFH2-DA) assay. Following 3 h of incubation, carbon black caused increased ROS production in both cellular and acellular assays (Supplementary Figure S4). However, neither Bentonite nor the four ONC induced ROS production in the assays.
Viability
The cell viability and proliferation of nanoclay-treated cells were assessed following 24 and 48 h of incubation with concentration spans of 0–400 μg/ml (). All nanoclay materials induced cell death in a concentration-dependent manner, although to very different extents. Nanofi9 and Nanofil8 induced the strongest effects on viability, with 24 h Lethal Concentration (LC50) equal to 23 and 78 μg/ml, respectively, while the LC50 for Bentonite was found to be equal to 200 μg/ml. Nanofil5 and NanofilSE3000 induced the lowest effects, with 24 h LC50 >400 µg/ml. A further increase in cell death following 48 h exposure was found with 100 µg/ml of Nanofil8 (90%) and 400 µg/ml of Nanofil5 (80%), respectively, while Nanofil9 and NanofilSE3000 remained unchanged (). Carbon black did not affect the viability regardless of the concentrationand time.
Figure 3. Cell death (top) and effects on proliferation (bottom) of FE1-Muta™Mouse lung epithelial cells following 24 h and 48 h of exposure to four ONC, Bentonite, and Carbon black. The latter 2 were not evaluated at 48 h. Carbon black was included for comparisons. Each bar represents the mean of 2 separate experiments of each 2 replicates ± SEM. NanofilSE3000 noted as SE3000. The controls were cells exposed to ‘0 µg/ml.’
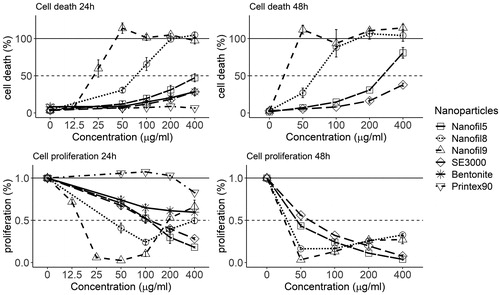
Carbon black at lower concentrations (50 and 100 µg/ml) had a positive effect on proliferation (above 100%), as compared to control (). The largest inhibitory effect was seen with Nanofil9, with only 10% proliferation at 25 µg/ml, followed by Nanofil8 with 30% proliferation at 100 µg/ml, as compared to the control. For these two ONC, an increase in the number of countable cells was seen at the highest tested concentrations (200 and 400 µg/ml). However, as can be observed from , the cells exposed in the low range that were dead appeared to disintegrate and were thus not recognized by the Nucleocounter. At higher Nanofil8 and Nanofil9 concentrations, cells were stable, intact, and countable despite being dead. Linear concentration-dependent inhibitory effects were observed for Nanofil5, NanofilSE3000, and Bentonite, compared to the control, decreasing to 20, 30, and 60% proliferation at 400 µg/ml, respectively, compared to the control. The effects on proliferation further increased with exposure duration from 24 to 48 h (). Viability of the cells was also assessed after shorter exposures (supplementary information).
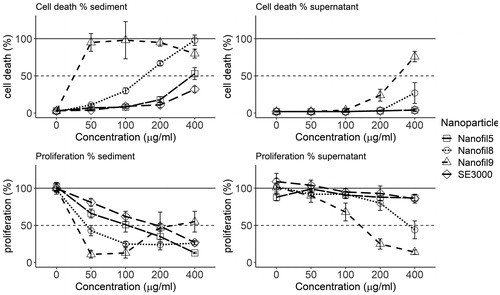
The re-suspended sediment () caused a similar or slightly lower toxicity as compared to the initial nanoclay suspensions in cell medium (400 μg/ml). Generally, there was no toxicity (cell death or decreased proliferation) following exposure to supernatants of either Nanofil5 or NanofilSE3000. Supernatants of Nanofil9 and Nanofil8 induced toxicity by blocking proliferation and inducing cytotoxicity; however, the effects were only visible above 100 µg/ml.
Figure 4. Cell death (top) and effects on proliferation (bottom) of FE1-Muta™Mouse lung epithelial cells following 24 h of exposure to the resuspended sediment or to the supernatant from the four ONC. Each bar represents the mean of 2 separate experiments of each 2 replicates ± SEM. NanofilSE3000 noted as SE3000.
Toxicity of pure QAC
Similar cell death occurred in FE1-MML cells with QAC containing only one long alkyl chain, regardless of the chain length (14–16 C). However, with QAC containing two long alkyl chains, cytotoxicity decreased with increasing chain length. Supplementary Figure 2(C) illustrates the difference in toxicity between QAC with one and two 14 C long alkyl chains. The presence of BAC increased the cytotoxicity of the QAC containing it (Supplementary Figure S5).
In vivo
Before conducting in vivo experiments on materials not previously tested, it is a 3R requirement from the local animal care committee at the National Research Institute for the Working Environment that such nanomaterials are assessed for overt toxicity in vitro. Materials deviating most in physical chemical characteristics such as surface area, SEM appearance, surface modification as well as the cytotoxicity were selected for the in vivo experiment, and these were Nanofil9 and NanofilSE3000 for the in vivo experiment. As a high in vitro toxicity was observed for Nanofil 9, we decided to reduce the highest dose level from 162 µg dose to 54 µg.
Cell count in broncho-alveolar lavage fluid
All the materials tested (Bentonite, carbon black, Nanofil9, and NanofilSE3000) induced time- and dose-dependent increase of neutrophil cell numbers in the BALF of exposed mice (). One day post exposure, Bentonite induced the largest inflammatory response, with 10-, 20-, and 64-fold increase of neutrophil counts in BALF of mice exposed to low-, medium-, and high-dose, respectively, as compared to mice in the control group. Following in severity, NanofilSE3000 caused 5- and 17-fold increase in medium and high dose. However, only the high dose of Nanofil9 caused a significant (5-fold) increase of neutrophils. After 3 days from the single exposure, the number of neutrophils increased further in all mice groups exposed to Bentonite (35-, 170-, and 189-fold in low, medium, and high dose), and in mice groups exposed to medium and large dose of Nanofi9 (9- and 26-fold). However, the number of neutrophils decreased in mice groups exposed to NanofilSE3000, with a significant effect (4-fold) in the high-dose-group. No increase in neutrophils was found at day 28 in all mice groups exposed to Bentonite and the two ONC, in comparison with the control group. A significant increase in lymphocytes was found in the mice groups exposed to low dose of Bentonite and high dose of Nanofil9 3 days post exposure. The data on cellularity in BALF for the carbon black group were previously published (Saber et al. Citation2012), as the benchmark group was shared between two studies. Bentonite induced more inflammation at 1 and 3 days post-exposure compared to carbon black, but not at day 28.
Table 3. BAL fluid counts in mice 1, 3, and 28 days post-exposure to 18, 54, or 162 µg of Bentonite, NanofilSE3000, and Carbon black. Lower doses were used for Nanofi9 (6, 18, and 54 µg, respectively). Mice were exposed for 1, 3, or 28 days. *, **, ***: Statistically significant compared to control mice at the 0.5, 0.01, and 0.001 level, respectively.
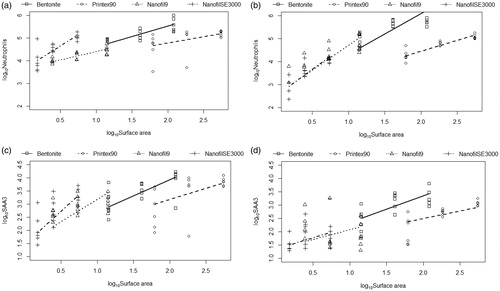
The neutrophil influx correlated with total deposited surface area for all nanoclays, as well as carbon black, at day one and 3 post-exposure (R2=0.74, 0.70, and 0.25, for day 1, 3, and 28, respectively). The correlations for day 1 and 3 are shown in .
Figure 5. Correlations of Neutrophils in BAL with specific surface of NPs, (a) at day 1 and (b) at day 3. Correlations of Saa3 in lung tissue with specific surface of NPs, (c) at day 1 and (d) at day 3. The controls (surface area = 0) were omitted for graphical reasons. Data for 28 days not shown. Carbon black was included for comparisons (Saber et al. Citation2012).
Total protein concentration in BALF
Protein concentration in BALF () was assessed as a marker of increased membrane permeability due to cell damage. Bentonite caused the largest increase in protein content in BALF, among all materials tested, 1 and 3 days after exposure, with clear dose–response relationships. The significant high amount of protein persisted in the group exposed to 162 µg of Bentonite also through 28 days.
Figure 6. Protein content in BAL fluid of mice that were exposed by single intratracheal instillation to vehicle, 18, 54, or 162 µg of Bentonite (a), NanofilSE3000 (c) and Carbon black (d). Carbon black was included for comparisons (Saber et al. Citation2012). Lower doses were used for Nanofi9 (b) (6, 18, and 54 µg, respectively). Mice were examined 1, 3, or 28 days post-exposure. Each mice group is represented as a data distribution through quartiles. *, **, ***: Statistically significant compared to control mice at the 0.5, 0.01, and 0.001 level, respectively.
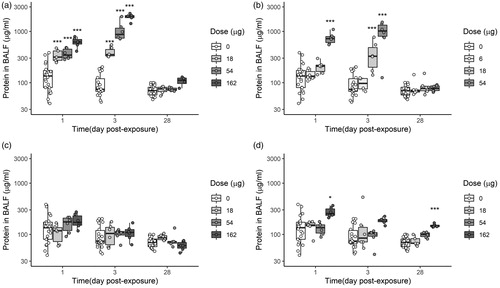
Significant amount of protein in BALF was detected in mice groups instilled with 54 µg (high dose) of Nanofi9, 1 and 3 days post-exposure, while the medium dose (18 µg) caused a slight, but significant increase at day 3. Carbon black significantly increased protein in BALF at 162 µg on day 1, while on day 28 even higher increase in protein content was observed in the groups exposed to 54 and 162 µg. No increase in protein in BALF was detected for NanofilSE3000.
Acute phase response
Pulmonary expression of Saa3 mRNA, quantified to assess the acute phase response caused by exposure to the selected nanoparticles, was found to be time- and dose-dependent (). Notably, one day post exposure, Bentonite and Nanofi9 induced significantly higher Saa3 expression levels in all dose groups, as compared to the control, whereas medium and high dose (54 and 162 µg) of NanofilSE3000 induced significantly higher expression levels. On day 3 post-exposure, the strong effect of Bentonite persisted, with significantly high levels of Saa3 in all mice groups. Significantly higher levels of Saa3 than control were found also in mice groups exposed to 6 and 18 µg of Nanofil9, while no increase occurred for all mice groups exposed to NanofilSE3000 at day 3 post-exposure. On day 28, the Saa3 gene expression profiles in the mice lung tissues exposed to Nanofil9 and NanofilSE3000 had returned to baseline. Despite a decrease, significantly increased levels were found in the high-dose group for Bentonite. The data for carbon black were shared between two studies and have been previously published (Saber et al. Citation2012).
Figure 7. Saa3 in lung tissues of mice that were exposed by single intratracheal instillation to vehicle, 18, 54, or 162 µg of Bentonite (a), NanofilSE3000 (c) and Carbon black (d). Carbon black was included for comparisons (Saber et al. Citation2012). Lower doses were used for Nanofi9 (b) (6, 18, and 54 µg, respectively). Mice were examined 1, 3, or 28 days post-exposure. Each mice group is represented as a data distribution through quartiles. *, **, ***: Statistically significant compared to control mice at the 0.5, 0.01, and 0.001 level, respectively.
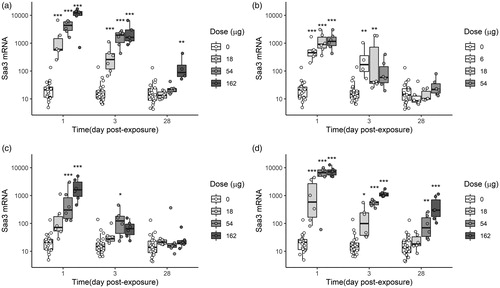
It is well established that there is a correlation between the pulmonary total deposited nanoparticle surface area and the level of inflammation and acute phase response developed (Saber et al. Citation2014). In line with this the acute phase response in the present paper correlated with neutrophil influx, and with the total deposited surface area (), one and 3 days (R2=0.76, 0.66, and 0.42, for day 1, 3, and 28, respectively).
Fibrosis/tissue damage
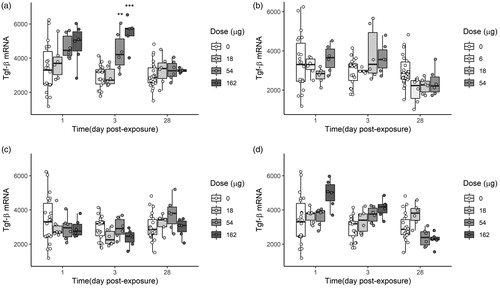
A dose-dependent increase in Tgf-β mRNA levels in the lungs (as a marker of pro-fibrotic/tissue damage) were observed for both Bentonite and carbon black at day 1 and 3 post-exposure. However, only the medium and high dose of Bentonite induced statistically significant increase in Tgf-β mRNA levels 3 days post exposure (), as compared to control groups. After 28 days from exposure, the pro-fibrotic Tgf-β levels in mice exposed to Benotnite or carbon black were equal to the control groups. None of the two ONC changed the Tgf-β levels compared to the controls, at the doses tested and in the three time-points.
Figure 8. Tgf-β in lung tissues of mice that were exposed by single intratracheal instillation to vehicle, 18, 54, or 162 µg of Bentonite (a), NanofilSE3000 (c), and Carbon black (d). Carbon black was included for comparisons (Saber et al. Citation2012). Lower doses were used for Nanofi9 (b) (6, 18, and 54 µg, respectively). Mice were examined 1, 3, or 28 days post-exposure. Each mice group is represented as a data distribution through quartiles. *, **, ***: Statistically significant compared to control mice at the 0.5, 0.01, and 0.001 level, respectively.
DNA damage
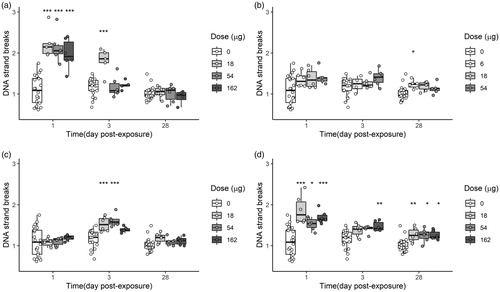
All doses of Bentonite significantly increased DNA strand break levels in BAL cells 1 day post intratracheal exposure (). On day 3, a bell-shaped curve was observed with an increase in DNA strand breaks occurring only following 18 µg of exposure to Bentonite. No damage was observed 28 days following exposure. No DNA damage was observed in BAL cells from mice exposed to NanofilSE3000 1 day post exposure (all doses). However, at 3 days post exposure, a significant increase in DNA strand break levels was detected in the dose groups of 54 and 164 µg. After 28 days, the level of DNA strand breaks returned to baseline. Nanofil9 induced a small but significant increase in DNA strand break levels on day 28 for the low dose (6 µg). DNA strand break levels for carbon black were previously published (Bourdon et al. Citation2012; Saber et al. Citation2012).
Figure 9. DNA strand breaks (normalized tail length) in BAL cells obtained from mice exposed to 0, 18, 54, or 162 μg of Bentonite (a), NanofilSE3000 (c), and Carbon black (d) or 0, 6, 18, and 54 μg of Nanofil9 (b). Carbon black was included for comparisons (Saber et al. Citation2012). *, **, ***: Statistically significant compared to control mice at the 0.5, 0.01, and 0.001 level, respectively.
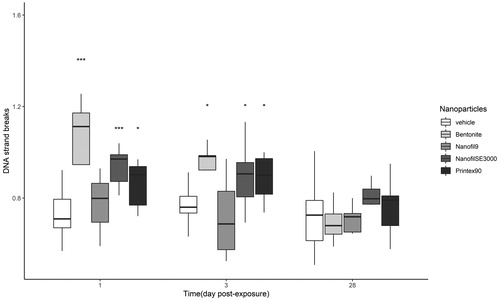
The DNA strand breaks levels in liver tissues were determined only for the highest doses for all materials (162 µg for Bentonite, NanofilSE3000, and carbon black; 54 µg for Nanofil9). At 1 and 3 days post exposure, significant increase in DNA strand break levels in liver was detected for all nanoparticles, except for Nanofil9. After 28 days no DNA damage was observed ().
Figure 10. DNA strand breaks (normalized tail length) in liver tissue obtained from mice exposed to 0, 18, 54, or 162 μg of Bentonite, NanofilSE3000, and Carbon black or 0, 6, 18, and 54 μg of Nanofil9. Carbon black was included for comparisons (Saber et al. Citation2012). *, **, ***: Statistically significant compared to control mice at the 0.5, 0.01, and 0.001 level, respectively.
Liver histology
Several histological changes were seen in the livers from the mice exposed to Bentonite, Nanofil9 and NanofilSE3000 (), but the incidences were generally low and not statistically significantly different from those in the control group except for extravasation in the Bentonite group on day 3 (p < 0.001; Supplementary Table S1). The histological changes were slight/minimal in the severity with an exception of moderate severity recorded for a cytoplasmic vacuolation of hepatocytes on day 3 in all exposed and the control groups, and for increase in binucleate hepatocytes and of extravasation on day 3 in Bentonite group (Supplementary Table S1). Overall, the type, incidence, and severity of the changes indicated no difference between the control and the exposed groups in morphology of the liver. The exception was the combined number of big inflammatory cell infiltrates which was elevated in the mice livers 28 days post NanofilSE3000 exposure (all 6 mice; 17 in total), whereas it was detected in 3 of 5 control mice (3 in total; ).
Figure 11. Microscopic changes in the liver of mice after a single intratracheal exposure to different nanomaterials. The doses of the nanomaterials were 162 µg/mouse, except of 54 µg/mouse for Nanofil9 and the dosing volume was 50 µg/mouse. (A–C) Vehicle control 1, 3, and 28 days post-exposure; (D–F) Bentonite 1, 3, and 28 days post-exposure; (G–I) Nanofil9 1, 3, and 28 days post-exposure. (J–L) NanofilSE 3000 1, 3, and 28 days post-exposure; (M–0) carbon black 1, 3, and 28 days post-exposure. Long arrows – Focal inflammatory cell infiltrates: small on A, C, J, K, M, and O or big on D, G–I, L, and N (note adjacent necrotic hepatocytes with distinct eosinophilic cytoplasm). Thick short arrows – cytoplasmic vacuolation in hepatocytes (A–D, F, H, I, M–O). Small arrows – binucleate hepatocytes (A, C, E, M). Sinusoid dilatation – white long spaces between hepatic cords (J–M). Heamatoxylin and eosin stain, magnification as scale on the figure O.
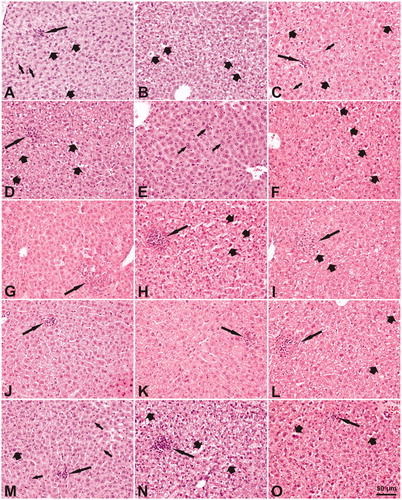
Table 4. Incidence and number of inflammatory cell infiltrates in the liver.
Discussion
In this study, we assessed how surface modifications of nanoclays influence their toxicity following pulmonary exposure, to further extend the knowledge regarding their safe use in the working environment. We assessed in vitro the cytotoxicity of Bentonite, carbon black, and 4 different QAC-functionalized nanoclays, in a mouse epithelial cell line (FE1-MML). Following the in vitro screening, two of the ONC (Nanofil9 and NanofilSE3000) as well as the pristine Bentonite and carbon black were instilled intratracheally in mice. Our in vitro results indicate that only two ONC decreased cell viability. In vivo, Bentonite induced much stronger toxicity than the ONC, for all endpoints assessed including inflammation, acute phase response, pro-fibrotic response (tissue repair), and genotoxicity (lung and liver).
The characterization of the tested nanoclays indicates that the QAC surface modification of Bentonite changes the physical-chemical properties. QAC treatment reduces the specific surface area () and the shape () of the clay particles. Accordingly, Bentonite particles suspended in HBSS appear as smaller, thinner, and sharper-edged flakes compared to the ONC. Similar effects of the modification were evident in a previous analysis (Wagner et al. Citation2017). The larger size of ONC has been linked to increased basal spacing; space between the two silicate-sheets of Bentonite, which increases with the modifier cation exchange capacity (Xi et al. Citation2004) or with increasing alkyl length (Xie et al. Citation2001). Furthermore, the ONC leak QAC to water (), which could potentially also occur in the cell medium, in the instillation medium, and in the mice lungs. In support of this, large release of BAC from Nanofil9, as well as excess of QAC in Nanofil8, have previously been shown in a thermo-gravimetric analysis (Clausen et al. Citation2019).
The low cytotoxicity observed for Nanofil5 and NanofilSE3000 (24 h LC50 >400 µg/ml) is in line with two previous published studies encompassing similar products. These were Cloisite 30B (30% w/w QAC; methyl, alkyl chains (C14–C18), bis-2-hydroxyethyl), which caused a dose dependent cytotoxicity with more than 40% cell death at 226 µg/ml (Sharma et al. Citation2010), and Cloisite 93 A (37.5% w/w QAC; methyl, alkyl chains (C14–C18), proton), which increased lactate dehydrogenase release to ∼50% following 24 h exposure at 500 and 1000 µg/ml (Lordan, Kennedy, and Higginbotham Citation2011). Although the surface modifications on Nanofil5, Nanofil8, and NanofilSE3000 are produced from the same QAC starting batch, the excess amounts of QAC on Nanofil8 may have caused this material to induce a larger cytotoxicity. The contrast in toxicity between ONC and Bentonite, shown in the current study, supports the scientific literature, which shows that some ONC are cytotoxic in vitro due to the presence of the QAC organic modifiers (Elmore Citation2003; Janer et al. Citation2014; Connolly et al. Citation2019). The surprising proliferation curve observed following higher exposures of Nanofil9 () is an artifact caused by the BAC (QAC). At low concentrations all cells are dead and most dis-integrated, whereas high exposures appear to stabilize the cell membrane keeping the dead cells intact (mummified) and countable after 24 h of exposure. BAC has been shown to stabilize the cell membrane and hinder the detection of cytotoxicity, resulting in apparent higher viability at higher concentrations (Deutschle et al. Citation2006). Lastly, we also tested the cell viability (see supplementary information) of a library of pure QAC containing different alkyl chain length and numbers (). Similarly to what has been previously shown (Wagner et al. Citation2017), we identified a decrease in cytotoxicity with increasing number of alkyl-chains and the alkyl-chain length.
The in vitro screening and the characterization of the materials guided the selection of two ONC for mouse pulmonary instillation experiments. Nanofil9 and NanofilSE3000 were selected based on surface area (highest and lowest), cytotoxicity (most and least), and appearance in SEM images (NanofilSE3000 appeared different compared to the other ONC). NanofilSE3000 and Bentonite were intratracheally instilled in mice lungs at 18, 54, and 162 µg. However, we instilled lower doses of Nanofil9 (6, 18, and 54 µg, respectively), since this material was highly cytotoxic in vitro.
Inflammatory cells composition in BALF is an important indicator of inflammation. Both Bentonite and carbon black induced larger inflammatory responses, quantified as neutrophil, macrophage, and total cell influx, compared to the two ONC. The higher inflammatory response could be explained by the larger surface area of Bentonite and carbon black, as the coating on the two ONC lowered their surface areas considerably (). Likewise, previous studies have shown that the total deposited surface area of nanoparticles, either spherical or HARN, is positively associated with inflammation (Duffin et al. Citation2007; Nakanishi et al. Citation2015; Poulsen et al. Citation2016; Barfod et al. Citation2020), and we have previously shown that surface treatment leading to increased specific surface area increased inflammation and acute phase response (Barfod et al. Citation2020). However, Bentonite induced more inflammation than carbon black, even though the latter has a ∼5-fold larger specific surface area. It may well be that the small ‘blade’-like flakes of Bentonite contribute to the increased inflammation, by damaging the lung tissue during inhalation/exhalation, which is further supported by the high levels of protein in BALF of mice exposed to this particle, particularly 1 and 3 days after exposure. Lower inflammation with presence of surface coating is in agreement with a previous inhalation study. Notably, pristine montmorillonite caused edema on day 1 and large inflammatory response that persisted throughout the experiment, whereas the ONC exposure resulted only in mild inflammation. The authors suggested that the organic coating of the ONC might protect lung cells from surface silanol groups, aluminum oxide, and other bound ions (e.g. Ca, Fe), which are cytotoxic (Stueckle et al. Citation2018). Our results indicate that a surface modification of nanoclays using QAC may reduce their inflammatory potential, in agreement with previously published works.
We quantified Saa3 because it is an established member of the acute-phase response, with a causal link between particle exposure and risk of cardiovascular diseases. Similarly to carbon black, Bentonite induced a higher acute phase-response than the two ONC, with a persistent significant effect in the high dose mice groups throughout the experiment. Pulmonary Saa3 mRNA levels were correlated with neutrophil influx and with total deposited surface area (). This is in agreement with previous studies of other nanoparticles (carbon black and titanium dioxide nanoparticles, multi- and single-walled carbon nanotubes), diesel exhaust particles, and airborne dust; Saber et al. Citation2013; Poulsen et al. Citation2017). Further research should address the quantification of levels of acute phase proteins SAA and C-reactive protein (CRP) in the systemic circulation of workers exposed to nanoclays, as these are clearly associated with increased risk of cardiovascular disease in prospective epidemiological studies (Ridker et al. Citation2000).
TGF-β is a well-known regulator of pathways leading to tissue repair or fibrosis in case of sustained presence of particles and recurrent tissue damage (Distler et al. Citation2019). Tgf-β mRNA expression levels were assessed in lung tissue as a marker of a pro-fibrotic response (tissue repair), because some nanomaterials have been shown to cause fibrosis such as, e.g., CNTs (Poulsen et al. Citation2015). Only Bentonite significantly increased Tgf-β mRNA levels in a dose dependent manner 3 days post-exposure. These levels returned to baseline, due perhaps to a recovery of the lung tissue. A significant increase of this marker in the lung has been shown for montmorillonite, already after 1 day from the exposure (Stueckle et al. Citation2018). As we did not include histological examination of lung tissue, fibrosis was not assessed. However, we have previously shown that one long-thick MWCNT induced TGF-b signaling in mouse lungs and dose-dependent development of fibrosis at 3 days post-exposure in an identical experimental set up (Poulsen et al. Citation2015). The differentiation of fibroblasts into epithelial mesenchymal cells, resulting in increased TGF-β levels, is a key event of fibrosis (Labib et al. Citation2016; Halappanavar, et al. Citation2020). The increased Tgf-β mRNA levels with exposure to Bentonite indicate that the material could cause fibrosis, however, a longer follow-up period would be required to assess fibrosis by collagen staining.
We assessed DNA strand breaks by comet assay, in BALF cells and liver of mice exposed to pristine and modified nanoclays, which to our knowledge has not previously been performed. Bentonite induced the highest levels of DNA damage in BAL cells in all dose groups at day 1 post exposure. None of the ONC nor Bentonite generate ROS as determined by the DCFH2-DA assay (Supplementary Figure S4). However, the levels of ROS in vivo might have been different, due to the high inflammation, secondary ROS production, and probably oxidative stress in the lung. Bentonite nanoparticles could possibly induce cellular damage due to the material shape, leading consequently to downstream genotoxicity. By contrast, the surface modification on ONC gives them a rounded softer appearance, which may protect the epithelial cells from such damage. Kato and colleagues showed that kaolin clay plates induced DNA strand breaks in the lungs of mice, which was particularly pronounced after intratracheal instillation with kaolin having sharp edges (Kato et al. Citation2017). Our results are in contrast with a previous in vitro study, which indicated ONC to induce greater genotoxicity than Bentonite, suggesting that it was the QAC that causes genotoxicity (Sharma et al. Citation2010). Although we have not assessed the genotoxicity in the in vitro screening, we could verify that an excess of QAC in the Nanofil8 could affect cell viability. Similarly, lower residual amounts of QAC of NanofilSE3000 might cause genotoxicity, however, this needs further research in vitro to be confirmed. The conflicting results might reflect the difference in complexity between in vitro and in vivo models. The lung is a dynamic organ in continuous movement, hence increasing in vivo the chances of larger tissue damage due to deposited platelet flakes. Bentonite and NanofilSE3000 induced DNA damage in hepatic tissue, which might be explained by a possible systemic inflammation, mediated by increased expression of Saa3 in lung tissue. Also, NanofilSE3000 might have lost the coating, and these chemicals may translocate more easily to the systemic circulation and therefore cause adverse effects in the liver. The elevated levels of DNA strand breaks had declined to a normal level by day 28 post-exposure. As previously reported, carbon black induced DNA damage in liver tissue (Bourdon et al. Citation2012).
It is known that a fraction of the alveolar deposited nanomaterial translocates from the lung and end up in distant organs, including the liver (Modrzynska et al. Citation2018). Exposure of mice to the three test compounds or carbon black did not significantly affect liver morphology as compared to the vehicle controls based on the incidence and severity of the histological findings. Inflammatory cell infiltrations are known to occur under physiological conditions (Rogers and Dintzis Citation2012). However, the group exposed to the high dose of NanofilSE3000 deserves attention, as this exposure resulted in a higher number of big inflammatory cell infiltrates than in the control group. This tested material may enhance inflammation in the liver.
Conclusion
We have demonstrated that the unmodified nanoclay, Bentonite, is the most toxicologically potent material across endpoints, time points and doses tested in the mouse lung. The QAC/BAC surface modification of Bentonite gives it a ‘rounded’ shape and lowers the surface area, resulting in reduced toxicological effects in the mouse lung. The pulmonary inflammation and acute phase response correlates with the total deposited surface area of the studied nanoclays, which explain the high toxicity of Bentonite. Furthermore, Bentonite induced a larger cellular damage and pro-fibrotic response compared to ONC. Although only CB induced ROS, the high levels of DNA strand breaks detected following Bentonite exposure might be the result of inflammation and cellular damage. From the in vitro experiments of pure QAC, we identified a correlation between increased cytotoxicity and reduced number (and length) of QAC chains. In conclusion, this study shows that surface modification of pristine clays decreases hazard potentials, and provides a structure–activity relationship that can be used for the development of nanocomposite materials that are safe by design.
TNAN-2020-OR-0081-File014.docx
Download MS Word (1.8 MB)Acknowledgments
The authors thank Anni Vibenholt for QAC measurements, Michael Guldbrandsen for assisting with animal experiments, Jesper Bøgelund for SEM analysis, Rasmus Liland for assisting with some plots in R, and the technical assistance from Aleksander Penkowski.
Disclosure statement
The authors report no conflict of interest.
Additional information
Funding
Related Research Data
References
- Adamis, Z., and R. B. Williams. 1985. Environmental Health Criteria 231 – Bentonite, Kaolin and selected clay minerals. World Health Organization.
- Barfod, K. K., K. M. Bendtsen, T. Berthing, A. J. Koivisto, S. S. Poulsen, E. Segal, E. Verleysen, et al. 2020. “Increased Surface Area of Halloysite Nanotubes Due to Surface Modification Predicts Lung Inflammation and Acute Phase Response after Pulmonary Exposure in Mice.” Environmental Toxicology and Pharmacology 73: 103266. doi:10.1016/j.etap.2019.103266.
- Bendtsen, K. M., A. Brostrøm, A. J. Koivisto, I. Koponen, T. Berthing, N. Bertram, K. I. Kling, et al. 2019. “Airport Emission Particles: Exposure Characterization and Toxicity Following Intratracheal Instillation in Mice.” Part Fibre Toxicol 16: 23. doi:10.1186/s12989-019-0305-5.
- Bengtson, S., K. Kling, A. M. Madsen, A. W. Noergaard, N. R. Jacobsen, P. A. Clausen, B. Alonso, et al. 2016. “No Cytotoxicity or Genotoxicity of Graphene and Graphene Oxide in Murine Lung Epithelial FE1 Cells In Vitro.” Environmental and Molecular Mutagenesis 57 (6): 469–482. doi:10.1002/em.22017.
- Bengtson, S., K. B. Knudsen, Z. O. Kyjovska, T. Berthing, V. Skaug, M. Levin, I. K. Koponen, et al. 2017. “Differences in Inflammation and Acute Phase Response but Similar Genotoxicity in Mice Following Pulmonary Exposure to Graphene Oxide and Reduced Graphene Oxide.” PLoS One 12 (6): e0178355–25. doi:10.1371/journal.pone.0178355.
- Berndt-Weis, M. L., L. M. Kauri, A. Williams, P. White, G. Douglas, and C. Yauk. 2009. “Global Transcriptional Characterization of a Mouse Pulmonary Epithelial Cell Line for Use in Genetic Toxicology.” Toxicology In Vitro: An International Journal Published in Association with BIBRA 23 (5): 816–833. doi:10.1016/j.tiv.2009.04.008.
- Bornholdt, J., A. T. Saber, A. K. Sharma, K. Savolainen, U. Vogel, and H. Wallin. 2007. “Inflammatory Response and Genotoxicity of Seven Wood Dusts in the Human Epithelial Cell Line A549.” Mutation Research 632 (1–2): 78–88. doi:10.1016/j.mrgentox.2007.04.016.
- Bourdon, J. A., A. T. Saber, N. R. Jacobsen, K. A. Jensen, A. M. Madsen, J. S. Lamson, H. Wallin, et al. 2012. “Carbon Black Nanoparticle Instillation Induces Sustained Inflammation and Genotoxicity in Mouse Lung and Liver.” Particle and Fibre Toxicology 9 (1): 5. doi:10.1186/1743-8977-9-5.
- Brunauer, S., P. H. Emmett, and E. Teller. 1938. “Adsorption of Gases in Multimolecular Layers.” Journal of the American Chemical Society 60 (2): 309–319. doi:10.1021/ja01269a023.
- Carretero, M. I., C. S. F. Gomes, and F. Tateo. 2006. “Chapter 11.5 Clays and Human Health.” Developments in Clay Science 1 (C): 717–741. doi:10.1016/S1572-4352(05)01024-X.
- Choi, H. -Y., Y. -H. Lee, C. -H. Lim, Y. -S. Kim, I. -S. Lee, J. -M. Jo, H. -Y. Lee, et al. 2020. “Assessment of Respiratory and Systemic Toxicity of Benzalkonium Chloride Following a 14-Day Inhalation Study in Rats.” Particle and Fibre Toxicology 17 (1): 1–19. doi:10.1186/s12989-020-0339-8.
- Clausen, P. A., V. Kofoed-Sørensen, A. W. Nørgaard, N. M. Sahlgren, and K. A. Jensen. 2019. “Thermogravimetry and Mass Spectrometry of Extractable Organics from Manufactured Nanomaterials for Identification of Potential Coating Components.” Materials 12 (22): 3657–3621. doi:10.3390/ma12223657.
- Connolly, M., Y. Zhang, S. Mahri, D. M. Brown, N. Ortuño, M. Jordá-Beneyto, K. Maciaszek, et al. 2019. “The Influence of Organic Modification on the Cytotoxicity of Clay Particles to Keratinocytes, Hepatocytes and Macrophages; An Investigation Towards the Safe Use of Polymer-Clay Nanocomposite Packaging.” Food and Chemical Toxicology: An International Journal Published for the British Industrial Biological Research Association 126: 178–191. doi:10.1016/j.fct.2019.02.015.
- Danielsen, P. H., K. B. Knudsen, J. Štrancar, P. Umek, T. Koklič, M. Garvas, E. Vanhala, et al. 2020. “Effects of Physicochemical Properties of TiO2 Nanomaterials for Pulmonary Inflammation, Acute Phase Response and Alveolar Proteinosis in Intratracheally Exposed Mice.” Toxicology and Applied Pharmacology 386: 114830. doi:10.1016/j.taap.2019.114830.
- Deutschle, T., U. Porkert, R. Reiter, T. Keck, and H. Riechelmann. 2006. “In Vitro Genotoxicity and Cytotoxicity of Benzalkonium Chloride.” Toxicology In Vitro 20 (8): 1472–1477. doi:10.1016/j.tiv.2006.07.006.
- Distler, J. H. W., A. -H. Györfi, M. Ramanujam, M. L. Whitfield, M. Königshoff, and R. Lafyatis. 2019. “Shared and Distinct Mechanisms of Fibrosis.” Nature Reviews. Rheumatology 15 (12): 705–730. doi:10.1038/s41584-019-0322-7.
- Donaldson, K., F. Murphy, A. Schinwald, R. Duffin, and C. A. Poland. 2011. “Identifying the Pulmonary Hazard of High Aspect Ratio Nanoparticles to Enable Their Safety-by-Design.” Nanomedicine (London, England) 6 (1): 143–153. doi:10.2217/nnm.10.139.
- Duffin, R., L. Tran, D. Brown, V. Stone, and K. Donaldson. 2007. “Proinflammogenic Effects of Low-Toxicity and Metal Nanoparticles In Vivo and In Vitro: Highlighting the Role of Particle Surface Area and Surface Reactivity.” Inhalation Toxicology 19 (10): 849–856. doi:10.1080/08958370701479323.
- Elmore, A. R. 2003. “Final Report on the Safety Assessment of Aluminum Silicate, Calcium Silicate, Magnesium Aluminum Silicate, Magnesium Silicate, Magnesium Trisilicate, Sodium Magnesium Silicate, Zirconium Silicate, Attapulgite, Bentonite, Fuller’s Earth, Hectorite, Kaolin.” International Journal of Toxicology 22 (Suppl): 37–102. doi:10.1080/10915810390204890.
- Hadrup, N., F. Rahmani, N. R. Jacobsen, A. T. Saber, P. Jackson, S. Bengtson, A. Williams, et al. 2019. “Acute Phase Response and Inflammation Following Pulmonary Exposure to Low Doses of Zinc Oxide Nanoparticles in Mice.” Nanotoxicology 13 (9): 1275–1292. doi:10.1080/17435390.2019.1654004.
- Hadrup, N., A. T. Saber, Z. O. Kyjovska, N. R. Jacobsen, M. Vippola, E. Sarlin, Y. Ding, et al. 2020. “Pulmonary Toxicity of Fe2O3, ZnFe2O4, NiFe2O4 and NiZnFe4O8 Nanomaterials: Inflammation and DNA Strand Breaks.” Environmental Toxicology and Pharmacology 74: 103303. doi:10.1016/j.etap.2019.
- Halappanavar, S., S. van den Brule, P. Nymark, L. Gaté, C. Seidel, S. Valentino, V. Zhernovkov, et al. 2020. “Adverse Outcome Pathways as a Tool for the Design of Testing Strategies to Support the Safety Assessment of Emerging Advanced Materials at the Nanoscale.” Particle and Fibre Toxicology 17: 16. doi:10.1186/s12989-020-00344-4.
- Høgsberg, T., N. R. Jacobsen, P. A. Clausen, and J. Serup. 2013. “Black Tattoo Inks Induce Reactive Oxygen Species Production Correlating with Aggregation of Pigment Nanoparticles and Product Brand but Not with the Polycyclic Aromatic Hydrocarbon Content.” Experimental Dermatology 22 (7): 464–469. doi:10.1111/exd.12178.
- Huang, Y., M. Zhang, H. Zou, X. Li, M. Xing, X. Fang, J. He, et al. 2013. “Genetic Damage and Lipid Peroxidation in Workers Occupationally Exposed to Organic Bentonite Particles.” Mutation Research/Genetic Toxicology and Environmental Mutagenesis 751 (1): 40–44. doi:10.1016/j.mrgentox.2012.10.006.
- Jackson, P., K. S. Hougaard, A. M. Z. Boisen, N. R. Jacobsen, K. A. Jensen, P. Møller, G. Brunborg, et al. 2012. “Pulmonary Exposure to Carbon Black by Inhalation or Instillation in Pregnant Mice: Effects on Liver DNA Strand Breaks in Dams and Offspring.” Nanotoxicology 6 (5): 486–500. doi:10.3109/17435390.2011.587902.
- Jackson, P., S. P. Lund, G. Kristiansen, O. Andersen, U. Vogel, H. Wallin, K. S. Hougaard, et al. 2011. “An Experimental Protocol for Maternal Pulmonary Exposure in Developmental Toxicology.” Basic & Clinical Pharmacology & Toxicology 108 (3): 202–207. doi:10.1111/j.1742-7843.2010.00644.x.
- Jacobsen, N. R., and P. A. Clausen. 2015. “Carbon Black Nanoparticles and Other Problematic Constituents of Black Ink and Their Potential to Harm Tattooed Humans.” Current Problems in Dermatology 48: 170–175. doi:10.1159/000369319.
- Jacobsen, N. R., G. Pojana, P. White, P. Møller, C. A. Cohn, K. S. Korsholm, U. Vogel, et al. 2008. “Genotoxicity, Cytotoxicity, and Reactive Oxygen Species Induced by Single-Walled Carbon Nanotubes and C(60) Fullerenes in the FE1-MutaMouse Lung Epithelial Cells.” Environmental and Molecular Mutagenesis 49 (6): 476–487. doi:10.1002/em.20406.
- Jacobsen, N.R., A. T. Saber, P. White, P. Møller, G. Pojana, U. Vogel, S. Loft, et al. 2007. “Increased Mutant Frequency by Carbon Black, but not Quartz, in the lacZ and cII Transgenes of MutaMouse Lung Epithelial Cells.” Environmental and Molecular Mutagenesis 48: 451–461. doi: 10.1002/em.20300.
- Jacobsen, N. R., P. A. White, J. Gingerich, P. Møller, A. T. Saber, G. R. Douglas, U. Vogel, et al. 2011. “Mutation Spectrum in FE1-MutaMouse Lung Epithelial Cells Exposed to Nanoparticulate Carbon Black.” Environmental and Molecular Mutagenesis 52 (4): 331–337. doi:10.1002/em.20629.
- Janer, G., E. Fernández-Rosas, E. Mas del Molino, D. González-Gálvez, G. Vilar, C. López-Iglesias, V. Ermini, et al. 2014. “In Vitro Toxicity of Functionalised Nanoclays Is Mainly Driven by the Presence of Organic Modifiers.” Nanotoxicology 8 (3): 279–294. doi:10.3109/17435390.2013.776123.
- Jensen, K. A., I. K. Koponen, P. A. Clausen, and T. Schneider. 2009. “Dustiness Behaviour of Loose and Compacted Bentonite and Organoclay Powders: What Is the Difference in Exposure Risk?” Journal of Nanoparticle Research 11 (1): 133–146. doi:10.1007/s11051-008-9420-1.
- Kato, T., T. Toyooka, Y. Ibuki, S. Masuda, M. Watanabe, and Y. Totsuka. 2017. “Effect of Physicochemical Character Differences on the Genotoxic Potency of Kaolin.” Genes and Environment 39 (1): 1–10. doi:10.1186/s41021-017-0075-y.
- Kyjovska, Z. O., N. R. Jacobsen, A. T. Saber, S. Bengtson, P. Jackson, H. Wallin, U. Vogel, et al. 2015. “DNA Damage Following Pulmonary Exposure by Instillation to Low Doses of Carbon Black (Printex 90) Nanoparticles in Mice.” Environmental and Molecular Mutagenesis 56 (1): 41–49. doi:10.1002/em.21888.
- Labib, S., A. Williams, C. L. Yauk, J. K. Nikota, H. Wallin, U. Vogel, S. Halappanavar, et al. 2016. “Nano-Risk Science: Application of Toxicogenomics in an Adverse Outcome Pathway Framework for Risk Assessment of Multi-Walled Carbon Nanotubes.” Particle and Fibre Toxicology 13 (1): 15. doi:10.1186/s12989-016-0125-9.
- Lordan, S., J. E. Kennedy, and C. L. Higginbotham. 2011. “Cytotoxic Effects Induced by Unmodified and Organically Modified Nanoclays in the Human Hepatic HepG2 Cell Line.” Journal of Applied Toxicology: JAT 31 (1): 27–35. doi:10.1002/jat.1564.
- Maisanaba, S., S. Pichardo, M. Puerto, D. Gutiérrez-Praena, A. M. Cameán, and A. Jos. 2015. “Toxicological Evaluation of Clay Minerals and Derived Nanocomposites: A Review.” Environmental Research 138: 233–254. doi:10.1016/j.envres.2014.12.024.
- Maxim, L. D., R. Niebo, and E. E. McConnell. 2016. “Bentonite Toxicology and Epidemiology – A Review.” Inhalation Toxicology 28 (13): 591–617. doi:10.1080/08958378.2016.1240727.
- Modrzynska, J., T. Berthing, G. Ravn-Haren, K. Kling, A. Mortensen, R. R. Rasmussen, E. H. Larsen, et al. 2018. “In Vivo-Induced Size Transformation of Cerium Oxide Nanoparticles in Both Lung and Liver Does Not Affect Long-Term Hepatic Accumulation Following Pulmonary Exposure.” PLoS One 13 (8): e0202477. doi:10.1371/journal.pone.0202477.
- Møller, P., D. V. Christophersen, D. M. Jensen, A. Kermanizadeh, M. Roursgaard, N. R. Jacobsen, J. G. Hemmingsen, et al. 2014. “Role of Oxidative Stress in Carbon Nanotube-Generated Health Effects.” Archives of Toxicology 88 (11): 1939–1964. doi:10.1007/s00204-014-1356-x.
- Nakanishi, J., Y. Morimoto, I. Ogura, N. Kobayashi, M. Naya, M. Ema, S. Endoh, et al. 2015. “Risk Assessment of the Carbon Nanotube Group.” Risk Analysis: An Official Publication of the Society for Risk Analysis 35 (10): 1940–1956. doi:10.1111/risa.12394.
- Patel, H. A., R. S. Somani, H. C. Bajaj, and R. V. Jasra. 2006. “Nanoclays for Polymer Nanocomposites, Paints, Inks, Greases and Cosmetics Formulations, Drug Delivery Vehicle and Waste Water Treatment.” Bulletin of Materials Science 29 (2): 133–145. doi:10.1007/BF02704606.
- Phibbs, B. P., R. E. Sundin, and R. S. Mitchell. 1971. “Silicosis in Wyoming Bentonite Workers.” The American Review of Respiratory Disease 103 (1): 1–17.
- Poulsen, S. S, et al. 2013. “Transcriptomic Analysis Reveals Novel Mechanistic Insight into Murine Biological Responses to Multi-Walled Carbon Nanotubes in Lungs and Cultured Lung Epithelial Cells.” PLoS One. 8 (11): 1–25. doi:10.1371/journal.pone.0080452.
- Poulsen, S. S., P. Jackson, K. Kling, K. B. Knudsen, V. Skaug, Z. O. Kyjovska, B. L. Thomsen, et al. 2016. “Multi-Walled Carbon Nanotube Physicochemical Properties Predict Pulmonary Inflammation and Genotoxicity.” Nanotoxicology 10 (9): 1263–1275. doi:10.1080/17435390.2016.1202351.
- Poulsen, S. S., K. B. Knudsen, P. Jackson, I. E. K. Weydahl, A. T. Saber, H. Wallin, U. Vogel, et al. 2017. “Multi-Walled Carbon Nanotubephysicochemical Properties Predict the Systemic Acute Phase Response Following Pulmonary Exposure in Mice.” PLoS One 12 (4): e0174167–26. doi:10.1371/journal.pone.0174167.
- Poulsen, S. S., A. T. Saber, A. Williams, O. Andersen, C. Købler, R. Atluri, M. E. Pozzebon, et al. 2015. “MWCNTs of Different Physicochemical Properties Cause Similar Inflammatory Responses, but Differences in Transcriptional and Histological Markers of Fibrosis in Mouse Lungs.” Toxicology and Applied Pharmacology 284 (1): 16–32. doi:10.1016/j.taap.2014.12.011.
- Ridker, P. M., C. H. Hennekens, J. E. Buring, and N. Rifai. 2000. “C-Reactive Protein and Other Markers of Inflammation in the Prediction of Cardiovascular Disease in Diabetes.” The New England Journal of Medicine 342 (12): 836–843. doi:10.1056/NEJM200003233421202.
- Rogers, A. B., and R. Z. Dintzis. 2012. “Liver and Gallbladder.” In Comparative Anatomy and Histology, edited by R. R. Maronpot, G. A. Boorman, and B. W. Gaul, 193–201. Elsevier Inc. doi:10.1016/B978-0-12-381361-9.00013-5.
- Saber, A. T.,.N. R..Jacobsen, P..Jackson, S. S..Poulsen, Z. O..Kyjovska, S. Halappanavar, C. L..Yauk, H..Wallin, and U..Vogel. 2014. “Particle-Induced Pulmonary Acute Phase Response May Be the Causal Link between Particle Inhalation and Cardiovascular Disease.” Wiley Interdisciplinary Reviews. Nanomedicine and Nanobiotechnology 6 (6): 517–531. doi:10.1002/wnan.1279.24920450.
- Saber, A. T., N. R. Jacobsen, A. Mortensen, J. Szarek, P. Jackson, A. M. Madsen, K. A. Jensen, et al. 2012. “Nanotitanium Dioxide Toxicity in Mouse Lung Is Reduced in Sanding Dust from Paint.” Particle and Fibre Toxicology 9 (1): 4. doi:10.1186/1743-8977-9-4.
- Saber, A. T., J. S. Lamson, N. R. Jacobsen, G. Ravn-Haren, K. S. Hougaard, A. N. Nyendi, P. Wahlberg, et al. 2013. “Particle-Induced Pulmonary Acute Phase Response Correlates with Neutrophil Influx Linking Inhaled Particles and Cardiovascular Risk.” PLoS One 8 (7): e69020. doi:10.1371/journal.pone.0069020.
- Sharma, A. K., B. Schmidt, H. Frandsen, N. R. Jacobsen, E. H. Larsen, and M.-L. Binderup. 2010. “Genotoxicity of Unmodified and Organo-Modified Montmorillonite.” Mutation Research/Genetic Toxicology and Environmental Mutagenesis 700 (1-2): 18–25. doi:10.1016/j.mrgentox.2010.04.021.
- Stueckle, T. A., D. C. Davidson, R. Derk, T. G. Kornberg, L. Battelli, S. Friend, M. Orandle, et al. 2018. “Short-Term Pulmonary Toxicity Assessment of Pre- and Post-Incinerated Organomodified Nanoclay in Mice.” ACS Nano 12 (3): 2292–2310. doi:10.1021/acsnano.7b07281.
- Świercz, R., T. Hałatek, J. Stetkiewicz, W. Wąsowicz, B. Kur, Z. Grzelińska, W. Majcherek, et al. 2013. “Toxic Effect in the Lungs of Rats after Inhalation Exposure to Benzalkonium Chloride.” International Journal of Occupational Medicine and Environmental Health 26 (4): 647–656. doi:10.2478/s13382-013-0137-8.
- Świercz, R., T. Hałatek, W. Wąsowicz, B. Kur, Z. Grzelińska, and W. Majcherek. 2008. “Pulmonary Irritation after Inhalation Exposure to Benzalkonium Chloride in Rats.” International Journal of Occupational Medicine and Environmental Health 21 (2): 157–163. doi:10.2478/v10001-008-0020-1.
- Thoolen, B., R. R. Maronpot, T. Harada, A. Nyska, C. Rousseaux, T. Nolte, D. E. Malarkey, et al. 2010. “Proliferative and Nonproliferative Lesions of the Rat and Mouse Hepatobiliary System.” Toxicologic Pathology 38 (7_suppl): 5S–81. doi:10.1177/0192623310386499.
- Valero-Mora, P. M. 2010. “ggplot2: Elegant Graphics for Data Analysis.” Journal of Statistical Software 35 (Book Review 1): 1–3. doi:10.18637/jss.v0b01.
- Wagner, A., A. P. White, T. A. Stueckle, D. Banerjee, K. A. Sierros, Y. Rojanasakul, S. Agarwal, et al. 2017. “Early Assessment and Correlations of Nanoclay’s Toxicity to Their Physical and Chemical Properties.” ACS Applied Materials & Interfaces 9 (37): 32323–32335. doi:10.1021/acsami.7b06657.
- White, P. A., G. R. Douglas, J. Gingerich, C. Parfett, P. Shwed, V. Seligy, L. Soper, et al. 2003. “Development and Characterization of a Stable Epithelial Cell Line from Muta Mouse lung.” Environmental and Molecular Mutagenesis 42 (3): 166–184. doi:10.1002/em.10185.
- Xi, Y., Z. Ding, H. He, and R. L. Frost. 2004. “Structure of Organoclays – An X-ray Diffraction and Thermogravimetric Analysis Study.” Journal of Colloid and Interface Science 277 (1): 116–120. doi:10.1016/j.jcis.2004.04.053.
- Xie, W., Z. Gao, W. -P. Pan, D. Hunter, A. Singh, and R. Vaia. 2001. “Thermal Degradation Chemistry of Alkyl Quaternary Ammonium Montmorillonite.” Chemistry of Materials 13 (9): 2979–2990. doi:10.1021/cm010305s.