
 ?Mathematical formulae have been encoded as MathML and are displayed in this HTML version using MathJax in order to improve their display. Uncheck the box to turn MathJax off. This feature requires Javascript. Click on a formula to zoom.
Abstract
Functionalized high-aspect-ratio silver nanowires (AgNWs) have been recognized as one of the most promising alternatives for fabricating products, with their use ranging from electronic devices to biomedical fields. Given concerns on the safety of AgNWs, there is an urgent need to investigate the relation between intrinsic properties of AgNWs and their toxicity. In this study, lettuce was exposed for either 6 or 18 d to different AgNWs to determine how the size/aspect ratio and coating of AgNWs affect the contributions of the dissolved and particulate Ag to the overall phytotoxicity and uptake kinetics. We found that the uncoated AgNW (39 nm diameter × 8.4 µm length) dissolved fastest of all AgNWs investigated. The phytotoxicity, uptake rate constants, and bioaccumulation factors of the PVP-coated AgNW (43 nm diameter × 1.8 µm length) and the uncoated AgNW (39 nm diameter × 8.4 µm length) were similar, and both were higher than that of the PVP-coated AgNW with the larger diameter(65 nm diameter × 4.4 µm length). These results showed that the diameter of the AgNWs predominantly affected toxicity and Ag accumulation in plants. Particulate Ag was found to be the predominant driver/descriptor of overall toxicity and Ag accumulation in the plants rather than dissolved Ag for all AgNWs tested. The relative contribution of dissolved versus particulate Ag to the overall effects was influenced by the exposure concentration and the extent of dissolution of AgNWs. This work highlights inherent particulate-dependent effects of AgNWs in plants and suggests that toxicokinetics should explicitly be considered for more nanomaterials and organisms, consequently providing more realistic input information for their environmental risk assessment.
1. Introduction
The widespread use of silver nanomaterials in products and applications has raised concerns about their potential side-effects on environmental and human health (Nel et al. Citation2006; Colvin Citation2003; Wiesner et al. Citation2006; Zhang and Wang Citation2019; Yang et al. Citation2017). Numerous investigations have reported adverse impacts on a range of endpoints of spherical-shaped silver nanomaterials to both aquatic and terrestrial organisms, including impacts on growth or reproductive inhibition, generation of ROS, alteration of enzyme expression, DNA damage, and genotoxicity (Tortella et al. Citation2020; Yan and Chen Citation2019; Lv, Christie, and Zhang Citation2019). High aspect ratio silver nanowires and silver nanotubes are also an active area for commercialization and nanotechnology research, given their superior electrical, plasmonic, optical, and antibacterial properties (Guan et al. Citation2018; Jones, Draheim, and Roldo Citation2018; Hu et al. Citation2010; Toybou et al. Citation2019).
To date, a very limited number of studies have discussed the biological effects of wire-shaped metallic nanomaterials on aquatic and terrestrial organisms. From those papers, morphological comparison studies of nanomaterials showed that the dissolution behavior and the biological effects of wire-shaped nanomaterials are distinctly different from the dissolution behavior and adverse effects of nanosphere or nanoplate analogues (Müller et al. Citation2010; George et al. Citation2012; Sohn et al. Citation2015; Nam and An Citation2019). Intrinsic properties such as size, surface chemistry, and charge of nanowires could play a key role in controlling their adverse effects to organisms, as has been widely confirmed by studies on spherical nanomaterials (Nam and An Citation2019; Majumdar et al. Citation2019; Riviere et al. Citation2018). To the best of our knowledge, less than 15 studies have been published in which the impact of physicochemical properties of nanowires on their toxic effects were examined. Based on these studies, aspect ratio and length seem to play a dominant role in regulating the adverse effects of nanowires. However, four contradictory patterns of toxicity have been reported;
higher aspect ratio and longer nanowires induced increased cytotoxic (Ji et al. Citation2012; Bianchi et al. Citation2020; Kuo et al. Citation2007; Park et al. Citation2015), or;
lower aspect ratio and shorter nanowires induced higher toxicity to daphnia (Scanlan et al. Citation2013; Toybou et al. Citation2019), or;
shorter nanowires presented more cytotoxicity than the longer nanowires without a consistent aspect ratio dependent pattern (Wang et al. Citation2019), or;
the length and aspect ratio do not affect toxicity (Safi et al. Citation2011; Moon, Kwak, and An Citation2019; Qiu et al. Citation2010).
Moreover, surface coating can affect the dissolution and the stability or aggregation of nanomaterials, which in turn may modulate the adverse effects of nanomaterials to organisms (Navarro et al. Citation2015). So far, most studies on nanowires concentrated on in vitro cytotoxicity and no studies on the effects of size/aspect ratio and coating of nanowires on plants are available. In addition, numerous studies suggested that the toxicity of silver nanospheres to aquatic and terrestrial organisms can be attributed to the release of ions from NPs (Zhang and Wang Citation2019; Navarro et al. Citation2015). However, our previous results showed that particulate Ag dominates phytotoxicity (Wu et al. Citation2020). Given the importance of shape, it is therefore key to better understand whether the toxicity of silver nanowires suspension is exerted by nano-particulate Ag or by the released ionic Ag.
Extensive research on Ag nanospheres suggests that bioaccumulation of AgNPs is a determinant for their toxicological effects (Ivask et al. Citation2014). Importantly, previous studies showed that the cellular uptake of gold nanowires by mammalian cells (Devika Chithrani, Ghazani, and Chan Citation2006; Qiu et al. Citation2010) and silver nanowires by daphnids (Scanlan et al. Citation2013; Chae and An Citation2016) were affected by their aspect ratio and length. To the best of our knowledge, there is currently no data are available on the bioaccumulation and phytotoxicity of AgNWs in terrestrial plants. Moreover, toxicokinetic and toxicodynamic models for nanomaterials have placed considerable emphasis on tracing metal accumulation in organisms in order to interpret their toxicological effects. Some studies have reported on parameters associated with uptake biokinetics of metal nanomaterials (e.g. uptake and elimination rate constant, as well as bioaccumulation factor) (Fan, Lu, and Wang Citation2018; Jiang et al. Citation2017; Shao and Wang Citation2020). However, in most cases the measurements performed within these studies focused on total metal concentrations of metallic nanomaterials (particulate plus dissolved form), which prevents differentiating between the relative contributions of dissolved and particulate Ag to the phytotoxicity and toxicokinetics of AgNWs. It is critical to collect this data, as distinguishing the dissolved metal concentration and particulate concentration could increase the accuracy of quantification of kinetics parameters of soluble metallic nanomaterials (Dang et al. Citation2020). This would help to provide more accurate understanding of the particle-specific accumulation of nanomaterials in plants. However, currently it remains unclear whether the inherent properties of AgNWs not only influence dissolution but also the uptake kinetics of AgNWs in plants. Plants, which play a vital role in providing ecosystems services and form the base of most food webs, are likely exposed to silver nanomaterials via air, soil and water (Wu et al. Citation2020). Therefore, much more efforts in exploring the adverse impacts of silver nanowires on plants are necessary.
This study therefore aims to (i) investigate the importance of the physicochemical properties of AgNWs on their toxicity and on the uptake of Ag in higher plants, and (ii) to distinguish the corresponding relative contribution to suspension toxicity and Ag accumulation of ionic and particulate Ag present in suspensions. To this end, the widely cultivated vegetable lettuce (Lactuca sativa) was exposed to a series of concentrations of different types of silver nanowires and ionic Ag in hydroponic systems for 6 d to generate dose-toxic response curves. Subsequently, the EC25 level for each of the AgNWs was selected as the exposure concentration to quantify the biokinetics parameters of Ag uptake in plants after 18 d of exposure. Since there are limited data available on the uptake and toxicity of Ag nanowires in higher plants, this study facilitates the establishment of toxicokinetic models to describe the accumulation of silver nanowires in higher plants.
2. Materials and methods
2.1. AgNW suspensions: preparation and characterization
AgNO3 was obtained from Sigma-Aldrich (Zwijndrecht, the Netherlands). Original stock suspensions of polyvinylpyrrolidone (PVP) coated low aspect ratio AgNW (LAR-AgNW:43 nm diameter × 1.8 µm length) and medium aspect ratio AgNW (MAR-AgNW: 65 nm diameter × 4.4 µm length) were purchased from Nanogap (Milladoiro, Spain). Noteworthily, the PVP used in the two PVP-coated AgNWs was of the same composition and the same method and the same materials were used to coat the two nanowires. This means that there are no differences in the nature and the thickness of the PVP-coating between the two tested PVP-coated AgNWs. The uncoated high aspect ratio AgNWs (HAR-AgNW: 39 nm diameter × 8.4 µm length) were purchased from Ras-Ag (Regensburg, Germany). All original stock suspensions of AgNWs were stored at 4 °C in the dark. The actual silver concentrations of the original stock AgNWs suspensions were measured in triplicate by means of Atomic Absorption Spectroscopy (AAS, PerkinElmer 1100 B, Waltham, MA, USA). Taking aliquots from the original stock AgNWs suspensions was always performed under a nitrogen atmosphere. Suspensions of AgNWs dispersed in 1/4 Hoagland solution (pH 6.0 ± 0.1) with a concentration of 50 mg/L were used to determine the actual size and shape by Transmission Electron Microscopy (TEM, JEOL 1010, JEOL Ltd., Tokyo, Japan) after sonication for 10 min. The composition of the Hoagland solution is described in Table S1, Supporting Information. The surface area and volume of the AgNWs were calculated assuming that the AgNWs possessed a perfect cylindrical structure. The basic physicochemical data of the three AgNWs are presented in Supporting Information Table S2. The results discussed in this study are based on actually measured data and all data obtained from the TEM excluded the PVP coating.
2.2. AgNWs dissolution testing
The dissolution kinetics of suspensions of the AgNWs were monitored over 72 h at the concentrations equaling the EC25 level of each AgNW. The dissolution experiments were conducted under the same conditions as used in the toxicity and uptake experiments but without plants to avoid underestimation due to the uptake of dissolved Ag by plants. For each AgNW suspension, 6 mL aliquots dispersed in 1/4 Hoagland solution for 1, 6, 12, 24, 48, and 72 h were collected in duplicate from the top 8 cm of the tubes. One of these sample was digested for at least 3 d at room temperature by addition of a few drops of concentrated nitric acid (65%) to determine the total concentration of AgNWs in the suspension (defined as AgNWs(total) hereafter). The other aliquot was centrifuged at 30 392 g for 30 min at 4 °C (Sorvall RC5Bplus centrifuge, Bleiswijk, Netherlands) and subsequently the supernatants were filtered via a syringe filter of 0.02 µm pore diameter (Anotop 25, Whatman, Eindhoven, The Netherlands). The obtained solutions represented the concentration of dissolved Ag in the suspensions (defined as AgNWs(dissolved)), as determined using AAS after addition of a few drops of concentrated HNO3. The particulate Ag concentrations were obtained as a function of exposure time by calculating the difference between AgNWs(total) and AgNWs(dissolved) at each timepoint. The assessments of the dissolution of each AgNW at each timepoint were performed in triplicate.
2.3. Plant pre-culture and toxicity assay
Lactuca sativa seeds obtained from Floveg GmbH (Kall, Germany) were sterilized with NaClO (0.5% w/v) for 15 min and cleaned with deionized tap water. After immersion in deionized water for 24 h, 15 seeds were germinated and grown in a Petri-dish containing 1/8 Hoagland solution for 2 weeks. The young seedlings were then transferred to tubes (one seedling per tube) with 22 mL of 1/4 Hoagland solution, and left to grow 7 d before being exposed to AgNWs. All experiments were performed in a climate room with 16/8 h of light/darkness and 60% relative humidity at a 20/16 °C day/night temperature regime.
The toxicity tests in this study were carried out to establish the dose response curves of the AgNWs. The EC50 and EC25 values were calculated to compare the toxicity of the three AgNWs. Briefly, a series of actual exposure concentrations ranging from 0.006 to 3.94 (LAR-AgNW(total)), 3.92 (MAR-AgNW(total)), or 4.48 mg/L (HAR-AgNW(total)) were prepared in 1/4 Hoagland solution of exposure groups containing uniform pre-grown seedlings. Exposure concentrations of Ag-ions (ranging from 0.005 to 0.80 mg/L) were used as a reference to obtain the dose-response curve of the ions (AgNWs(dissolved)) released from the AgNWs in suspension. After exposure for 6 d, the biomass of the plants was recorded after the plants were washed thoroughly with deionized tap water and air-dried for 4 h. The tubes used in this study were covered with aluminum foil and the medium was refreshed every 3 d. All treatments, including the control, were exposed for 6 d in quadruplicate at the same conditions of plants pre-growth.
2.4. Uptake experiments of AgNWs and dissolved Ag in plants
The EC25 level of each AgNW(total) based on the toxicity experiments described above, was selected to perform the uptake experiments of AgNWs in plants over 18 d. Dispersing the AgNWs into 1/4 Hoagland solution results in a mixture of particulate Ag and dissolved Ag ions which changes over time due to sedimentation of particle agglomerates and continuous dissolution of Ag-ions. Thus, in addition to exposure experiments with AgNWs suspensions, dissolved Ag exposure experiments using AgNO3 were performed separately to obtain the relevant toxicity and uptake information about the dissolved ionic Ag. To study this, time weighted average (TWA) concentrations of ionic Ag at corresponding exposure time-points obtained from the dissolution kinetic experiments of AgNWs, were selected as the exposure concentrations. The exposure experiments were performed using the same protocol as in the aforementioned toxicity experiments. One tube contained one plant, with three replicates per treatment. Ag-spiked 1/4 Hoagland solutions were refreshed every 3 d for a total of 18 d. At each exposure time point of 0.25, 0.5 1, 2, 3, 6, 9, 12, and 18 d, plants were collected to determine the Ag content in plant tissues.
After harvesting of the plants from each exposure period, the whole plants were immersed in 10 mM HNO3 for 30 min, transferred into 10 mM EDTA (Ethylenediaminetetraacetic acid) for 30 min, and finally thoroughly rinsed with Milli-Q water to remove the strongly attached AgNWs/Ag-ions. Subsequently, the plants were divided into the root and shoot and oven-dried for at least 72 h at 70 °C. After determining the dry biomass of roots and shoots, the samples were digested by adding 6 mL of concentrated HNO3 for 1 h at 120 °C, followed by adding 2 mL of H2O2 at 120 °C until the solutions were clear. Finally, the digest solutions were diluted by adding deionized water to a final volume of 3 mL and the concentrations of Ag were subsequently analyzed using AAS. For quality control, blanks containing Ag standard solution were digested with the same digestion procedure as used for the plants. Standard solutions of Ag at 0.5 mg/L were monitored every 20 samples to examine the stability of the machine. The exposure concentrations of each refreshed batch were determined, and the standard deviations were less than 5%.
2.5. Data analysis
As Ag-ions are continuously released from AgNWs and the particulate Ag will sediment into the bottom of tubes, the exposure concentration of each AgNW and of the corresponding dissolved ions changes over time. The TWA method can catch the dynamic changes of NMs associated with exposure conditions and offers a more accurate and naturally relevant expression of the actual effective exposure of organisms to NMs than when using the static initial exposure concentrations (Zhai et al. Citation2017). Therefore, the expression of the exposure concentrations of AgNWs(total), AgNWs(particulate), and AgNWs(dissolved) was based on the time weighted average (TWA) concentration for each exposure period instead of expressing the exposure concentration by means of the initially measured concentrations. The TWA concentrations can be calculated according to the following equation:
(1)
(1)
where
n is the time interval number, N is the total number of intervals,
is the time interval, C is the concentration at the end of the time interval.
A first order kinetics equation was used to model the sedimentation process of AgNWs:
(2)
(2)
The increase of the concentration of dissolved Ag released from each AgNW in 1/4 Hoagland solution followed first order kinetics:
(3)
(3)
Incorporation of the size and length of AgNWs, the dissolution of each AgNW in 1/4 Hoagland solution can be described as follows:
(4)
(4)
where
and
are the concentration of dissolved Ag-ions and particulate Ag at a given point in time with the units of mg/L, P1 and P2 are the concentration of particulate Ag and dissolved Ag-ions at equilibrium; Kd and KS is the first-order rate constants of dissolution and sedimentation (d−1), respectively. N0 is number of AgNWs present in one liter of suspension at t = 0 (1/L, N0=
). V is the volume of AgNWs (µm3). A is the area of the AgNWs (µm2). R is the mean radius of AgNWs (nm). L is the mean length of the AgNWs (µm). KD is the dissolution rate constant of AgNWs (ng/cm2/h).
and time t were measured experimentally. Thus, the rate constants can be calculated by fitting EquationEquations (2)–
(2)
(2) Equation(4)
(4)
(4) .
The decrease of biomass of plants exposed to each AgNW suspension is induced by particulate and dissolved Ag together, with the modes of action widely believed to be independent. The response addition model is therefore used to calculated the relative contributions of particulate Ag and dissolved Ag in AgNWs suspensions to the observed toxicity (Liu et al. Citation2016; Zhai et al. Citation2016):
(5)
(5)
where E(total) represents the biomass decrease caused by the suspension of AgNWs as quantified experimentally. E(dissolved) is the decrease of biomass induced by ionic Ag present in the AgNWs suspension as calculated based on the dose-response curve of AgNO3 toward lettuce biomass decrease. The biomass decrease caused by the particulate Ag in AgNWs can be calculated directly as E(particulate) is the only unknown in the equation.
The concentrations of EC25 and EC50 for biomass decrease of plants exposed to three kinds of AgNWs(total), AgNWs(particulate), and ionic Ag were calculated with the dose-response-inhibition model in GraphPad using TWA and initial exposure concentrations, respectively.
The mass of Ag accumulated in plants tissues exposed to each AgNW and the corresponding dissolved Ag-ions over time can be described by EquationEquation (6)(6)
(6) :
(6)
(6)
where Ku and Ke are the uptake rate constant (d−1) and elimination rate constant (d−1) of Ag from AgNWs(total), AgNWs(particulate), and the corresponding dissolved Ag, respectively.
Since at the initial phase of the accumulation process the uptake rate is expected to be much faster than the elimination rate, the elimination of Ag was assumed to be negligible, and EquationEquation (6)(6)
(6) was simplified into
(7)
(7)
Integration of this differential equation leads to EquationEquation (8)(8)
(8) :
(8)
(8)
where
is the mass of Ag accumulated in plant tissues (µg/plant),
is the exposure content of AgNWs(total), AgNWs(particulate), and the corresponding dissolved Ag-ions (µg), respectively. Ku is the uptake rate constant. The dynamic changes of exposure concentrations of AgNWs(total), AgNWs(particulate), and AgNWs(dissolved) should be considered when fitting this model. Thus, the uptake rate constant of AgNWs(total), AgNWs(particulate), and AgNWs(dissolved) from each AgNW were obtained by fitting EquationEquation (8)
(8)
(8) to the measured Ag content in plants and TWA exposure content of AgNWs(total), AgNWs(particulate), and AgNWs(dissolved) at each time point ranging from 1 h to 3 d.
The Ag bioaccumulation factor (BAF) was calculated using the following equation:
(9)
(9)
where [Ag]plant, the content of Ag in the plants (µg/plant), and [Ag]medium, the content of Ag in the exposure medium (µg), were obtained experimentally.
The Ag translocation factor (TF), defined to evaluate the capacity of plants to transfer Ag from roots to the shoots, was calculated as follows:
(10)
(10)
where [Ag]shoots and [Ag]root represent the Ag content in plant shoot tissues and root tissues (µg/plant), respectively.
The differences for EC25, EC50, and toxicokinetic parameters of accumulation of Ag among the different AgNWs were analyzed for significance using one-way ANOVA followed by Turkey’s honestly significant difference tests at α < 0.05 using IBM SPSS Statistics 25. The Shapiro-Wilk test was used to check for normality and the Bartlett test for homogeneity of the variance of the data, with no deviations found for both. All results are expressed as mean ± standard error, based on four replicates for biomass decrease and three replicates for Ag bioaccumulation.
3. Results
3.1. TEM characterization and dissolution behavior of AgNWs
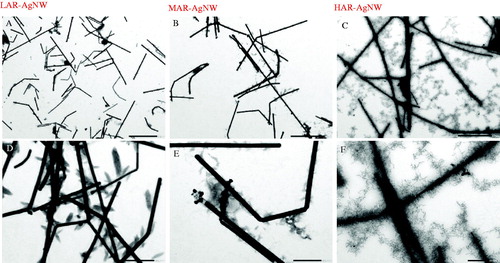
The TEM pictures confirmed that the shapes of the three types of Ag nanomaterials used in this study were wire-like and that the diameters were in agreement with the information provided by the producer (Supporting Information Table S2 and ). However, the length of MAR-AgNW and HAR-AgNW, as determined by TEM, was much shorter than indicated by the producer. Based on these values, the surface area of three AgNWs followed the order of HAR-AgNW > MAR-AgNW > LAR-AgNW (Supporting Information Table S2). No obvious aggregation was observed for the three types of freshly prepared AgNWs in the exposure medium based on at least 10 TEM images for each AgNW.
Figure 1. TEM images of AgNWs after 1 h of incubation in the exposure medium (scale bar for A, B, and C: 200 µm; scale bar for D, E, and F: 500 nm). LAR-AgNW: 43 nm diameter × 1.8 µm, PVP-coated, MAR-AgNW: 65 nm diameter × 4.4 µm, PVP coated, HAR-AgNW: 39 nm diameter × 8.4 µm, uncoated.
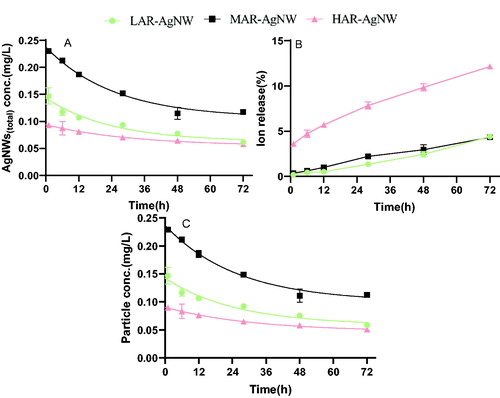
As shown in , the dissolution behavior of the NWs over time was different across the different types of AgNW. The percentage of AgNW(dissolved) (calculated using [Ag]dissolved/[Ag]total) increased by 4.2%, 3.9%, and 8.5% for LAR-AgNW, MAR-AgNW, and HAR-AgNW respectively, after incubation in 1/4 Hoagland solution from 1 to 72 h. The dissolution extent of HAR-AgNW was 8% higher than that of LAR-AgNW and MAR-AgNW (). Similarly, the dissolution rate constant, Kd, of uncoated HAR-AgNW was slightly higher than the dissolution rate constant of PVP-coated LAR-AgNW and MAR-AgNW (Supporting Information Table S3). However, once incorporated the surface area of AgNWs to model the dissolution rate constant, the KD of HAR-AgNW was the lowest (Supporting Information Table S3). Even though the initial exposure concentration of MAR-AgNW was a bit higher than that of LAR-AgNW, their sedimentation rate constants were similar (Supporting Information Table S3).
Figure 2. Ion release profiles of AgNWs suspensions at the EC25 level in the exposure medium over time. (A) Total Ag concentrations in the AgNW suspensions. (B) Percentage of dissolved Ag released in the AgNW suspensions, (C) particulate Ag concentrations in AgNWs suspensions. Data are mean ± SE (N = 3). (LAR-AgNW: 43 nm diameter × 1.8 µm, PVP-coated, MAR-AgNW: 65 nm diameter × 4.4 µm, PVP coated, HAR-AgNW: 39 nm diameter × 8.4 µm, uncoated.)
3.2. Acute toxicity of AgNWs and AgNO3 to Lactuca sativa
The dose-reponse curves of plants exposed to the different kinds of AgNWs and ionic Ag for 6 d show that both AgNWs and ionic Ag can induce significant toxicity to plants, decreasing the biomass of plants as a function of increasing exposure concentrations of suspensions of Ag-species ( and Supporting Information ). Based on the dose-response curves, the effect concentrations (EC) of AgNWs(total) and their corresponding AgNWs(particulate) causing 25% (EC25) and 50% (EC50) inhibition of plant growth were calculated. The EC25 (0.07 mg/L) and EC50 (0.15 mg/L) values based on TWA exposure concentrations of Ag-ions were about 1.3–2.4 fold and 2.1–3.3 fold lower than the corresponding effect levels of the AgNWs tested, respectively, indicating that Ag-ions were the most toxic to lettuce.
Figure 3. Dose–response curves of biomass decrease of Lactuca sativa exposed to different concentrations of (A) AgNWs(total) and AgNO3, and (B) AgNWs(particulate) expressed as time weighted concentrations. Data are mean ± SE (N = 3). (LAR-AgNW: 43 nm diameter × 1.8 µm, PVP-coated, MAR-AgNW: 65 nm diameter × 4.4 µm, PVP coated, HAR-AgNW: 39 nm diameter × 8.4 µm, uncoated.)
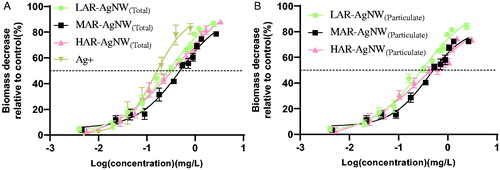
We also investigated differences in toxicity among different kinds of AgNWs to plants on the basis of total Ag. The relative EC50 values based on AgNWs(total) was significantly higher for MAR-AgNW compared to LAR-AgNW and HAR-AgNW, which had a comparable EC50 value to each other (LAR-AgNW ≈ HAR-AgNW < MAR-AgNW), regardless of the way in which EC50 was expressed (ANOVA, CTWA vs. CI, P = 0.008 vs. 0.016, ). This suggests that the suspensions of LAR-AgNW and HAR-AgNW induced higher toxicity than suspensions of MAR-AgNW. Importantly, when expressed as AgNWs(particulate), no significant differences were observed for the EC50 values among the three AgNWs tested (ANOVA, P = 0.135 for CTWA and P = 0.287 for CI, ). In addition, the EC25 values of AgNW(total) (ANOVA, P = 0.003) and AgNW(particulate) (ANOVA, P = 0.022) for both LAR-AgNW and HAR-AgNW were significantly lower than the corresponding values of MAR-AgNW regardless of the way in which EC25 was expressed. This indicates that the effects of aspect ratio and coating of AgNWs on the phytotoxicity were more obvious at low effective concentration levels.
Table 1. The EC25 and EC50 values of AgNWs(total) and AgNWs(particulate) expressed as initial concentrations and expressed as time weighted average concentrations.
3.3. Bioaccumulation kinetics and translocation of AgNWs and dissolved Ag in plant tissues
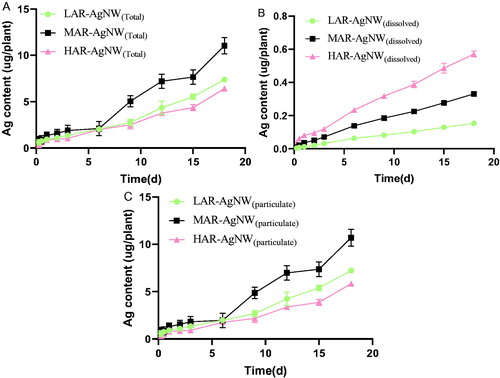
After 18 d, the Ag content in control plants was below detection limit. The mass of silver accumulated in plants was positively correlated with exposure time regardless of AgNW type or Ag-form. After exposure to the suspensions of LAR-AgNW, MAR-AgNW, and HAR-AgNW at the EC25 level for 18 d, the content of Ag in the plants increased to 7.5, 11.1, and 6.5 µg/plant, which was respectively 50, 33, and 11 times higher compared to the corresponding amount of dissolved Ag released from the AgNWs at the EC25 value (). This suggests particulate-specific uptake of Ag for all three AgNWs tested. According to Supporting Information Table S4, exposure time had no significant effect on the BAFs values of AgNWs(total), AgNWs(particulate), and AgNWs(dissolved) for all AgNWs after exposure for more than 9 d (ANOVA, P > 0.25, Supporting Information Table S4).
Figure 4. Measured Ag uptake in Lactuca sativa exposed to different (A) AgNWs suspension, (B) the particulate Ag, and (C) the corresponding concentrations of dissolved Ag at EC25 level over 18 d. Data are mean ± SE (N = 3). (LAR-AgNW: 43 nm diameter × 1.8 µm, PVP-coated, MAR-AgNW: 65 nm diameter × 4.4 µm, PVP coated, HAR-AgNW: 39 nm diameter × 8.4 µm, uncoated.)
One compartment toxicokinetic models were applied to simulate the uptake process of AgNWs and dissolved Ag into plants after18 d of exposure, after which the estimated biokinetic parameters were derived. Regarding the biokinetic parameters of AgNWs(total) and AgNWs(particulate) for the same Ag nanowire, the values of Ku and BAF for AgNWs(total) and the particulate Ag form were similar regardless of the AgNWs type (ANOVA, P > 0.05, ). In addition, Ku and BAF values for AgNWs(dissolved) were much higher than the corresponding values for AgNWs(total) and AgNWs(particulate) (ANOVA, P < 0.033, ), respectively. This indicates that the accumulation of Ag-ions in plants is faster and more efficient compared to particulate Ag.
Table 2. Uptake rate constants, BAFs, and TFs for Lactuca sativa exposed to different AgNWs at EC25 level over 18 d.
Meanwhile, the type of AgNW was found to have a significant effect on the bioaccumulation process as the Ku and BAF values of MAR-AgNW(particulate) were much lower compared to LAR-AgNW(particulate) and HAR-AgNW(particulate) (ANOVA, P < 0.05). Furthermore, the Ag content in plant shoots was only detectable for the AgNWs(total) groups exposed for more than 9 d. However, the transfer factors for all treatments were less than 0.02, suggesting that a major portion of the Ag remained in the plant roots. In addition, all type of AgNWs (ANOVA, P = 0.055, ) and exposure time (ANOVA, P = 0.117, ) did not significantly influence the Ag translocation from roots to shoots.
3.4. Relative contribution of dissolved Ag and particulate Ag to toxicity and Ag uptake in plants
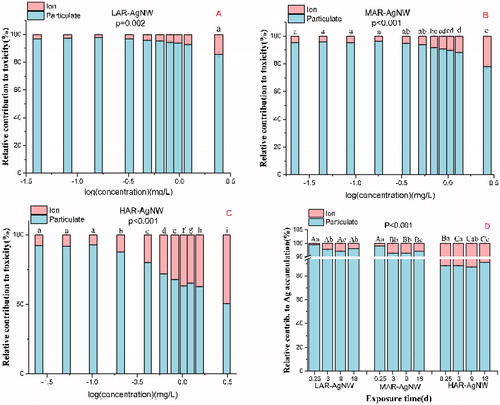
In general, the dominant role of AgNWs(particulate) to the overall toxicity relative to the corresponding dissolved Ag was observed in all exposure cases (). In addition, exposure concentrations were found to have a significant impact on the relative contribution of AgNWs(particulate) to the overall toxicity regardless of the type of AgNWs exposed. For instance, the relative contributions of AgNWs(dissolved) to the overall suspension toxicity were found to increase by 11.1%, 17.2%, and 41.5% for LAR-AgNW, MAR-AgNW, and HAR-AgNW when the exposure concentrations increased from 0.04, 0.02, and 0.03 to 2.42, 2.71, and 3.39 mg/L, respectively. Therefore, the relative contribution of HAR-AgNW(dissolved) to toxicity at high concentrations was much higher than that of LAR-AgNW(dissolved) and MAR-AgNW(dissolved) (ANOVA, P < 0.001, ). Similarly, uptake of AgNWs(particulate) dominated the contribution to overall Ag accumulation in plants compared to the uptake of AgNWs(dissolved) for all AgNWs tested as the contribution of the NWs accounted for more than 85% of the Ag accumulation in the plants. Additionally, the relative contributions of AgNWs(dissolved) increased significantly after exposure from 0.25 to 3 d and then tended to be stable for LAR-AgNW and MAR-AgNW (P < 0.001, ). Among the three types of AgNWs, the HAR-AgNW(dissolved) contributed most to the overall Ag accumulation in plants with a contribution of about 10% at the EC25 exposure level for 18 d, which was much higher than that of LAR-AgNW(dissolved) (2%) and HAR-AgNW(dissolved) (3%) (ANOVA, P < 0.001, ).
Figure 5. Relative contribution (%) of different AgNWs(particle) and AgNWs(ion) to toxicity at different concentrations (A, B, and C), and to Ag accumulation at EC25 concentrations for different exposure time (D). The data represent the mean ± SE (n = 3). The different letters in the same group indicate statistically significant differences between treatments at p < 0.05.
4. Discussion
4.1. Dissolution behavior of AgNWs
Our results showed that the dissolution of uncoated HAR-AgNW was much higher compared to PVP-coated AgNWs with lower aspect ratio values (LAR-AgNW and MAR-AgNW). The dissolution rate constants (h−1) of AgNWs was observed to follow the order of HAR-AgNW > MAR-AgNW > LAR-AgNW. Scanlan et al. (Citation2013) made the generic statement that dissolution increases for short AgNWs with a low aspect ratio compared to longer AgNWs with a higher aspect ratio in EPA media. The discrepancy with our results suggests that restricting or placing too much focus on aspect ratio for toxicity assessment is not giving the full picture. A larger surface area of nanomaterials can increase the contact between NMs and the oxidant, thereby accelerating the dissolution (Sohn et al. Citation2015). Although the surface area of HAR-AgNW was larger compared to LAR-AgNW and MAR-AgNW, the dissolution rate constant (ng/cm2/h) which incorporated the surface area of AgNWs was lowest for HAR-AgNW (LAR-AgNW ≈ MAR-AgNW > HAR-AgNW, Supporting Information Table S3). This indicates that the dissolution behaviors of AgNWs in this study cannot be explained by the larger surface area only. Therefore, we postulate that the differences in dissolution kinetics of HAR-AgNW compared to LAR-AgNW and MAR-AgNW were due to the absence of PVP-coating on HAR-AgNW. This suggests that a PVP-coating largely played a role with regard to the dissolution behaviors in the current study and was more important than the dimensions of AgNWs. In addition, the dissolution of AgNWs in the present study was found to be less than 15%, which was much lower than the extent of Ag released from Ag nanospheres (about 30%) obtained by our previous study under similar exposure conditions (Wu et al. Citation2020). This was consistent with the findings that spherical AgNPs displayed highest dissolution, followed by Ag nanocubes and AgNWs (Gorka and Liu Citation2016), confirming that the dissolution of AgNMs is shape-dependent.
4.2. Coating related factors cannot fully explain toxicity differences among AgNWs
All three AgNWs suspensions tested in this study inhibited the growth of plants significantly with the EC50 values ranging from 0.32 to 0.49 mg/L expressed on TWA basis (compared to 0.52 to 0.71 mg/L expressed as the initial concentrations). Comparison of the toxicity levels deduced for the three AgNWs tested suggests that a low aspect ratio and a lack of coating of AgNWs are slightly more toxic than high aspect ratio and PVP-coated AgNWs. This finding is consistent with the results of Scanlan et al. (Citation2013), who concluded that short AgNWs with low aspect ratio exhibited higher toxicity compared to long AgNWs with high aspect ratio. However, Chae and An (Citation2016) reported that larger and longer PVP-coated AgNWs dispersed in TAP medium exhibited greater toxicity to algae than the smaller and shorter ones. These apparent contradictions indicate that the impacts of AgNWs characteristics on their toxicity can also depend on the test species and/or the chemistry of the exposure medium. An important goal of PVP-coating is to promote the dispersion and to reduce the agglomeration of nanomaterials (Butz et al. Citation2019; Torrent et al. Citation2020; Akter et al. Citation2018), which in turn affects their toxicity as sedimentation and aggregation can contribute to reduced toxicity (Li, Lenhart, and Walker Citation2012; Römer et al. Citation2011). However, in the current study we found that the sedimentation of PVP-coated LAR-AgNW and MAR-AgNW was similar, and both sedimentation rate constants were higher than the sedimentation rate constants of uncoated HAR-AgNW ( and Supporting Information Table S3), whereas the toxicity of MAR-AgNW was lowest. In addition, the higher toxicity of uncoated nanomaterials has been commonly attributed to their faster dissolution (Li et al. Citation2012; Yang et al. Citation2012; Nguyen et al. Citation2013). However, the toxicity of LAR-AgNW and HAR-AgNW was comparable, while the dissolution of HAR-AgNW was significantly increased compared to LAR-AgNW. Our results indicate that the sedimentation and dissolution of AgNWs associated with the lack of coating may not be indicative of their phytotoxicity.
4.3. Accumulation kinetics of AgNWs and dissolved Ag
All three AgNWs suspensions induced Ag uptake in plants roots. Contaminants can be taken up by plant roots via apoplastic transport through the intracellular spaces of adjacent cells along cell walls and via symplastic/transmembrane pathway through plasmodesmata/cell membranes between cells (Miller et al. Citation2016; Medina-Velo, Peralta-Videa, and Gardea-Torresdey Citation2017). In this study, Ag uptake via the plant roots was rapid and equilibrium was reached quickly. In addition, the data of AgNWs accumulation in plant roots fitted the one-compartment kinetic model well (R2 > 0.9). Taken together, these results indicate that in our study apoplastic transport was likely the major pathway for the uptake of Ag by plant roots after AgNWs adhere to the root epidermis. The limited translocation of Ag from roots to shoots in all AgNWs exposure treatments further confirmed this, as it is difficult for materials taken up by the apoplastic pathway to cross the casparian strip (a barrier limits the entrance of substances to xylem or phloem) and thus cannot be transported into the above-ground parts. Wang et al. (Citation2012) also confirmed that CuO NPs pass through the epidermis into root tissues via the apoplastic route. All toxicokinetic parameters of dissolved Ag were much higher than those of AgNWs(particulate), demonstrating that the accumulation of Ag-ions in plants proceeds much faster than accumulation of particulate Ag. This implies that dissolved Ag is more bioavailable than particulate Ag.
Among the three types of AgNWs tested, the uptake rate constants and BAFs of both AgNWs(total) and AgNWs(particulate) followed the order of LAR-AgNW (PVP-coated) ≈ HAR-AgNW (uncoated) > MAR-AgNW (PVP-coated). As the LAR-AgNW and HAR-AgNW have a similar diameter but different length and coating, this result suggests that the dimension, more specifically, the diameter of AgNWs is the dominant factor related to their cellular uptake. The AgNMs with smaller diameter might easier pass through the pores in/between cell walls due to the size exclusion limit of cell walls and/or apoplast (Schwab et al. Citation2016). Torrent et al. (Citation2020) showed that silver nanospheres accumulated in lettuces, and that accumulation was diameter (size) dependent, but coating independent, which is in line with our findings. Previous studies of wire-shaped nanomaterials are shown to behave totally different compared to the results found in our study – but it should be noted that those were all conducted on non-flora species. For example, the cellular uptake of Au nanowires in MCF-7 (Qiu et al. Citation2010) and HeLa (Chithrani, Ghazani, and Chan Citation2006) cells, of Ag nanowires in daphnids (Scanlan et al. Citation2013), and of Fe nanowires in HeLa cells (Song et al. Citation2010) and NIH/3T3 fibroblast cells (Safi et al. Citation2011) was length dependent: shorter NWs are more likely to be taken up compared with longer ones in generally. However, from our results, no definite dependency on length-specific uptake of AgNWs in plants can be concluded. Our results highlight that interaction between metal-based NMs and plants should consider the combined effects of diameter, length, shape, and surface chemistry.
4.4. Particulate Ag-dominant effects
Ionic Ag was more toxic in comparison to all AgNWs (see EC50 values) when plants were exposed to an equal dose of total Ag. A great number of studies (based on silver, zinc, copper, gold, iron, and nickel-based nanomaterials) suggested that the toxicity of metal-based nanomaterials is mainly driven by the dissolved ions shed from the particulate form. However, following exposure to the specific amount of Ag-ions which corresponded to the amount released from metallic NMs, toxicity originating from the nanoform rather than from the ionic Ag present in suspension has also been confirmed (Gorka and Liu Citation2016). The dominant contribution of particulate Ag to the overall toxicity of AgNWs was also found in this study on the basis of assessing the relative contributions of particulate Ag and the corresponding dissolved Ag to the reduction of plants biomass. The almost similar EC50 values of AgNWs(total) and AgNWs(particulate) also revealed that the particulate Ag was the major source of toxicity of AgNWs. Similar particulate-originated toxicity was observed following exposure of algae to PVP-AgNWs as the dissolved concentration of Ag, as released from the AgNWs, was below 0.05 ppm (Chae and An Citation2016). In addition, our previous study in which we exposed lettuce to spherical AgNPs at similar conditions as employed in the current study, also verified the particle-ruling toxicity (Wu et al. Citation2020). Gorka and Liu (Citation2016) also suggested that the toxicity observed for Lolium multiflorum cannot be explained by ionic silver solely when the plants are exposed to AgNWs, AgNPs and Ag nanocubes. The similar contribution of particulate Ag among different shapes of Ag nanomaterials confirms that the dominant role of particles in suspension toxicity of Ag materials to higher plants is shape-independent.
For the accumulation experiments, the exposure concentrations of dissolved Ag at each time point were comparable to the TWA concentrations of dissolved Ag released from each AgNWs at the EC25 level at the same exposure time. The dominant contribution patterns of AgNWs(particulate) to the total Ag accumulation in plants were similar to the contribution of AgNWs(particulate) to the overall toxicity. The similar patterns strongly indicate that a relationship between the phytotoxicity of AgNWs and the Ag accumulation in plants exists. This potentially indicates that the accumulation originates from particulate Ag, which is also responsible for the phytotoxicity of AgNWs. Once the AgNWs are taken up by plants, the in-vivo dissolution of AgNWs and in-place biological transformation of new particles can occur to some extent (Gorka and Liu Citation2016; Wang et al. Citation2015). These processes could also affect the plant growth partly (Wang et al. Citation2015; Wang et al. Citation2017). Dang et al. (Citation2020) also reported that particulate Ag dominates the overall Ag accumulation in wheat (Triticum aestivum) exposed to suspensions of AgNPs. In addition, the relative importance of ions versus particles of AgNPs are highly dependent on the dissolution extent of AgNPs (Dang et al. Citation2020). This observation is consistent with our findings that the particulate Ag contribution to the overall Ag accumulation of HAR-AgNW (which displayed the highest dissolution ability) was higher than that of LAR-AgNW and MAR-AgNW. Our results () showed furthermore the relative contribution of ion versus particulate to the overall adverse effects depends on the exposure concentration.
5. Conclusions
To the best of our knowledge, this is the first investigation that explored the effects of PVP-coated and uncoated AgNWs with different dimensions on their phytotoxicity and toxicokinetics of the dissolved and particulate Ag in terrestrial plants. Our results showed that PVP-coating affected dissolution behaviors of AgNWs. Noteworthy, this coating associated dissolution behavior was found not to affect the phytotoxicity of the AgNWs studied. The toxicity and the toxicokinetics parameters of the three AgNWs studied, followed the order of LAR-AgNW ≈ HAR-AgNW > MAR-AgNW. This indicates that the diameter of the AgNWs plays a crucial role in determining the toxicity and Ag accumulation of AgNWs. In addition, the particulate Ag dominates the overall toxicity and Ag accumulation in plants of AgNWs suspensions compared to dissolved Ag. Overall, the results of this study highlighted that the toxicokinetics and toxicodynamics of AgNWs associated with different dimension and coating should be taken into account when studying the interactions between NMs and biological systems. Our findings provide in depth understanding on nanosafety to plants as well as can contribute to further developing knowledge regarding their safe design to mitigate the side effects of nanowires. Furthermore, the established EC50-values and the toxicokinetic parameters of AgNWs can be incorporated into predictive models for assessing risk NWs for environmental health and safety.
TNAN-2020-OR-0174-File004.docx
Download MS Word (134.3 KB)Acknowledgments
The authors thank Rudo Verweij (Vrije Universiteit Amsterdam) and Yujia Zhai (Institute of Environmental Sciences (CML), Leiden University) for assistance with atomic adsorption spectrometry measurements, Dr. Fazel Abdolahpur Monikh (Institute of Environmental Sciences (CML), Leiden University) for help with transmission electron microscopy.
Disclosure statement
No potential conflict of interest was reported by the author(s).
Additional information
Funding
References
- Akter, M., M. T. Sikder, M. M. Rahman, A. K. M. A. Ullah, K. F. B. Hossain, S. Banik, T. Hosokawa, T. Saito, and M. Kurasaki. 2018. “A Systematic Review on Silver Nanoparticles-Induced Cytotoxicity: Physicochemical Properties and Perspectives.” Journal of Advanced Research 9: 1–16. doi:10.1016/j.jare.2017.10.008.
- Bianchi, M. G., L. Campagnolo, M. Allegri, S. Ortelli, M. Blosi, M. Chiu, G. Taurino, et al. 2020. “Length-Dependent Toxicity of TiO2 Nanofibers: Mitigation via Shortening.” Nanotoxicology 14 (4): 433–452. doi:10.1080/17435390.2019.1687775.
- Butz, S. V., J. L. Pinckney, S. C. Apte, and J. R. Lead. 2019. “Uptake and Impact of Silver Nanoparticles on the Growth of an Estuarine Dinoflagellate, Prorocentrum Minimum.” NanoImpact 15: 100181. doi:10.1016/j.impact.2019.100181.
- Chae, Y., and Y. J. An. 2016. “Toxicity and Transfer of Polyvinylpyrrolidone-Coated Silver Nanowires in an Aquatic Food Chain Consisting of Algae, Water Fleas, and Zebrafish.” Aquatic Toxicology (Amsterdam, Netherlands) 173: 94–104. doi:10.1016/j.aquatox.2016.01.011.
- Chithrani, B. D., A. A. Ghazani, and W. C. W. Chan. 2006. “Determining the Size and Shape Dependence of Gold Nanoparticle Uptake into Mammalian Cells.” Nano Letters 6 (4): 662–668. doi:10.1021/nl052396o.
- Colvin, V. L. 2003. “The Potential Environmental Impact of Engineered Nanomaterials.” Nature Biotechnology 21 (10): 1166–1170. doi:10.1038/nbt875.
- Dang, F., Q. Wang, W. Cai, D. Zhou, and B. Xing. 2020. “Uptake Kinetics of Silver Nanoparticles by Plant: Relative Importance of Particles and Dissolved Ions.” Nanotoxicology 14 (5): 654–613. doi:10.1080/17435390.2020.1735550.
- Fan, W., H. Lu, and W.-X. Wang. 2018. “Aging Influences on the Biokinetics of Functional TiO2 Nanoparticles with Different Surface Chemistries in Daphnia magna.” Environmental Science & Technology 52 (14): 7901–7909. doi:10.1021/acs.est.7b04392.
- George, S., Z. Lin, Z. Ji, C. R. Thomas, L. Li, M. Mecklenburg, H. Meng, X. Wang, et al. 2012. “Surface Defects on Plate-Shaped Silver Nanoparticles Contribute to Its Hazard Potential in a Fish Gill Cell Line and Zebrafish Embryos.” ACS Nano 6 (5): 3745–3759. doi:10.1021/nn204671v.
- Gorka, D. E., and J. Liu. 2016. “Effect of Direct Contact on the Phytotoxicity of Silver Nanomaterials.” Environmental Science & Technology 50 (19): 10370–10376. doi:10.1021/acs.est.6b02434.
- Guan, P., Z. Xu, X. Lin, N. Chen, H. Tong, T.-J. Ha, and D. Chu. 2018. “Recent Progress in Silver Nanowires.” Nanoscience and Nanotechnology Letters 10 (2): 155–166. doi:10.1166/nnl.2018.2615.
- Hu, L., H. S. Kim, J. Y. Lee, P. Peumans, and Y. Cui. 2010. “Scalable Coating and Properties of Transparent, Flexible, Silver Nanowire Electrodes.” ACS Nano 4 (5): 2955–2963. doi:10.1021/nn1005232.
- Ivask, A., K. Juganson, O. Bondarenko, M. Mortimer, V. Aruoja, K. Kasemets, I. Blinova, M. Heinlaan, V. Slaveykova, and A. Kahru. 2014. “Mechanisms of Toxic Action of Ag, ZnO and CuO Nanoparticles to Selected Ecotoxicological Test Organisms and Mammalian Cells In Vitro: A Comparative Review.” Nanotoxicology 8 (sup1): 57–71. doi:10.3109/17435390.2013.855831.
- Ji, Z., X. Wang, H. Zhang, S. Lin, H. Meng, B. Sun, S. George, T. Xia, A. E. Nel, and J. I. Zink. 2012. “Designed Synthesis of CeO2 Nanorods and Nanowires for Studying Toxicological Effects of High Aspect Ratio Nanomaterials.” ACS Nano 6 (6): 5366–5380. doi:10.1021/nn3012114.
- Jiang, C., B. T. Castellon, C. W. Matson, G. R. Aiken, and H. Hsu-Kim. 2017. “Relative Contributions of Copper Oxide Nanoparticles and Dissolved Copper to Cu Uptake Kinetics of Gulf Killifish (Fundulus grandis) Embryos.” Environmental Science & Technology 51 (3): 1395–1404. doi:10.1021/acs.est.6b04672.
- Jones, R., R. Draheim, and M. Roldo. 2018. “Silver Nanowires: Synthesis, Antibacterial Activity and Biomedical Applications.” Applied Sciences 8 (5): 673. doi:10.3390/app8050673.
- Kuo, C. W., J. J. Lai, K. H. Wei, and P. Chen. 2007. “Studies of Surface-Modified Gold Nanowires inside Living Cells.” Advanced Functional Materials 17 (18): 3707–3714. doi:10.1002/adfm.200601133.
- Li, X., J. J. Lenhart, and H. W. Walker. 2012. “Aggregation Kinetics and Dissolution of Coated Silver Nanoparticles.” Langmuir: The ACS Journal of Surfaces and Colloids 28 (2): 1095–1104. doi:10.1021/la202328n.
- Liu, Y., J. Baas, W. J. G. M. Peijnenburg, and M. G. Vijver. 2016. “Evaluating the Combined Toxicity of Cu and ZnO Nanoparticles: Utility of the Concept of Additivity and a Nested Experimental Design.” Environmental Science & Technology 50 (10): 5328–5337. doi:10.1021/acs.est.6b00614.
- Lv, J., P. Christie, and S. Zhang. 2019. “Uptake, Translocation, and Transformation of Metal-Based Nanoparticles in Plants: Recent Advances and Methodological Challenges.” Environmental Science: Nano 6 (1): 41–59. doi:10.1039/C8EN00645H.
- Majumdar, S., C. Ma, M. Villani, N. Zuverza-Mena, L. Pagano, Y. Huang, A. Zappettini, et al. 2019. “Surface Coating Determines the Response of Soybean Plants to Cadmium Sulfide Quantum Dots.” NanoImpact 14: 100151. doi:10.1016/j.impact.2019.100151.
- Medina-Velo, I. A., J. R. Peralta-Videa, and J. L. Gardea-Torresdey. 2017. “Assessing Plant Uptake and Transport Mechanisms of Engineered Nanomaterials from Soil.” MRS Bulletin 42 (05): 379–383. doi:10.1557/mrs.2017.87.
- Miller, E. L., S. L. Nason, K. G. Karthikeyan, and J. A. Pedersen. 2016. “Root Uptake of Pharmaceuticals and Personal Care Product Ingredients.” Environmental Science & Technology 50 (2): 525–541. doi:10.1021/acs.est.5b01546.
- Moon, J., J. Il Kwak, and Y. J. An. 2019. “The Effects of Silver Nanomaterial Shape and Size on Toxicity to Caenorhabditis elegans in Soil Media.” Chemosphere 215: 50–56. doi:10.1016/j.chemosphere.2018.09.177.
- Müller, H., K. Kulkarni, J. Motskin, M. Goode, A. Winship, P. Skepper, J. N. Ryan, M. P. Porter. 2010. “PH-Dependent Toxicity of High Aspect Ratio ZnO Nanowires in Macrophages Due to Intracellular Dissolution.” ACS Nano 4 (11): 6767–6779. doi:10.1021/nn101192z.
- Nam, S. H., and Y. J. An. 2019. “Size- and Shape-Dependent Toxicity of Silver Nanomaterials in Green Alga Chlorococcum infusionum.” Ecotoxicology and Environmental Safety 168: 388–393. doi:10.1016/j.ecoenv.2018.10.082.
- Navarro, E., B. Wagner, N. Odzak, L. Sigg, and R. Behra. 2015. “Effects of Differently Coated Silver Nanoparticles on the Photosynthesis of Chlamydomonas reinhardtii.” Environmental Science & Technology 49 (13): 8041–8047. doi:10.1021/acs.est.5b01089.
- Nel, A., T. Xia, L. Mädler, and N. Li. 2006. “Toxic Potential of Materials at the Nanolevel.” Science (New York, N.Y.) 311 (5761): 622–627. doi:10.1126/science.1114397.
- Nguyen, K. C., V. L. Seligy, A. Massarsky, T. W. Moon, P. Rippstein, J. Tan, and A. F. Tayabali. 2013. “Comparison of Toxicity of Uncoated and Coated Silver Nanoparticles.” Journal of Physics: Conference Series 429: 012025. doi:10.1088/1742-6596/429/1/012025.
- Park, E. J., Lee, G. H. Shim, J. Hun Cho, M. H. Lee, B. S. Kim, Y. B. Kim, J. H. Kim, Y. and Kim. D. W. 2015. “Comparison of the Toxicity of Aluminum Oxide Nanorods with Different Aspect Ratio.” Archives of Toxicology 89 (10): 1771–1782. doi:10.1007/s00204-014-1332-5.
- Qiu, Y., Y. Liu, L. Wang, L. Xu, R. Bai, Y. Ji, X. Wu, Y. Zhao, Y. Li, and C. Chen. 2010. “Surface Chemistry and Aspect Ratio Mediated Cellular Uptake of Au Nanorods.” Biomaterials 31 (30): 7606–7619. doi:10.1016/j.biomaterials.2010.06.051.
- Riviere, J. E., M. Jaberi-Douraki, J. Lillich, T. Azizi, H. Joo, K. Choi, R. Thakkar, and N. A. Monteiro-Riviere. 2018. “Modeling Gold Nanoparticle Biodistribution after Arterial Infusion into Perfused Tissue: Effects of Surface Coating, Size and Protein Corona.” Nanotoxicology 12 (10): 1093–1112. doi:10.1080/17435390.2018.1476986.
- Römer, I., T. A. White, M. Baalousha, K. Chipman, M. R. Viant, and J. R. Lead. 2011. “Aggregation and Dispersion of Silver Nanoparticles in Exposure Media for Aquatic Toxicity Tests.” Journal of Chromatography A 1218 (27): 4226–4233. doi:10.1016/j.chroma.2011.03.034.
- Safi, M., M. Yan, M.-A. Guedeau-Boudeville, H. Conjeaud, V. Garnier-Thibaud, N. Boggetto, A. Baeza-Squiban, F. Niedergang, D. Averbeck, and J.-F. Berret. 2011. “Interactions between Magnetic Nanowires and Living Cells: Uptake, Toxicity, and Degradation.” ACS Nano. 5 (7): 5354–5364. doi:10.1021/nn201121e.
- Scanlan, L. D., R. B. Reed, A. V. Loguinov, P. Antczak, A. Tagmount, S. Aloni, D. T. Nowinski, et al. 2013. “Silver Nanowire Exposure Results in Internalization and Toxicity to Daphnia Magna.” ACS Nano 7 (12): 10681–10694. doi:10.1021/nn4034103.
- Schwab, F., G. Zhai, M. Kern, A. Turner, J. L. Schnoor, and M. R. Wiesner. 2016. “Barriers, Pathways and Processes for Uptake, Translocation and Accumulation of Nanomaterials in Plants – Critical Review.” Nanotoxicology 10 (3): 257–222. doi:10.3109/17435390.2015.1048326.
- Shao, Z., and W. X. Wang. 2020. “Biodynamics of Silver Nanoparticles in an Estuarine Oyster Revealed by 110mAgNP Tracing.” Environmental Science & Technology 54 (2): 965–974. doi:10.1021/acs.est.9b04241.
- Sohn, E. K., S. A. Johari, T. G. Kim, J. K. Kim, E. Kim, J. H. Lee, Y. S. Chung, and I. J. Yu. 2015. “Aquatic Toxicity Comparison of Silver Nanoparticles and Silver Nanowires.” BioMed Research International 2015: 893049–893012. doi:10.1155/2015/893049.
- Song, M. M., W. J. Song, H. Bi, J. Wang, W. L. Wu, J. Sun, and M. Yu. 2010. “Cytotoxicity and Cellular Uptake of Iron Nanowires.” Biomaterials 31 (7): 1509–1517. doi:10.1016/j.biomaterials.2009.11.034.
- Torrent, L., M. Iglesias, E. Marguí, M. Hidalgo, D. Verdaguer, L. Llorens, A. Kodre, A. Kavčič, and K. Vogel-Mikuš. 2020. “Uptake, Translocation and Ligand of Silver in Lactuca sativa Exposed to Silver Nanoparticles of Different Size, Coatings and Concentration.” Journal of Hazardous Materials 384: 121201. doi:10.1016/j.jhazmat.2019.121201.
- Tortella, G. R., O. Rubilar, N. Durán, M. C. Diez, M. Martínez, J. Parada, and A. B. Seabra. 2020. “Silver Nanoparticles: Toxicity in Model Organisms as an Overview of Its Hazard for Human Health and the environment.” Journal of Hazardous Materials 390: 121974. doi:10.1016/j.jhazmat.2019.121974.
- Toybou, D., C. Celle, C. Aude-Garcia, T. Rabilloud, and J.-P. Simonato. 2019. “A Toxicology-Informed, Safer by Design Approach for the Fabrication of Transparent Electrodes Based on Silver Nanowires.” Environmental Science: Nano 6 (2): 684–694. doi:10.1039/C8EN00890F.
- Wang, F., Y. Wang, X. Yao, C. Ma, Y. Yin, and M. Song. 2019. “Length and Diameter-Dependent Phagocytosis and Cytotoxicity of Long Silver Nanowires in Macrophages.” Chemosphere 237: 124565. doi:10.1016/j.chemosphere.2019.124565.
- Wang, P., E. Lombi, S. Sun, K. G. Scheckel, A. Malysheva, B. A. McKenna, N. W. Menzies, F. J. Zhao, and P. M. Kopittke. 2017. “Characterizing the Uptake, Accumulation and Toxicity of Silver Sulfide Nanoparticles in Plants.” Environmental Science. Nano 4 (2): 448–460. doi:10.1039/C6EN00489J.
- Wang, P., N. W. Menzies, E. Lombi, R. Sekine, F. P. C. Blamey, M. C. Hernandez-Soriano, M. Cheng, et al. 2015. “Silver Sulfide Nanoparticles (Ag2S-NPs) Are Taken up by Plants and Are phytotoxic.” Nanotoxicology 9 (8): 1041–1049. doi:10.3109/17435390.2014.999139.
- Wang, Z., X. Xie, J. Zhao, X. Liu, W. Feng, J. C. White, and B. Xing. 2012. “Xylem- and Phloem-Based Transport of CuO Nanoparticles in Maize (Zea mays L.).” Environmental Science & Technology 46 (8): 4434–4441. doi:10.1021/es204212z.
- Wiesner, M. R., G. V. Lowry, P. Alvarez, D. Dionysiou, and P. Biswas. 2006. “Assessing the Risks of Manufactured Nanomaterials.” Environmental Science & Technology 40 (14): 4336–4345. doi:10.1021/es062726m.
- Wu, J., G. Wang, M. G. Vijver, T. Bosker, and W. J. G. M. Peijnenburg. 2020. “Foliar versus Root Exposure of AgNPs to Lettuce: Phytotoxicity, Antioxidant Responses and Internal Translocation.” Environmental Pollution (Barking, Essex: 1987) 261: 114117. doi:10.1016/j.envpol.2020.114117.
- Yan, A., and Z. Chen. 2019. “Impacts of Silver Nanoparticles on Plants: A Focus on the Phytotoxicity and Underlying Mechanism.” International Journal of Molecular Sciences 20 (5): 1003. doi:10.3390/ijms20051003.
- Yang, X., A. P. Gondikas, S. M. Marinakos, M. Auffan, J. Liu, H. Hsu-Kim, and J. N. Meyer. 2012. “Mechanism of Silver Nanoparticle Toxicity is Dependent on Dissolved Silver and Surface Coating in Caenorhabditis elegans.” Environmental Science & Technology 46 (2): 1119–1127. doi:10.1021/es202417t.
- Yang, X., H. Pan, P. Wang, and F. J. Zhao. 2017. “Particle-Specific Toxicity and Bioavailability of Cerium Oxide (CeO2) Nanoparticles to Arabidopsis thaliana.” Journal of Hazardous Materials 322 (Pt A): 292–300. doi:10.1016/j.jhazmat.2016.03.054.
- Zhai, Y., E. R. Hunting, M. Wouters, W. J. G. M. Peijnenburg, and M. G. Vijver. 2016. “Silver Nanoparticles, Ions, and Shape Governing Soil Microbial Functional Diversity: Nano Shapes Micro.” Frontiers in Microbiology 7: 1123. doi:10.3389/fmicb.2016.01123.
- Zhai, Y., E. R. Hunting, M. Wouterse, W. J. G. M. Peijnenburg, and M. G. Vijver. 2017. “Importance of Exposure Dynamics of Metal-Based Nano-ZnO, -Cu and -Pb Governing the Metabolic Potential of Soil Bacterial Communities.” Ecotoxicology and Environmental Safety 145: 349–358. doi:10.1016/j.ecoenv.2017.07.031.
- Zhang, L., and W. X. Wang. 2019. “Dominant Role of Silver Ions in Silver Nanoparticle Toxicity to a Unicellular Alga: Evidence from Luminogen Imaging.” Environmental Science & Technology 53 (1): 494–502. doi:10.1021/acs.est.8b04918.