
Abstract
Materials can be modified for improved functionality. Our aim was to test whether pulmonary toxicity of silica nanomaterials is increased by the introduction of: a) porosity; and b) surface doping with CuO; and whether c) these modifications act synergistically. Mice were exposed by intratracheal instillation and for some doses also oropharyngeal aspiration to: 1) solid silica 100 nm; 2) porous silica 100 nm; 3) porous silica 100 nm with CuO doping; 4) solid silica 300 nm; 5) porous silica 300 nm; 6) solid silica 300 nm with CuO doping; 7) porous silica 300 nm with CuO doping; 8) CuO nanoparticles 9.8 nm; or 9) carbon black Printex 90 as benchmark. Based on a pilot study, dose levels were between 0.5 and 162 µg/mouse (0.2 and 8.1 mg/kg bw). Endpoints included pulmonary inflammation (neutrophil numbers in bronchoalveolar fluid), acute phase response, histopathology, and genotoxicity assessed by the comet assay, micronucleus test, and the gamma-H2AX assay. The porous silica materials induced greater pulmonary inflammation than their solid counterparts. A similar pattern was seen for acute phase response induction and histologic changes. This could be explained by a higher specific surface area per mass unit for the most toxic particles. CuO doping further increased the acute phase response normalized according to the deposited surface area. We identified no consistent evidence of synergism between surface area and CuO doping. In conclusion, porosity and CuO doping each increased the toxicity of silica nanomaterials and there was no indication of synergy when the modifications co-occurred.
Introduction
Manufactured nanoparticles can be modified to widen their industrial applications. Modifications such as introduction of porosity or addition of chemicals may influence the toxicity of the nanomaterials.
Introducing porosity into nanoparticles is intended to increase the surface area of the particle and decrease their density. This can be advantageous in products such as catalysts and pharmaceutical drug delivery (Auyeung et al. Citation2015; Baeza, Ruiz-Molina, and Vallet-Regí Citation2017). Since lung-deposited surface area has been identified as an important driver of inflammation (Poulsen et al. Citation2016; Schmid and Stoeger Citation2016; Barfod et al. Citation2020; Danielsen et al. Citation2020), porous particles would be expected to induce more inflammation than solid particles due to a larger total deposited surface area.
Doping metals such as copper onto the surface of nanomaterials is a means for increasing catalytic properties (Zhang et al. Citation2014; Witoon et al. Citation2018; Koohestani et al. Citation2020). The pulmonary toxicity of copper oxide (CuO) nanoparticles has been investigated in pregnant mice (3.5 mg/m3, 4 h/day on gestation days 3-19). Neutrophils were increased in BAL fluid, and immune response gene expression was affected in the spleen of pups (Adamcakova-Dodd et al. Citation2015). Inflammation was also seen following short-term inhalation of 10 mg/m3 CuO nanoparticles 15–20 nm in diameter (Gosens et al. Citation2016). In addition, CuO nanoparticles dosed via intratracheal instillation or aspiration induced increased neutrophil number in BAL fluid at doses between 0.5 and 2 mg/kg bw (Yokohira et al. Citation2009; Cho et al. Citation2010; Citation2012, Jeong, Kim, et al. Citation2016, Minigalieva et al. Citation2017). Copper salts seem to be more potent than CuO nanoparticles: studies with copper salts have demonstrated toxicity in the microgram range (per kg bw) (Hirano et al. Citation1990, Rice et al. Citation2001, Prieditis and Adamson Citation2002, Wallenborn et al. Citation2009).
When designing novel nanomaterials combining various functionalities, there is a very high number of potential combinations taking the vast number of available chemicals and modifications into account. Therefore, we need to be able to predict the resulting toxicity based on knowledge on the toxicity of each modification. For mixtures of chemicals this is done by using mathematical models such as ‘dose addition’ or ‘independent action’ (Hadrup et al. Citation2013, Hadrup Citation2014). Yet, these models are based on the notion that the effects are additive; while potential synergistic effects are a source of uncertainty (Hadrup et al. Citation2016). It has not yet been assessed whether these models can be used to predict the toxicity of combinations of modifications in complex nanoparticles.
The specific research questions in this study were whether the introduction of: a) mesoporosity; and b) surface CuO doping could affect the toxicity of synthetic amorphous silica materials and whether c) a combination of these modifications could have synergistic effects. To this end, mice were intratracheally dosed with solid or porous silica particles, both in the presence and absence of CuO doping (small particles of CuO placed onto the silica surface). For reference, we included pure 10 nm CuO nanoparticles and 14 nm carbon black nanoparticles. After 1 and 28 days of recovery, we investigated inflammation as cellularity of BAL fluid, acute phase response markers in the lung and liver, and genotoxic effects in the blood, BAL fluid cells, lung and liver. The amount of copper was measured by ICP-MS in lung tissue, and the presence of particles in BAL fluid cells was evaluated by phase contrast microscopy. To increase the strength of the data, we – in an independent study – investigated the effect of porosity in a mouse oropharyngeal aspiration model, using recovery times of 1, 3, and 7 days.
Methods
Test materials and preparation of particle suspensions
Powders of CuO nanoparticles and 100 or 300 nm target-size silica with combinations of porosity and CuO doping were synthesized through wet-chemical procedures. All silica materials were subsequently coated with methyl-groups to lower their hygroscopicity (e.g. Smeets et al. Citation2018) and hence and dissolution rate. The test materials were characterized by Transmission (TEM: Tecnai T20 G2 – LaB6 microscope, operating at 200 kV) and Scanning Electron Microscopy (SEM; FEI Quanta 200), specific surface area by BET Nitrogen adsorption (Micromeritics Instrument Corporation), Cu-content by Inductively Coupled Mass-Spectrometry (ICP-OES; Agilent 5100), and water-loss and methylation by coupled Thermogravimetric Mass-Spectrometry analysis (TGA-MS; Netzsch STA 449F3 and QMS D Aëolos MS). The synthesis procedures for the silica particles were tailored based on the approaches described in (Graf et al. Citation2003, Zhao et al. Citation2012, Wu, Mou, and Lin Citation2013), and for CuO based on (El-Trass et al. Citation2012). Details will be reported in (Sahlgren et al. Citationn.d.). Printex 90 carbon black was included an internal benchmark material.
For animal exposure, the materials were pre-wetted with 0.5% v/v ethanol (5 µl/mL) and suspended in 0.2 mm filtered, γ-irradiated Nanopure Diamond UV water (Pyrogens: <0.001 EU/ml, total organic carbon: <3.0 ppb) with 2% v/v mouse serum from sister mice (Hadrup et al. Citation2017). The suspension was continuously sonicated for 16 min in an ice-water bath by use of a Branson Sonifier S-450D (Branson Ultrasonics Corp., Danbury, CT) equipped with a 13 nm disruptor horn (Model number: 101-147-037, Branson Ultrasonics Corp., Danbury, CT, USA) using an amplitude of 10%. Exceptions to this procedure was particle NRCWE #067 (sonication for 16 min at an amplitude of 20%) and NRCWE #070 (sonication for 20 min at an amplitude of 10%). The particle mass concentrations were 2.56 mg/mL corresponding to a dose of 128 µg/mouse in a 50 µL instillation volume. To obtain lower doses, the suspensions underwent repeated cycles of three-fold dilutions followed by 2 min of sonication after each dilution, until the appropriate concentration was obtained.
DLS and zeta-potential characterization of particle suspensions
The hydrodynamic size distributions of the batch dispersions were determined via Dynamic Light Scattering (DLS) on a Malvern Zetasizer Nano ZS (Malvern Instruments, UK). Size distributions were measured directly at 25 °C for all instillation suspensions. Zeta-potential measurements were conducted with the same equipment using the Auto mode for the analysis. The data were collected and analyzed with the Dispersion Technology Software v7.11 (Malvern Instruments, UK). For the zeta-sizer analysis, the following values were used: refractive and absorption indices of as well as standard optical and viscosity properties for water (Viscosity: 0.887 cP; RI 1.33). pH measurements were conducted using a pH Meter M240 (Sigma-Aldrich, Denmark).
Animal procedures (intratracheal instillation study)
All animal procedures complied with the EC Directive 86/609/EEC and Danish law regulating experiments with animals (The Danish Ministry of Justice, Animal Experiments Inspectorate permission 2015-15-0201-00465). Female C57BL/6J BomTac mice, 7 weeks of age and with a body weight (bw) of 19 ± 1.5 g, were obtained from Taconic Europe (Ejby, Denmark). Upon arrival, the animals were randomized to cages with either control or nanomaterial administered animals (n = 7 animals per cage and treatment group). Drinking water (tap water) and feed (Altromin no. 1324, Brogaarden, Denmark) were provided ad libitum. The mice were housed in polypropylene cages with Enviro-Dri bedding (Brogaarden, Gentofte, Denmark). Enrichment consisted of wood blocks (Brogaarden, Gentofte, Denmark) and hides (Mouse House, Scanbur, Karlslunde, Denmark). Room temperature was 20 ± 2 °C and humidity 50 ± 20%. The animals were kept under a 12 h light: 12 h dark cycle (light on from 6 a.m.). Following one week of acclimatization, anesthetized mice were instilled with 50 μL of particle suspension as previously described (Jackson et al. Citation2011, Hadrup et al. Citation2017) (DLS data from the specific animal study are provided in ). One or 28 days after exposure, the mice were anesthetised by an injection of Zoletil-Fentanyl, and humanely killed by collection of heart blood as described (Bengtson et al. Citation2017). The thorax was monitored for macroscopic abnormalities such as discolorations, ascites or bleeding, and lung and liver were excised for further analysis. Based on review of the toxicological literature, a pilot study was performed, using doses of 128 µg/mouse, except CuO nanoparticle, where 42 µg was used. In addition, silica 300 nm-CuO was administered at 14 µg since the suspension in instillation vehicle had an unacceptably high pH at higher concentrations (pH 10.3 reduced to 7.3 at 14 µg/mouse). Based on clinical appearance and body weight of the two mice in each pilot treatment group, dose levels were set for the main study as shown in .
Table 1. Representative electron microscopy images and physico-chemical properties of the used test-materials.
Table 2. Study doses.
Animal procedures (oropharyngeal aspiration study)
This part of the study was performed in agreement with the European Convention for the Protection of Vertebrate Animals Used for Experimental and Other Scientific Purposes (Strasbourg 18 March 1986, adopted in Finland 31 May 1990), and were approved by the State Provincial Office of Southern Finland (ESAVI/518/04.10.07/2017). Female 7-week old C57BL/6J BomTac mice were obtained from Taconic Europe (Ejby, Denmark) and quarantined for one week upon arrival. The mice were housed in groups of four in transparent plastic cages bedded with aspen chip, and were provided tap water and standard mouse diet (Altromin no. 1314 FORTI, Altromin Spezialfutter GmbH & Co., Germany) ad libitum. The environment of the animal room was carefully controlled, with a 12 h dark-light cycle the light was on from 6 AM to 6 PM), temperature of 20–21 °C, and relative humidity of 40–45%. Dispersions of 100 and 300 nm solid and porous silica nanomaterials (NRCWE#065 - NRCWE#068), carbon black as positive control (all dispersed in 2% mouse serum/PBS), or 2% mouse serum/PBS as vehicle control, were once administered to the 8-week old mice (n = 8 per treatment group) by oropharyngeal aspiration under isoflurane anesthesia as described earlier (Rydman et al. Citation2015). The administration volume was 50 µl, and mice received the silica particles at two dose levels − 43 or 128 μg/mouse, and carbon black particles at 128 μg/mouse. Animals were sacrificed 1, 3, and 7 days after the exposure by isoflurane overdose accompanied by immediate blood withdrawal from the vena cava and collection of BAL and lung biopsies.
Measurement of copper in lung samples and evaluation of color change of BAL cells to indicate the location of nanomaterials inside cells
For measurement of copper content in the intratracheal instillation study, lung samples were digested with 1 mL of 70% HNO3 per 0.05 g of dry sample at 200 °C for 15 min. Copper content was measured with a Perkin Elmer DRCII ICP-MS apparatus, with a detection limit of 0.029 µg/L. To give an indication whether BAL cells contained nanomaterials, we invoked phase contrast microscopy. A bluish color, likely representing the uptake of particles, was observed inside bronchoalveolar lavage fluid cells at different extents across the materials. The BAL cell slides were reviewed blinded to the observer.
BAL fluid cellularity
In the intratracheal instillation study, BAL fluid cellularity was determined as previously described (Kyjovska et al. Citation2015). Further details are provided in the Supplementary materials.
Determination of saa mRNA levels by quantitative PCR
Saa mRNA levels serve as biomarkers for acute phase response induction, and as biomarker of risk of cardiovascular disease (Saber et al. Citation2014, Hadrup, Zhernovkov, et al. Citation2020). In the intratracheal instillation study, quantitative PCR was conducted on cDNA from total RNA isolated from snap frozen lung and liver tissue as described earlier (Poulsen et al. Citation2017). Quantitative PCR was performed in triplicates on ViiA7 Real-Time PCR detector (PE Biosystems, Foster City, CA, USA); the Saa mRNA levels were normalized to 18S rRNA (prod. no. Mm03024053_m1 from Applied Biosystems).
Genotoxicity
The level of DNA strand breaks was assessed in BAL cells, and lung and liver tissue in the intratracheal instillation study as tail percent DNA, measured by the comet assay using the IMSTAR system as previously described (Jackson et al. Citation2013). Negative and positive controls included on all slides were A549 cells exposed to 0 or 30 µM of H2O2, respectively. The frequency of micronuclei was scored in 2000 normochromatic erythrocytes from peripheral blood per mouse, as previously described (Lindberg et al. Citation2012), 28 d post-instillation. At the same time-point, the lungs of animals treated with the highest dose of each material were assessed for DNA double-strand breaks by the γ-H2AX assay (Plappert-Helbig et al. Citation2019). Immunofluorescent γ-H2AX staining was performed on formalin-fixed paraffin-embedded lung samples after deparaffination and antigen retrieval by boiling. An autostainer was used for primary (rabbit monoclonal anti-gamma H2AX phospho-Ser139) and secondary (goat anti-rabbit IgG) antibody incubations and for tyramide amplification of the fluorescent signal (Alexa Fluor™ 488 Tyramide SuperBoost™ Kit; ThermoFisher Scientific) according to manufacturer’s instructions. Samples were counterstained with 4′,6-diamidino-2-phenylindole and digitized with 20x fluorescent scanning. Expression of γ-H2AX foci was analyzed by a digital microscope application. For each sample, all nuclei in four randomly selected annotations (200 × 200 µm) were classified as negative, weak positive (≤3 foci), positive (>3 foci), or apoptotic (pan-stained nucleus).
Histopathology
Lung, liver, kidney and spleen from the highest dose group of each particle (28 days post treatment in the intratracheal instillation study, and 1, 3, and 7 days after treatment in the oropharyngeal aspiration study) were fixed in 4% formalin for at least 24 h, and the formalin fixed samples were then trimmed, dehydrated and paraffin embedded. Sections were cut at a thickness of 3 µm. For the evaluation of general morphology, the sections were stained with the hematoxylin and eosin (H&E) stain. Next, the sections were evaluated for histopathological changes under light microscope.
Statistics
Statistics were calculated using the Graph Pad Prism software package 7.02 (Graph Pad Software Inc., La Jolla, CA, USA). Data were first tested for normality using the Shapiro-Wilk test. The t-test and ANOVA are relatively robust against deviations from normality but somewhat sensitive to differences in standard deviation. Therefore t-test and ANOVA were performed, unless the p value of the Shapiro Wilks test was very low (p < 0.001), or standard deviations differed from each other in the F test (for two sample comparisons) or Brown-Forsythe test for three or more treatment groups (p < 0.001). The latter tests were calculated because the t-test and the ANOVA are somewhat sensitive to differences in standard deviation. In cases of deviations in normality or standard deviations, the non-parametric Mann Whitney (two groups) or Kruskall-Wallis (more than two groups) tests were applied. The data were tested so that each particle type was considered independently against the vehicle control. In order to assess differences in between groups in the one-way ANOVA or Kruskall-Wallis test, Holm-Sidak’s multiple comparisons test (ANOVA) and Dunn’s multiple comparisons test (Kruskall-Wallis test) were applied, respectively.
To test across each material, we calculated the t-test or (in accordance with the considerations above) the non-parametric Mann-Whitney test. For this, we tested each dose level (in µg) of the porous silica against the corresponding dose level of solid silica, and each dose level of CuO-doped particles against their respective dose level of un-CuO-doped solid or porous silica. We used a Bonferroni-corrected p value adjusted for the 11 comparisons in the intratracheal instillation study (for some particles there was only partial overlap between the dose levels due to adjustment of dose levels based on toxicity in the pilot study); and the four comparisons in the oropharyngeal aspiration study (only solid and porous particles included).
Concerning the presence of nanomaterials inside BAL cells, whether there was a difference to the control group was evaluated using Fisher’s exact test with a p Value of less than 0.05 considered significant.
Results
Nanomaterial properties
Representative electron microscopy images of the silica and CuO test materials are shown in . The physico-chemical properties including CuO content, amount of adsorbed water and methyl coating, specific surface area, as well as the ζ-average, polydispersity index (PDI), and ζ-charge and pH of batch suspensions are shown in . The data show that the silica materials consist of highly spherical particles. CuO nanoparticles in the doped materials can be clearly identified. The pure CuO nanoparticles appeared as very small ca. 10 nm-size spherical to elongated nanocrystals. CuO-content of doped silica materials was 4.6 to 9.3 wt.%. The silica materials contained 0.26 to 5.94 wt.% adsorbed water and 2.1 to 6.4 wt.% methylation. The CuO nanoparticle contained 4.55 wt% adsorbed water and no methylation. The specific surface areas of the materials, varied from 9 to 862 m2/g and porous silica materials have 34 to 86 times higher specific surface areas than the solid counterparts. Analysis of batch suspensions following the procedure for toxicity testing showed hydrodynamic ζ-sizes ranging from 135 to 587 nm suggesting some influence of agglomerates or minor contents of coarser particles. The ζ-potentials were all negative with values typically ranging from −27.2 to −38.6 mV. One sample had a ζ-potential of −50.0 mV and an abnormally high pH of 10.2 as compared to the other silica and CuO materials with pH values ranging from 7.48 to 8.14.
Body weight and clinical appearance
In the pilot study, 42 µg/mouse CuO nanoparticles induced passiveness to an extent that the animals had to be humanely killed 30 min after exposure. Two mice were subsequently dosed with 14 µg of this particle but lost body weight (14% weight loss on day 3). Although their weights normalized over the next two days (Supplementary Materials Figure S1), the highest dose was set to 4.7 µg/mouse in the main study. We observed no toxicity in the other treatment groups in the pilot study. In the main study, there were no effects on body weight or clinical appearance in any of the exposure groups.
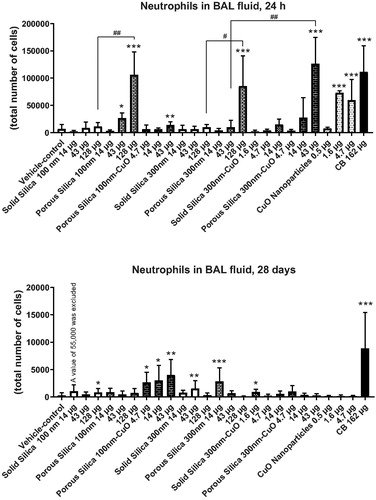
Figure 1. Neutrophil numbers in bronchoalveolar lavage fluid of mice exposed to the nanomaterials. The upper panel show data from 24 h of exposure and the lower panel from 28 days of exposure. The columns represent means and bars SD. ***, ** and * designates p values of <0.001, <0.01 and <0.05 respectively of one way ANOVA with Holm-Sidak’s multiple comparisons test in case of data approaching normality and not having a highly different variation. In the case of carbon black ***, ** and * designates p values of <0.001, <0.01 and <0.05 respectively vs. vehicle of t-test. ## and # designate Bonferroni-corrected (11 comparisons) p values of <0.01 and <0.05 of unpaired t-test or Mann-Whitney test.
Copper content in the lungs, and color change indicating nanomaterials inside BAL fluid cells
Particle uptake in BAL fluid cells 24 h after exposure was indicated by a color change (purple/blue labelling) of the cells, observed at all dose levels of almost all particles (Supplementary materials Figure S2). Exceptions were the two lowest dose levels of the solid silica 300 nm-CuO (1.6 and 4.7 µg/mouse) and all dose levels of the pure CuO nanoparticle (0.5 to 4.7 µg) (Supplementary materials Figure S2). At 28 days, a color change was still present at all doses of un-doped solid and porous silica 300 nm and CuO-doped porous silica 300 nm, whereas for the other silica particles the color change had diminished (Supplementary materials Figure S2). Copper content was measured in lung tissue from selected animal groups (Supplementary materials Figure S3). Copper content was increased in the lungs at the highest dose of CuO nanoparticles 24 h post-exposure, the only group assessed at this time point. There was no increases in copper in any of the tested groups 28 days after exposure, which included the two highest dose levels of the CuO-doped silica particles and the CuO nanoparticle (Supplementary materials Figure S3).
Figure 2. Neutrophil numbers in bronchoalveolar lavage fluid of mice exposed to the nanomaterials by oropharyngeal aspiration. The plots represent neutrophil recruitment to the airways 24 h, 3 and 7 days after the treatment with vehicle or nanomaterial dispersions. Data are mean and bars represent SD. ****, ***, ** and * designates p values of <0.0001, <0.001, <0.01 and <0.05 respectively of one way ANOVA with Holm-Sidak’s multiple comparisons test in case of data approaching normality and not having a highly different variation. In the case of carbon black ***, ** and * designates p values of <0.001, <0.01 and <0.05 respectively vs. vehicle of t-test. ### and ## designate Bonferroni-corrected (4 comparisons) p values of <0.001 and <0.01, respectively, of unpaired t-test or Mann-Whitney test.
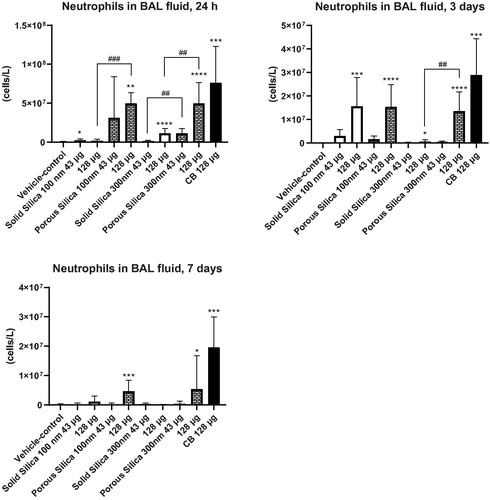
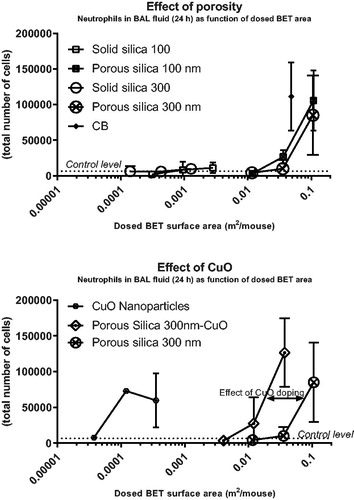
Figure 3. Neutrophil numbers in bronchoalveolar lavage fluid of mice as function of dosed BET surface area of each nanomaterial. The data on neutrophil numbers from (intratracheal instillation) are here depicted as function of dosed BET surface area per mouse. The upper panel represents data from 24 h of exposure of porous and non-porous particles; and the lower panel data from 24 h of exposure of CuO nanoparticles, porous silica 300 nm CuO and porous silica 300 nm to illustrate the effect of CuO doping. Some error bars are not depicted, because the exponential axis does not accommodate negative values.
Inflammation determined as the number of BAL neutrophils
Lung inflammation, in terms of increased neutrophil numbers in BAL fluid, was observed for both the porous 100 nm and porous 300 nm silica nanomaterials 24 h after intratracheal instillation, at the two highest and the highest dose levels, respectively (). Moreover, the highest dose levels of porous silica – of both sizes – induced significantly higher neutrophil numbers in BAL fluid than the highest doses of their solid counterparts (). The porous silica 300 nm-CuO (highest dose was 43 µg) induced more inflammation than 43 µg of porous silica 300 nm with no CuO doping (). The CuO particle increased neutrophil numbers at the two highest dose levels (1.6 and 4.7 µg/mouse). At 28 days, inflammation was sustained for the 100 nm porous particle doped with CuO, but not for its un-doped counterpart. In addition, at 28-days post-exposure, increased neutrophil influx was observed across particles and doses. The positive control particle CB Printex-90 increased neutrophil numbers at both time points (). To enable comparison of similar dose levels in relation to possible synergy between porosity and CuO-doping, data regarding the 14 and 43 µg/mouse solid, porous and CuO-doped silica particles are shown separately in Supplementary materials Figure S4.
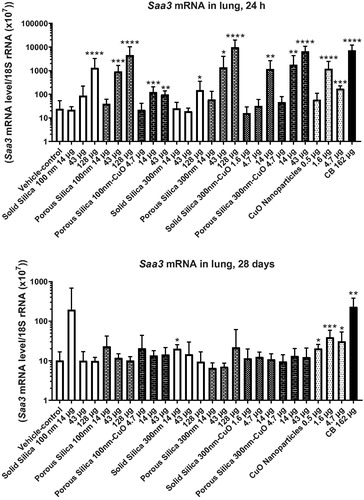
Figure 4. Saa3 mRNA level in lungs of mice exposed to silica nanomaterials. Mice were administered the silica materials by intratracheal instillation and 24 h (upper panel), and 28 days (lower panel) later the lungs were recovered, and the Saa3 mRNA level was measured by quantitative real time PCR. Data are mean and bars represent SD. ****, ***, ** and * designates p values of <0.0001, <0.001, <0.01 and <0.05 respectively, of one way ANOVA with Holm-Sidak’s multiple comparisons test in case of data approaching normality and not having a highly different variation. In the case of carbon black ****, and ** designate p values of <0.0001 and <0.01, respectively, vs. vehicle of t-test.
After particle exposure by oropharyngeal aspiration, porous silica of both sizes increased neutrophil numbers in BAL fluid at the highest dose level (128 µg/mouse), at all time-points (). At day 1, both sizes of porous particles resulted in more pronounced effects than those of their solid counterparts at 128 µg/mouse (). At the same time, the lowest dose of Porous Silica 300 nm had a greater effect as compared to the lowest dose of its solid counterpart (). On day 3, the highest dose of Porous Silica 300 nm showed a higher effect than the corresponding dose of the solid 300 nm particle. We observed no effects seven days after exposure. We only found minor effects of the solid silica particles at equal mass doses. The positive control, CB Printex 90, increased neutrophil numbers at all time-points ().
In (and ), neutrophil numbers in BAL are shown as function of the total deposited surface area (BET surface area) at 24 h post-exposure (instillation and aspiration). The solid particles did not induce statistically significant inflammation. The porous silica particles of 100 and 300 nm exhibited similar dose-response relations, but were less inflammogenic by surface area than the positive control (carbon black). The pure CuO nanoparticles were the most inflammogenic by surface area (). Porous silica 300 nm-CuO were more inflammogenic than the two porous silica particles with no CuO, suggesting that copper contributed to inflammogenicity on top of the surface area effect (). Concerning porous and solid particles tested by oropharyngeal aspiration (Supplementary Figure S6), a similar pattern emerged over the three time points (1, 3, and 7 days), with the porous particles being less inflammogenic by surface area compared to carbon black. In addition, on day 1, the inflammation induced by100 nm solid silica did not correlate with the specific surface area.
Figure 5. Saa3 mRNA levels in lungs of mice as function of dosed BET surface area of each nanomaterial. The data on Saa3 from are here depicted as function of dosed BET surface area per mouse. The upper panel represents data from 24 h of exposure of porous and non-porous particles; and the lower panel data from 24 h of CuO nanoparticles, porous silica 300 nm CuO and porous silica 300 nm to illustrate the effect of CuO doping. Some error bars are not depicted, as the exponential axis does not accommodate negative values.
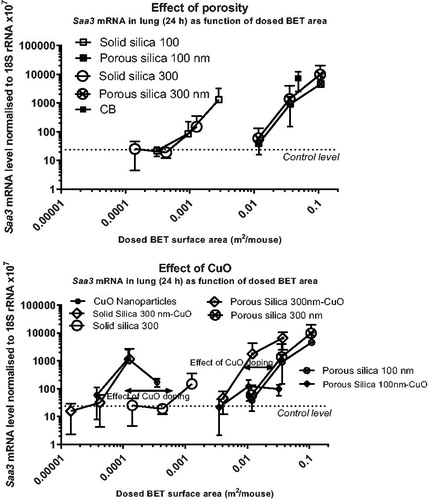
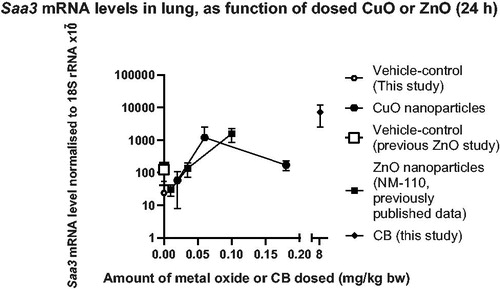
Figure 6. Saa3 mRNA levels in lungs, depicted as function of the dosed amount of CuO (current data) or ZnO (previous data). The amount of CuO in the CuO particle is described in and . The amount of ZnO dosed was calculated as a percentage of 100 of 0.2, 0.7 or 2 µg/mouse equal to ∼0.01, 0.035, and 0.1 mg ZnO/kg bw. The ZnO data were previously published (Hadrup et al. Citation2019). Carbon black (CB) data are from the current study.
Acute phase response determined as saa mRNA levels
At 24 h after intratracheal instillation, Saa3 mRNA levels were increased by both porous particles at the two highest dose levels (43 and 128 µg/mouse) (). Both solid silica particles increased Saa3 mRNA levels at 128 µg/mouse, and a small, but statistically significant, increase was also seen at the lowest dose of the 300 nm solid silica. Porous silica 300 nm-CuO increased Saa3 mRNA levels at 14 and 43 µg/mouse, and small increases were observed for porous silica 100 nm-CuO and solid silica 300 nm-CuO (). No statistically significant differences were found between the treatment groups. The pure CuO nanoparticle induced effects at the two highest dose levels (1.6 and 4.7 µg/mouse) as did the positive control, CB Printex 90 (). At 28 days, only the positive control and the pure CuO nanoparticles sustained increased Saa3 mRNA levels in lungs. In the liver, there were only sporadic effects on Serum amyloid 1 mRNA levels (14 µg porous silica 100 nm, 128 µg porous silica 300 nm and 0.5 µg CuO nanoparticles; Supplementary materials Figure S7).
(and Supplementary materials Figure S8) depict Saa3 mRNA levels in lung as a function of the deposited specific surface area. The dose-response curves for the porous particles were shifted toward lower responses (, upper panel), suggesting that the internal surface area contributes less to induction of acute phase response. For both porous and solid silica with CuO doping, the curves were shifted to the left in comparison to their counterparts with no CuO doping ( lower panel). For the porous 100 nm particles with or with no CuO doping, this shift was less clear.
Genotoxicity
We observed weak genotoxic effects in the comet assay. In BAL fluid cells, the percentage of DNA in the tail was increased only at the lowest dose of porous silica 300 nm-CuO (Supplementary materials Figure S9). In lung tissue, 24 h post-exposure, DNA-damage was increased for the two highest dose levels (4.7 and 14 µg/mouse) of CuO-doped solid silica 300 nm. For the solid silica, 14 µg of solid silica 300 nm-CuO had a greater effect than the equal dose of its un-CuO-doped counterpart – solid silica 300 nm. However, these differences in response are not indicated on the graph as no dose-response relations were seen for these treatments. Increases were also observed for the lowest dose of CuO nanoparticles and for the positive control CB Printex 90 (Supplementary materials Figure S10). In the liver, 24 h after exposure, the only increase in percentage DNA in the comet tail was seen after exposure to the porous silica 300 nm particles at the highest dose (128 µg/mouse), which also had a greater effect than the same dose of its solid counterpart (Supplementary materials Figure S11).
None of the tested nanoparticles significantly increased the frequency of micronucleated normochromatic erythrocytes (MNNCEs) 28 day post-administration (Supplementary materials Figure S12). The frequency of MNNCEs reflects chromosome damage accumulated from the treatment until about 60 h prior to blood sampling. In all treated groups, the percentage of polychromatic (immature) erythrocytes among blood erythrocytes was similar to the negative control group, indicating that the NPs did not show bone marrow toxicity. There was no increased induction of DNA double-strand breaks (assessed by the γ-H2AX assay) in the lungs of mice treated with the highest dose of each material 28 days after exposure (Supplementary Figure S13).
Histopathology
In the intratracheal instillation study, there were no pathological changes in the lung, liver, kidney or spleen (28 days post exposure). Histopathological evaluation of the lungs of the oropharyngeally treated mice revealed that administration of porous silica materials caused moderate perivascular and peribronchial inflammatory cell infiltration by eosinophils and neutrophils in lung tissue 24 h post-exposure at 128 µg/mouse (microscopy images from day 1 and 7 post exposure are shown in Supplementary materials Figures S14 and S15). In contrast, only mild inflammatory infiltrates were observed in response to the solid silica materials. Inflammation reduced gradually from day 1 to 7. At day 7, the remaining infiltrates triggered by porous particles were predominantly lymphocytic with the presence of some eosinophils. In addition, the 300-nm porous silica particles seemed to induce milder inflammation in the lung tissue at day 7 than the 100-nm particles, and lung tissue exposed to the solid silica materials exhibited less activity than tissue exposed to porous materials. Carbon black induced similar effects as the porous silica particles at all time-points.
Discussion
We aimed to assess if the toxicity of silica nanomaterials was increased by the introduction of: a) porosity; and b) CuO doping; and whether c) the combined effects of these modifications were additive or synergistic. For this, silica-based nanomaterials with various combinations of porosity and CuO-doping were synthesized. We assessed particle toxicity by intratracheal instillation into the lungs of mice; in addition, we tested the silica particles in an independent oropharyngeal aspiration study.
Toxicological effect of porosity
Porosity increased pulmonary toxicity in terms of accumulation of neutrophil cells in bronchoalveolar lavage fluid (), and increased levels of Saa3 mRNA levels in lung tissue, at the same dose level by mass (). In addition, porous silica 100 nm seemed to be more persistent in BAL fluid cells as compared to its solid counterpart, as it was still present at 43 µg/mouse at the 28-day time point (Figure S2). We corroborated the finding of increased toxicity of porosity in a separate study using oropharyngeal aspiration and follow-up at 1, 3 and 7 days (). In addition, the porous silica materials induced moderate perivascular and peribronchial inflammatory cell infiltration by histopathological evaluation, whereas we only observed mild inflammatory infiltrates in response to the solid silica materials (Supplementary materials Figures S14 and S15).
The increased toxicity by mass of the porous compared to the solid silica particles could be caused by the increased deposited surface area. Deposited surface area has previously been reported as a predictor of inflammation and acute phase response (Saber et al. Citation2013; Citation2014, Poulsen et al. Citation2016, Schmid and Stoeger Citation2016, Hadrup, Saber, et al. Citation2020, Saber et al. Citation2019, Barfod et al. Citation2020, Danielsen et al. Citation2020, Hadrup, Zhernovkov, et al. Citation2020). We therefore plotted neutrophil numbers and Saa3 mRNA levels as functions of the total deposited specific surface area. It appeared that dosage with porous compared to solid silica particles shift the curves to the right (higher dose levels needed to exert a response) as compared to the positive control, carbon black ( and Supplementary materials Figure S6). Possible explanations for this include differences in surface-specific reactivity, or that the internal surface area of the porous particles contributes less to surface-dependent inflammation and Saa3 mRNA levels than the external surface area. Notably, the number of particles dosed per mass unit is also higher for the porous silica particles, as each particle weighs less due to the lower density of the porous particles.
Our data contradict a previous report where solid, but not porous silica nanoparticles, induced pulmonary inflammation (Park et al. Citation2015). This might be explained by differences in dose levels, as the latter study used porous particles with a lower specific surface area than in our materials, i.e. 70.6 m2/g vs. around 800 m2/g in the present study. Moreover, exposure was by intranasal inoculation as compared to intratracheal instillation and oropharyngeal aspiration in our studies. Observations in a study exposing mice by intraperitoneal injection are however in line with ours, in that porous silica nanoparticles induced higher immuno-toxicity than equal mass doses of colloidal solid silica (Lee et al. Citation2013).
Toxicological effects of CuO doping
Doping CuO onto silica particles increased their toxicity: porous silica 300 nm-CuO increased neutrophil numbers in BAL fluid at 43 µg/mouse. No effect was observed at this dose level for the un-doped porous silica 300 nm particle (). Similarly, Saa3 mRNA levels in lung tissue increased at 14 µg/mouse, after dosage with porous silica 300 nm-CuO, but not after dosage of porous silica 300 nm with no CuO doping (). The pure CuO nanoparticles increased Saa3 mRNA levels at both time points – at 28 days at all three dose levels. The copper content in lung was increased 24 hours after exposure to pure CuO nanoparticles (at 4.7 µg/mouse, the only tested dose at 24 h), but not 28 days post exposure (Figure S3). Thus, toxicity was observed in the absence of detectable CuO particles at day 28. In addition, the pure CuO particle was very toxic in the pilot study and it increased neutrophil numbers at low dose level (). Collectively, these data suggest that copper is highly toxic through induction of inflammation and acute phase response in the lung at low levels of exposure. In line with this, blood levels of SAA and C-reactive protein were increased in male volunteers exposed to welding fumes containing copper (Markert et al. Citation2016, Baumann et al. Citation2018). In these studies, the effects of copper were seen at 0.4 mg/m3, and similar effects of Zn were seen at 1.5 mg/m3. When comparing the pulmonary toxicity of the CuO particles in the current study with a previous study on ZnO nanoparticles (Hadrup et al. Citation2019), the two soluble metal oxides have similar potency in inducing Saa3 mRNA in lung (). The acute phase response is a risk factor for coronary heart disease (Saber et al. Citation2013; Citation2014, Thompson et al. Citation2018, Hadrup, Zhernovkov, et al. Citation2020) and the current results therefore link especially exposure to CuO with risk of cardiovascular disease.
CuO-induced inflammation appears to be driven by dissolution of copper (Gosens et al. Citation2016, Jeong, Lee, et al. Citation2016), and copper dosed as salts seems to be more toxic than when dosed as CuO nanoparticles, suggesting that the ions are more toxic (toxic in the microgram per kg bw range) (Hirano et al. Citation1990, Rice et al. Citation2001, Prieditis and Adamson Citation2002, Wallenborn et al. Citation2009). When neutrophil numbers in BAL fluid or Saa3 mRNA levels in lung tissue were depicted as function of the deposited surface area ( and ), pure CuO particles induced a higher accumulation of neutrophils on day 1 than predicted by the dosed surface area. The curve for porous silica 300 nm-CuO was shifted to the left of porous silica 300 nm with no CuO doping (), suggesting that, in addition to the dosed surface area, copper contributes to the toxicity. Concerning Saa3 mRNA levels, the effect of CuO doping was most clearly seen for the solid silica 300 nm particle as compared with the two porous ones (). This may suggest that the dissolution and release of copper ions from CuO was slower inside the porous silica particles.
CuO nanoparticles have previously been demonstrated to be soluble in lung tissue and in simulated biological fluids (Gosens et al. Citation2016). Gosens et al. (Citation2016) reported elevated copper levels in lung tissue 1 day after the last inhalation exposure to CuO nanoparticles in rats, whereas copper levels had returned to background levels 22 days post-exposure. We found elevated copper levels in lung tissue 24 h post-exposure for the highest dose group of the CuO nanoparticle, whereas copper levels in CuO-exposed lung tissues were comparable to control tissues at 28 days for all particle-types containing CuO (Supplementary Materials Figure S3). On the other hand, particle-presence was indicated in BAL cells 28 days post-exposure for all particle types except 300 nm solid silica-CuO and CuO nanoparticles (Supplementary Materials Figure S2). Taken together, this may suggest that the CuO had dissolved for all particle types 28 days post-exposure in line with the observations by Gosens et al. (Citation2016). We observed neutrophil influx 24 h post-exposure from 60 µg CuO/kg bw both for the pure CuO particle, and the porous silica 300 nm-CuO. This is in the same dose range as previously observed for copper salts, inducing neutrophil influx in the dose range of 6 to 80 µg/kg bw (Hirano et al. Citation1990; Rice et al. Citation2001; Wallenborn et al. Citation2009). A limitation of the current study is that we did not assess the short-term solubility of the studied particles, information that could have been related to their toxic effects.
In the current work, we assessed genotoxicity with three different assays – the comet assay, micronucleus test, and γ-H2AX assay. Weak genotoxic effects were observed only in the comet assay—including, in lung, at the two highest dose levels of solid silica 300 nm-CuO at 24 hours post exposure (Supplementary materials Figure S10). We did not identify other studies with pulmonary exposure investigating genotoxicity. However, after oral gavage, copper sulfate was genotoxic in mice at dose levels of around 8.5 mg Cu/kg bw (Franke et al. Citation2006, Prá et al. Citation2008) as were Cu ions administered to mice as CuCl2 in the drinking water at ∼8 mg/kg bw (Corona-Rivera et al. Citation2007). This suggests that copper ions have a genotoxic potential. The copper exposure levels ranged between 0.01 and 0.18 mg/kg bw in the present study, and it is noteworthy that we observed genotoxic effects at these low dose levels.
Taken together, our data indicate that CuO surface-doping and small CuO particles may exert a level of toxicity similar to that seen for copper salts. This should be taken into account when assessing the risk associated with exposure to nanoparticles doped with soluble substances of copper or other soluble metals.
Synergy hypothesis
When neutrophil numbers were evaluated in BAL fluid 24 hours post exposure, we found no indications of synergism between the 100 nm silica particles and doping with CuO. Porous silica 100 nm-CuO did not induce more inflammation than any of its two building blocks: the porous silica 100 nm, and the pure CuO nanoparticles (with a similar amount of CuO as in the doped 100 nm particles) (Supplementary materials Figure S4). Moreover, for the 300 nm particles, the inflammation induced by the porous 300 nm-CuO could be explained by the sum of CuO and surface area effects, although no mathematical model is available for the combination of non-chemical modifications – in this case, porosity (Supplementary materials Figure S4). A similar pattern was seen for Saa3 mRNA levels 24 hours post exposure (Supplementary materials Figure S4).
Conclusion
The introduction of porosity increased the toxicity of silica particles per mass unit. The increased accumulation of neutrophils in BAL fluid could be explained by the deposited surface area. CuO doping also increased the toxicity. Overall, our study suggests that introduction of internal surface area by porosity or CuO doping increases the mass-based toxicity. Furthermore, we found no evidence of positive synergistic effects in relation to pulmonary toxicity.
TNAN-2020-OR-0210-File008.docx
Download MS Word (4.4 MB)Acknowledgments
The excellent technical assistance of Eva Terrida, Michael Guldbrandsen, Dorte Larsen, Noor Irmam, Yasmin Akhtar, Anne-Karin Asp, Ulla Tegner, Anne Abildtrup, Katriina Huumonen, Katja Välimäki, Annabrita Schoonenberg, Piia Karisola and Sauli Savukoski is greatly appreciated.
Disclosure statement
No potential conflict of interest was reported by the author(s).
Additional information
Funding
References
- Adamcakova-Dodd, A., M. M. Monick, L. S. Powers, K. N. Gibson-Corley, and P. S. Thorne. 2015. “Effects of Prenatal Inhalation Exposure to Copper Nanoparticles on Murine Dams and Offspring.” Particle and Fibre Toxicology 12: 30. doi:10.1186/s12989-015-0105-5.
- Auyeung, E., W. Morris, J. E. Mondloch, J. T. Hupp, O. K. Farha, and C. A. Mirkin. 2015. “Controlling Structure and Porosity in Catalytic Nanoparticle Superlattices with DNA.” Journal of the American Chemical Society 137 (4): 1658–1662. doi:10.1021/ja512116p.
- Baeza, A., D. Ruiz-Molina, and M. Vallet-Regí. 2017. “Recent Advances in Porous Nanoparticles for Drug Delivery in Antitumoral Applications: inorganic Nanoparticles and Nanoscale metal-organic frameworks.” Expert Opinion on Drug Delivery 14 (6): 783–796. doi:10.1080/17425247.2016.1229298.
- Barfod, K. K., K. M. Bendtsen, T. Berthing, A. J. Koivisto, S. S. Poulsen, E. Segal, E. Verleysen, et al. 2020. “Increased Surface Area of Halloysite Nanotubes Due to Surface Modification Predicts Lung Inflammation and Acute Phase Response after Pulmonary Exposure in Mice.” Environmental Toxicology and Pharmacology 73: 103266. doi:10.1016/j.etap.2019.103266.
- Baumann, R., M. Gube, A. Markert, S. Davatgarbenam, V. Kossack, B. Gerhards, T. Kraus, and P. Brand. 2018. “Systemic Serum Amyloid a as a Biomarker for Exposure to Zinc and/or copper-containing metal fumes.” Journal of Exposure Science & Environmental Epidemiology 28 (1): 84–91. doi:10.1038/jes.2016.86.
- Bengtson, S., K. B. Knudsen, Z. O. Kyjovska, T. Berthing, V. Skaug, M. Levin, I. K. Koponen, et al. 2017. “Differences in Inflammation and Acute Phase Response but Similar Genotoxicity in Mice following Pulmonary Exposure to Graphene Oxide and Reduced Graphene Oxide.” PLoS One 12 (6): e0178355 doi:10.1371/journal.pone.0178355.
- Cho, W. S., R. Duffin, C. A. Poland, A. Duschl, G. J. Oostingh, W. MacNee, M. Bradley, I. L. Megson, and K. Donaldson. 2012. “Differential pro-inflammatory effects of metal oxide nanoparticles and their soluble ions in vitro and in vivo; zinc and copper nanoparticles, but not their ions, recruit eosinophils to the lungs .” Nanotoxicology 6 (1): 22–35. (1743-5404 (Electronic)), doi:10.3109/17435390.2011.552810.
- Cho, W. S., R. Duffin, C. A. Poland, S. E. Howie, W. MacNee, M. Bradley, I. L. Megson, and K. Donaldson. 2010. “Metal Oxide Nanoparticles Induce Unique Inflammatory Footprints in the Lung: important Implications for Nanoparticle Testing.” Environmental Health Perspectives 118 (12): 1699–1706. (1552-9924 (Electronic)), doi:10.1289/ehp.1002201.
- Corona-Rivera, A., P. Urbina-Cano, L. Bobadilla-Morales, J. de J. Vargas-Lares, M. A. Ramirez-Herrera, M. L. Mendoza-Magaua, R. Troyo-Sanroman, P. Diaz-Esquivel, and J. R. Corona-Rivera. 2007. “Protective in Vivo Effect of Curcumin on Copper Genotoxicity Evaluated by Comet and Micronucleus Assays.” Journal of Applied Genetics 48 (4): 389–396. doi:10.1007/BF03195238.
- Danielsen, P. H., K. B. Knudsen, J. Štrancar, P. Umek, T. Koklič, M. Garvas, E. Vanhala, et al. 2020. “Effects of Physicochemical Properties of TiO2 Nanomaterials for Pulmonary Inflammation, Acute Phase Response and Alveolar Proteinosis in Intratracheally Exposed Mice.” Toxicology and Applied Pharmacology 386: 114830 doi:10.1016/j.taap.2019.114830.
- El-Trass, A., H. ElShamy, I. El-Mehasseb, and M. El-Kemary. 2012. “CuO Nanoparticles: Synthesis, Characterization, Optical Properties and Interaction with Amino Acids.” Applied Surface Science 258 (7): 2997–3001.
- Franke, S. I. R., D. Prá, R. Giulian, J. F. Dias, M. L. Yoneama, J. da Silva, B. Erdtmann, and J. A. P. Henriques. 2006. “Influence of Orange Juice in the Levels and in the Genotoxicity of Iron and copper.” Food and Chemical Toxicology 44 (3): 425–435. doi:10.1016/j.fct.2005.08.016.
- Gosens, I., F. R. Cassee, M. Zanella, L. Manodori, A. Brunelli, A. L. Costa, B. G. H. Bokkers, et al. 2016. “Organ Burden and Pulmonary Toxicity of Nano-Sized Copper (II) Oxide Particles after Short-Term Inhalation Exposure.” Nanotoxicology 10 (8): 1084–1095. doi:10.3109/17435390.2016.1172678.
- Graf, C., D. L. J. Vossen, A. Imhof, and A. van Blaaderen. 2003. “A General Method to Coat Colloidal Particles with Silica.” Langmuir 19 (17): 6693–6700.
- Hadrup, N. 2014. “Evidence from Pharmacology and Pathophysiology Suggests That Chemicals with Dissimilar Mechanisms of Action Could Be of Bigger Concern in the Toxicological Risk Assessment of Chemical Mixtures than Chemicals with a Similar Mechanism of Action.” Regulatory Toxicology and Pharmacology : RTP 69 (3): 281–283. doi:10.1016/j.yrtph.2014.05.007.
- Hadrup, N., S. Bengtson, N. R. Jacobsen, P. Jackson, M. Nocun, A. T. Saber, K. A. Jensen, H. Wallin, and U. Vogel. 2017. “Influence of Dispersion Medium on Nanomaterial-Induced Pulmonary Inflammation and DNA Strand Breaks: Investigation of Carbon Black, Carbon Nanotubes and Three Titanium Dioxide Nanoparticles.” Mutagenesis 32 (6): 581–597.
- Hadrup, N., M. Pedersen, K. Skov, N. L. Hansen, L. O. Berthelsen, K. Kongsbak, J. Boberg, et al. 2016. “Perfluorononanoic Acid in Combination with 14 Chemicals Exerts Low-Dose Mixture Effects in Rats.” Archives of Toxicology 90 (3): 661–675.
- Hadrup, N., F. Rahmani, N. R. Jacobsen, A. T. Saber, P. Jackson, S. Bengtson, A. Williams, H. Wallin, S. Halappanavar, and U. Vogel. 2019. “Acute Phase Response and Inflammation following Pulmonary Exposure to Low Doses of Zinc Oxide Nanoparticles in Mice.” Nanotoxicology 13 (9): 1275–1292. doi:10.1080/17435390.2019.1654004.
- Hadrup, N., A. T. Saber, Z. O. Kyjovska, N. R. Jacobsen, M. Vippola, E. Sarlin, Y. Ding, et al. 2020. “Pulmonary Toxicity of Fe2O3, ZnFe2O4, NiFe2O4 and NiZnFe4O8 Nanomaterials: Inflammation and DNA Strand Breaks.” Environmental Toxicology and Pharmacology 74: 103303. doi:10.1016/j.etap.2019.103303.
- Hadrup, N., C. Taxvig, M. Pedersen, C. Nellemann, U. Hass, and A. M. Vinggaard. 2013. “Concentration Addition, Independent Action and Generalized Concentration Addition Models for Mixture Effect Prediction of Sex Hormone Synthesis in Vitro.” PLoS One 8 (8): e70490.
- Hadrup, N., V. Zhernovkov, N. R. Jacobsen, C. Voss, M. Strunz, M. Ansari, H. B. Schiller, et al. 2020. “Acute Phase Response as a Biological Mechanism-of-Action of (Nano)particle-Induced Cardiovascular Disease.” Small (Weinheim an Der Bergstrasse, Germany) 16 (21): e1907476.
- Hirano, S., S. Sakai, H. Ebihara, N. Kodama, and K. T. Suzuki. 1990. “Metabolism and Pulmonary Toxicity of Intratracheally Instilled Cupric Sulfate in rats.” Toxicology 64 (3): 223–233.
- Jackson, P., L. M. Pedersen, Z. O. Kyjovska, N. R. Jacobsen, A. T. Saber, K. S. Hougaard, U. Vogel, and H. Wallin. 2013. “Validation of Freezing Tissues and Cells for Analysis of DNA Strand Break Levels by Comet Assay.” Mutagenesis 28 (6): 699–707.
- Jackson, P., S. P. Lund, G. Kristiansen, O. Andersen, U. Vogel, H. Wallin, and K. S. Hougaard. 2011. “An Experimental Protocol for Maternal Pulmonary Exposure in Developmental Toxicology.” Basic & Clinical Pharmacology & Toxicology 108 (3): 202–207. doi:10.1111/j.1742-7843.2010.00644.x.
- Jacobsen, N. R., G. Pojana, P. White, P. Moller, C. A. Cohn, K. S. Korsholm, U. Vogel, A. Marcomini, S. Loft, and H. Wallin. 2008. “Genotoxicity, Cytotoxicity, and Reactive Oxygen Species Induced by Single-Walled Carbon Nanotubes and C(60) Fullerenes in the FE1-Mutatrade markMouse Lung Epithelial Cells.” Environmental and Molecular Mutagenesis 49 (6): 476–487. (1098-2280 (Electronic)), doi:10.1002/em.20406.
- Jeong, J.,. J. Kim, S. H. Seok, and W.-S. Cho. 2016. “Indium Oxide (In2O3) Nanoparticles Induce Progressive Lung Injury Distinct from Lung Injuries by Copper Oxide (CuO) and Nickel Oxide (NiO) Nanoparticles.” Archives of Toxicology 90 (4): 817–828. doi:10.1007/s00204-015-1493-x.
- Jeong, J.,. S. Lee, S.-H. Kim, Y. Han, D.-K. Lee, J.-Y. Yang, J. Jeong, C. Roh, Y. S. Huh, and W.-S. Cho. 2016. “Evaluation of the Dose Metric for Acute Lung Inflammogenicity of Fast-Dissolving Metal Oxide Nanoparticles.” Nanotoxicology 10 (10): 1448–1457. doi:10.1080/17435390.2016.1229518.
- Koohestani, H., H. Mansouri, A. Pirmoradian, and M. Hassanabadi. 2020. “Investigation of Photocatalytic Efficiency of Supported CuO Nanoparticles on Natural Zeolite Particles in Photodegradation of Methyl Orange.” Journal of Nanoscience and Nanotechnology 20 (9): 5964–5969. doi:10.1166/jnn.2020.18548.
- Kyjovska, Z. O., N. R. Jacobsen, A. T. Saber, S. Bengtson, P. Jackson, H. Wallin, and U. Vogel. 2015. “DNA Damage following Pulmonary Exposure by Instillation to Low Doses of Carbon Black (Printex 90) Nanoparticles in Mice.” Environmental and Molecular Mutagenesis 56 (1): 41–49. (1098-2280 (Electronic)), doi:10.1002/em.21888.
- Lee, S., M.-S. Kim, D. Lee, T. K. Kwon, D. Khang, H.-S. Yun, and S.-H. Kim. 2013. “The Comparative Immunotoxicity of Mesoporous Silica Nanoparticles and Colloidal Silica Nanoparticles in Mice.” International Journal of Nanomedicine 8: 147–158. doi:10.2147/IJN.S39534.
- Lindberg, H. K., G. C.-M. Falck, J. Catalán, A. J. Koivisto, S. Suhonen, H. Järventaus, E. M. Rossi, et al. 2012. “Genotoxicity of Inhaled Nanosized TiO(2) in Mice.” Mutation Research 745 (1-2): 58–64. doi:10.1016/j.mrgentox.2011.10.011.
- Markert, A., R. Baumann, B. Gerhards, M. Gube, V. Kossack, T. Kraus, and P. Brand. 2016. “Single and Combined Exposure to Zinc- and Copper-Containing Welding Fumes Lead to Asymptomatic Systemic Inflammation.” Journal of Occupational and Environmental Medicine 58 (2): 127–132. doi:10.1097/JOM.0000000000000652.
- Minigalieva, I. A., B. A. Katsnelson, V. G. Panov, L. I. Privalova, A. N. Varaksin, V. B. Gurvich, M. P. Sutunkova, et al. 2017. “In Vivo Toxicity of Copper Oxide, Lead Oxide and Zinc Oxide Nanoparticles Acting in Different Combinations and Its Attenuation with a Complex of Innocuous Bio-Protectors.” Toxicology 380: 72–93. doi:10.1016/j.tox.2017.02.007.
- Park, H. J., J.-H. Sohn, Y.-J. Kim, Y. H. Park, H. Han, K. H. Park, K. Lee, et al. 2015. “Acute Exposure to Silica Nanoparticles Aggravate Airway Inflammation: different Effects according to Surface Characteristics.” Experimental & Molecular Medicine 47: e173. doi:10.1038/emm.2015.50.
- Plappert-Helbig, U., S. Libertini, W. Frieauff, D. Theil, and H.-J. Martus. 2019. “Gamma-H2AX Immunofluorescence for the Detection of tissue-specific genotoxicity in vivo.” Environmental and Molecular Mutagenesis 60 (1): 4–16. doi:10.1002/em.22238.
- Poulsen, S. S., P. Jackson, K. Kling, K. B. Knudsen, V. Skaug, Z. O. Kyjovska, B. L. Thomsen, et al. 2016. “Multi-Walled Carbon Nanotube Physicochemical Properties Predict Pulmonary Inflammation and Genotoxicity.” Nanotoxicology 10 (9): 1263–1275. (1743-5404 (Electronic)), doi:10.1080/17435390.2016.1202351.
- Poulsen, S. S., K. B. Knudsen, P. Jackson, I. E. K. Weydahl, A. T. Saber, H. Wallin, and U. Vogel. 2017. “Multi-Walled Carbon Nanotube-Physicochemical Properties Predict the Systemic Acute Phase Response following Pulmonary Exposure in Mice.” PLoS One 12 (4): e0174167 doi:10.1371/journal.pone.0174167.
- Prá, D., S. I. R. Franke, R. Giulian, M. L. Yoneama, J. F. Dias, B. Erdtmann, and J. A. P. Henriques. 2008. “Genotoxicity and Mutagenicity of Iron and Copper in mice.” Biometals : An International Journal on the Role of Metal Ions in Biology, Biochemistry, and Medicine 21 (3): 289–297. doi:10.1007/s10534-007-9118-3.
- Prieditis, H., and I. Y. R. Adamson. 2002. “Comparative Pulmonary Toxicity of Various Soluble Metals Found in Urban Particulate Dusts.” Experimental Lung Research 28 (7): 563–576. doi:10.1080/01902140290096782.
- Rice, T. M., R. W. Clarke, J. J. Godleski, E. Al-Mutairi, N. F. Jiang, R. Hauser, and J. D. Paulauskis. 2001. “Differential Ability of Transition Metals to Induce Pulmonary Inflammation.” Toxicology and Applied Pharmacology 177 (1): 46–53. doi:10.1006/taap.2001.9287.
- Rydman, E. M., M. Ilves, E. Vanhala, M. Vippola, M. Lehto, P. A. S. Kinaret, L. Pylkkänen, et al. 2015. “A Single Aspiration of Rod-like Carbon Nanotubes Induces Asbestos-like Pulmonary Inflammation Mediated in Part by the IL-1 Receptor.” Toxicological Sciences : An Official Journal of the Society of Toxicology 147 (1): 140–155. doi:10.1093/toxsci/kfv112.
- Saber, A. T., J. Bornholdt, M. Dybdahl, A. K. Sharma, S. Loft, U. Vogel, and H. Wallin. 2005. “Tumor Necrosis Factor is Not Required for Particle-Induced Genotoxicity and Pulmonary Inflammation.” Archives of Toxicology 79 (3): 177–182. (0340-5761 (Print)), doi:10.1007/s00204-004-0613-9.
- Saber, A. T., N. R. Jacobsen, P. Jackson, S. S. Poulsen, Z. O. Kyjovska, S. Halappanavar, C. L. Yauk, H. Wallin, and U. Vogel. 2014. “Particle-Induced Pulmonary Acute Phase Response May Be the Causal Link between Particle Inhalation and Cardiovascular Disease.” Wiley Interdisciplinary Reviews. Nanomedicine and Nanobiotechnology 6 (6): 517–531. (1939–0041 (Electronic)), doi:10.1002/wnan.1279.
- Saber, A. T., J. S. Lamson, N. R. Jacobsen, G. Ravn-Haren, K. S. Hougaard, A. N. Nyendi, P. Wahlberg, et al. 2013. “Particle-Induced Pulmonary Acute Phase Response Correlates with Neutrophil Influx Linking Inhaled Particles and Cardiovascular Risk.” PLoS One 8 (7): e69020. (1932-6203 (Electronic)), doi:10.1371/journal.pone.0069020.
- Saber, A. T., A. Mortensen, J. Szarek, N. R. Jacobsen, M. Levin, I. K. Koponen, K. A. Jensen, U. Vogel, and H. Wallin. 2019. “Toxicity of Pristine and paint-embedded TiO2 nanomaterials .” Human & Experimental Toxicology 38 (1): 11–24. doi:10.1177/0960327118774910.
- Sahlgren, N., R. Atluri, O. Aguerre-Chariol, Y. Kembouche, P. Clausen, and K. Jensen. n.d. “Physicochemical Characteristics of Mesoporous Silica with and without CuO-Doping and Their Dissolution in Artificial Lung Fluids.” In preparation.
- Schmid, O., and T. Stoeger. 2016. “Surface Area is the Biologically Most Effective Dose Metric for Acute Nanoparticle Toxicity in the Lung.” Journal of Aerosol Science 99: 133–143.
- Smeets, V., L. Ben Mustapha, J. Schnee, E. M. Gaigneaux, and D. P. Debecker. 2018. “Mesoporous SiO2-TiO2 Epoxidation Catalysts: Tuning Surface Polarity to Improve Performance in the Presence of Water.” Molecular Catalysis 452: 123–128.
- Thompson, J. C., P. G. Wilson, P. Shridas, A. Ji, M. de Beer, F. C. de Beer, N. R. Webb, and L. R. Tannock. 2018. “Serum Amyloid A3 is Pro-Atherogenic.” Atherosclerosis 268: 32–35.
- Wallenborn, J. G., M. J. Schladweiler, J. H. Richards, and U. P. Kodavanti. 2009. “Differential Pulmonary and Cardiac Effects of Pulmonary Exposure to a Panel of Particulate Matter-Associated Metals.” Toxicology and Applied Pharmacology 241 (1): 71–80. doi:10.1016/j.taap.2009.08.003.
- Witoon, T., T. Numpilai, T. Phongamwong, W. Donphai, C. Boonyuen, C. Warakulwit, M. Chareonpanich, and J. Limtrakul. 2018. “Enhanced Activity, Selectivity and Stability of a CuO-ZnO-ZrO2 Catalyst by Adding Graphene Oxide for CO2 Hydrogenation to Methanol.” Chemical Engineering Journal 334: 1781–1791.
- Wu, S.-H., C.-Y. Mou, and H.-P. Lin. 2013. “Synthesis of Mesoporous Silica Nanoparticles.” Chemical Society Reviews 42 (9): 3862–3875. doi:10.1039/c3cs35405a.
- Yokohira, M., N. Hashimoto, K. Yamakawa, S. Suzuki, K. Saoo, T. Kuno, and K. Imaida. 2009. “Lung Carcinogenic Bioassay of CuO and TiO(2) Nanoparticles with Intratracheal Instillation Using F344 Male Rats.” Journal of Toxicologic Pathology 22 (1): 71–78. (0914-9198 (Print)), doi:10.1293/tox.22.71.
- Zhang, Q., K. Zhang, D. Xu, G. Yang, H. Huang, F. Nie, C. Liu, and S. Yang. 2014. “CuO Nanostructures: Synthesis, Characterization, Growth Mechanisms, Fundamental Properties, and Applications.” Progress in Materials Science 60: 208–337.
- Zhao, S., D. Xu, H. Ma, Z. Sun, and J. Guan. 2012. “Controllable Preparation and Formation Mechanism of Monodispersed Silica Particles with Binary Sizes.” Journal of Colloid and Interface Science 388 (1): 40–46. doi:10.1016/j.jcis.2012.08.012.