
 ?Mathematical formulae have been encoded as MathML and are displayed in this HTML version using MathJax in order to improve their display. Uncheck the box to turn MathJax off. This feature requires Javascript. Click on a formula to zoom.
Abstract
New registration requirements for nanomaterials under REACH consider the possibility to form ‘sets of similar nanoforms’ for a joined human health and environmental hazard, exposure and risk assessment. We developed a tool to create and justify sets of similar nanoforms and to ensure that each of the nanoforms is sufficiently similar to all other nanoforms. The decision logic is following the ECHA guidance in a transparent and evidence-based manner. For each two nanoforms the properties under consideration are compared and corresponding thresholds for maximal differences are proposed. In tier1, similarity is assessed based on intrinsic properties that mostly correspond to those required for nanoform identification under REACH: composition, impurities/additives, size, crystallinity, shape and surface treatment. Moreover, potential differences in the agglomeration/aggregation state resulting from different production processes are considered. If nanoforms were not sufficiently similar based on tier1 criteria, additional data from functional assays are required in tier2. In rare cases, additional short-term in vivo rodent data could be required in a third tier. Data required by tier 2 are triggered by the intrinsic properties in the first tier that did not match the similarity criteria. Most often this will be data on dissolution and surface reactivity followed by in vitro toxicity, dispersion stability, dustiness. Out of several nanoforms given by the user, the tool concludes which nanoforms could be justified to be in the same set and which nanoforms are outside. It defines the boundaries of sets of similar nanoforms and generates a justification for the REACH registration.
1. Background and regulatory framework
On 3 December 2018 the Commission adopted Commission Regulation (EU) 2018/1881 to modify REACH Annexes I, III and VI-XII, and clarify REACH registration requirements with regards to nanomaterials. These amendments entered into force in 1 January 2020 for the new as well as the existing registrations. Among other provisions, the modified Annex VI of REACH defines ‘nanoform’ and ‘set of similar nanoforms’ and establishes the requirements to identify and characterize nanoforms of the substance covered by the registration (see Supplementary Table 1). These nanoforms can be documented individually or jointly in sets of similar nanoforms by providing clear identification of size, shape, surface chemistry and surface area of particles of the nanoforms covered by the registration.
In order to provide advice to registrants preparing registration dossiers that cover nanoforms, ECHA published the ‘Appendix for nanoforms applicable to the Guidance on Registration and Guidance on Substance Identification’ (which we will refer from now as ‘the Appendix for nanoforms’). This guidance explains how to create and justify sets of nanoforms, and details reporting requirements for the registration of either individual nanoforms or sets of nanoforms (ECHA Citation2019a).
2. Basic concept and structure of the ECETOC tool
Several frameworks on grouping of nanoforms existed already. Some of these were purely conceptual (Oomen et al. Citation2015; Sellers et al. Citation2015); some followed statistical approaches (clustering or regression analyses) to group nanomaterials (Drew et al. Citation2017; Knudsen et al. Citation2019); and others developed specific grouping rules based on fixed boundaries and pre-defined categories, as in DF4nano (Arts et al. Citation2015) or Nanogravur (Hund-Rinke et al. Citation2018; Wohlleben et al. Citation2019). Most of these frameworks focused on specific hazard endpoints and had not been developed just for nanoforms of the same substance, but for broader groups of nanoforms. Hence, they would not be sufficient to support sets of similar nanoforms.
The development of the tool that we are presenting was commissioned by ECETOC to support industry in the registration of sets of nanoforms, as well as regulators in the evaluation of these registration dossiers. The ECETOC tool considered the concepts developed in existing grouping frameworks and took them a step forward by developing a systematic approach to create and justify sets of similar nanoforms, following the ECHA guidance in a transparent and evidence-based manner.
This manuscript describes the decision criteria and logic behind this tool and the rational that led to it. In short, the approach is based on ensuring that each of the nanoforms within a set is sufficiently similar to all other nanoforms within that set, in terms of hazard, exposure, and risk assessment for all endpoints. The similarity assessment consists of three Tiers (). In the first Tier, similarity is assessed based on thresholds for maximal differences in intrinsic properties (mostly corresponding to those required for REACH registration; see first column in ). If similarity is sufficient for all of the properties considered, nanoforms can be grouped as a set. If not, depending on their level of dissimilarity in intrinsic properties, it is concluded either that they cannot be included into the same set (if differences of intrinsic properties are large) or that a tier 2 assessment is needed (it differences of intrinsic properties are small, but above the thresholds set in tier 1). In the second tier, additional data (see second column in ) are required to assess whether nanoforms are similar based on their functionality (extrinsic properties) and can it hence be justified to group them in the same set. Specific assays to generate the data are suggested and thresholds for maximal differences are defined. In rare cases a short-term in vivo inhalation study may be required as a third tier.
Figure 1. Tiered approach for building and justification of sets of nanoforms.
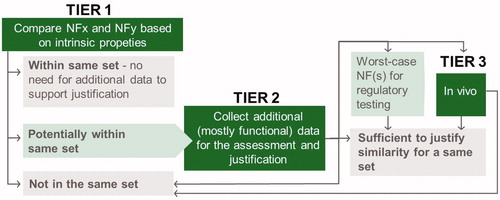
Table 1. Properties taken into consideration for evaluation of similarity.
In some scenarios, a wider dissimilarity can be accepted in a set of similar nanoforms, as long as the worst-case nanoform is selected as representative of the whole set for testing to fill in information requirements in REACH. The ECHA guidance foresees that nanoforms within a set can differ in their properties if this is gradually and in a predictable way. This would be the case, for instance, of a gradual increase in dissolution and reactivity with decreasing size.
Our proposal aligns with the premises outlined in the Appendix for nanoforms (ECHA Citation2019a). It proposes methods and criteria to conclude on pairwise similarity between two nanoforms, and it is based on unambiguous decision rules for each of the key parameters identified by the guidance, and others that are also considered necessary to assess whether variations across the nanoforms could affect their hazard, exposure, and risk assessment. The decision criteria were derived based on the current state-of-the-art of nanosafety. The datasets of nanoforms to test these criteria are still rather limited, and the decision rules may need revision once more data becomes available. ECHA has not yet formally endorsed the tool to be used for REACH registrations, although they have shown interest in it and a nanopinion has been published in the European Union Observatory for Nanomaterials (EUoN Citation2020). Albeit a formal endorsement is coveted, the tool is fully valid and applicable without, as long as it is based on scientifically sound and transparent criteria.
A follow-up manuscript in currently under preparation and will illustrate the application of this approach to a few real case studies, each consisting of different nanoforms of a substance, to assess whether they could belong to a set of similar nanoforms.
3. Pairwise similarity instead of universal boundaries
Establishing groups based on pre-fixed boundaries for each of the properties (e.g. particle size from 1 to 5 nm, 5 to 10, 10 to 30, and 30 to 100) would necessarily lead to illogical conclusions in which nanoforms objectively similar (few nm difference, but on either side of the pre-fixed boundary) would end up in different sets. Instead, we propose to form sets of nanoforms based on minimum similarity of every pair of nanoforms within that set. For larger sets of potentially similar nanoforms this requires many pairwise assessments, which can be provided by the NanoApp but would be burdensome to be performed manually.
4. Identification of methods for the key properties determining hazard, exposure and risks of nanoforms
Tier 1 similarity assessment is mostly based on the properties that are required for substance identification (Section 2 of REACH Annex VI). Several JRC reports have already identified suitable methods to characterize these properties and provided guidance on the interpretation of results (Rauscher et al., Citation2019; Mech et al. Citation2020a), and we recommend users to endorse these recommendations.
Tier 2 similarity assessment reuses all the intrinsic properties that were evaluated in Tier 1 and assesses them with more flexible boundaries for acceptable dissimilarity thresholds. In addition, it considers additional key functional properties to assess whether the exposure, hazard, and risk assessment of the nanoforms can be performed jointly and therefore they can be justified as part of the same set of similar nanoforms. For each of these functional properties, preferred/acceptable methods are proposed. When available, these are based on standardized test guidelines either from OECD or ISO/CEN standards. In some cases, simplifications of such standardized guidelines are proposed, to rationalize efforts required for the assessment. For several of the properties no standardized methods are available, and in that case, the suggestions are one or several options with wide scientific acceptance. Details on methods and associated descriptors is presented in the following sections.
5. General considerations when setting thresholds for maximal dissimilarity to justify a set of nanoforms
Thresholds for each of the properties are needed to conclude whether two nanoforms are sufficiently similar for such a property. Currently, the body of evidence that can be used to derive such thresholds is limited, and these may need to be revised in the future once additional data becomes available. When establishing such thresholds, we took into consideration:
Existing data on how a property influences hazard, exposure or risk. Acceptable variations should not have relevant impacts on hazard and exposure (e.g. no differences in resulting CLP and no relevant differences in descriptors for risk assessment–DNELs, PNECs, exposure estimates).
Usual distribution of properties (at least size and morphology) within each single NF. Such distribution of values within a single NF imply that when comparing two NFs, there will be an overlapping fraction of ‘constituent particles’ with the same properties in both of the two NFs. In other words, polydispersity of each NF increases the similarity between two NFs. As an example, NanoDefine has found (by electron microscopy, EM) that all tested commercial nanomaterials had a polydispersity around 0.5 and more (polydispersity can be assessed without fitting by the parameter (d90–d10)/d50, or by the full-width-half-max (FWHM/d50) of a fitted lognormal distribution). Hence, the size distributions overlap substantially if two NFs differ in d50 by not more than a factor 1.5 (NanoDefine D7.13, Citation2019; Mech et al. Citation2020b).
Reproducibility/accuracy in the results of experimental methods used to determine NF descriptors, so that the similarity thresholds are not stricter than the intrinsic reproducibility of the methods by which the data will be generated. On the example of size, NanoDefine has observed that the inter-lab reproducibility of EM techniques is within a factor 1.5 (Babick et al.Citation 2016).
Reproducibility of test methods (usually OECD test guidelines) that would be conducted on a NF if this would be excluded from a set of similar NFs. The rationale is that if the expected outcome of testing two NFs by a given testing method differ less than the actual reproducibility of those methods, testing would not be justified, and therefore grouping into a set would be preferable.
In general terms, these considerations were the basis for setting the decision thresholds, and detailed specific considerations for each property are described in the following section.
6. Decision rules for Tier 1 and Tier 2 grouping
This section describes the rationale for the decision rules applied in Tier 1 and Tier 2 grouping. The decision rules and thresholds are also summarized in .
Table 2. Similarity rules considered within Tier 1 and Tier 2.
6.1. Composition
Beyond surface treatment agents, chemical composition does not appear as such in the sections of the Appendix for nanoforms (ECHA Citation2019a). We expect that slight variations in relative content of nanoform constituents, additives and/or impurities may occur, due to interbatch variability, different production sites, or different production processes. Indeed, it is common to report substance composition by providing ranges of values for main constituents or impurities. Therefore, we introduced criteria to evaluate which degree of variation could be acceptable within a single set of nanoforms. Additives, as in REACH, are defined as substances that have been intentionally added to stabilize the substance. Taking into consideration that surface treatment agents are defined as covalently bond to the particles, additives would comprise any other substance intentionally added to stabilize the substance but not covalently bond. Impurities are any non-intentionally added substance present in the final nanoform. We address main particle constituents: i.e. those intended to be part of the particles as such, in a different way than additives (which due to their non-covalent binding may be more labile) and impurities. Criteria for surface treatment agents, will be presented in Section 6.2.
6.1.1. Main particle constituents
It is expected that monoconstituent nanoforms will represent the great majority of registrations. Nevertheless, multiconstituent nanoforms exist, e.g. quantum dots, doped nanoforms, metal organic frameworks and may become more prevalent in the future. Note that in the context of nanoforms, the content of some of the nanoform constituents may be typically lower (e.g. in the case of doping agents) than the usual ranges according to REACH Guidance, which foresees that multiconstituent substances contain constituents at levels ≥ 10% and <80% (w/w).
Tier 1. We considered that a difference below 1.5-fold in the relative content of each individual main constituent between two nanoforms would be acceptable. At the moment, limited data exist to substantiate acceptable variations. But based on the data from studies with nanoforms containing doping agents, 1.5-fold differences would rarely result on detectable differences in effective doses on in vitro studies with mammalian cell lines (Ahamed et al. Citation2017; Das et al. Citation2019; Naatz et al. Citation2017), in vivo rodent studies by the inhalation route (Xia et al. Citation2011; Dekkers et al. Citation2017; Dunnick et al. Citation2016) and on ecotoxicity studies (Xia et al. Citation2011; Naatz et al. Citation2017).
Tier 2. We considered that a difference below 3-fold in the relative content of each individual main constituent between two nanoforms would be acceptable, as long as dissolution, reactivity and toxicity tests would support minor functional consequences of this level of variation (see section 7 for decision criteria related to these properties). Available studies looking at varying levels of doping agents suggest that 3-fold differences would not have a relevant impact on toxicity (references quoted above). But given the limited data available, dissolution, reactivity and toxicity tests are considered necessary for justification.
6.1.2. Impurities and additives
Tier 1. Maximal content of impurities and additives should be below 3% in the two nanoforms under comparison. High amounts of impurities/additives might affect surface properties of the nanoforms. The OECD case study on grouping and read-across for nanomaterials–genotoxicity of nano-TiO2, is a good example for this. In this report (OECD, Citation2018), results of genotoxicity assays for NM101 (uncoated but containing 9% of impurities) suggested that NM101 behaved somewhere in between uncoated and coated TiO2 nanoforms. The 3% threshold was defined as a conservative provisional threshold that should be reevaluated when more data becomes available.
Such generic threshold on maximal content will not apply when the most abundant impurities and additives (those with a relative content above 2% for a nanoform) are identical for the two nanoforms under comparison and the difference in their relative content is below 2-fold between the two nanoforms under comparison. Impurities and additives are considered identical when they share the same CAS Number, except in the case of inorganic impurities, where in alignment to the way they are reported, each elemental constituent is compared.
Tier 2. The maximal content of impurities and additives should be below 10% in the two nanoforms under comparison, and needs to be supported by data for the two nanoforms under comparison on the following functional assays: dissolution, reactivity, in vitro toxicity, and environmental dispersion stability (see Section 7 for decision criteria related to these properties). Such testing would ensure that the presence of differing types (and content) of additives and impurities, which might be present at the surface of the particle, do not affect the properties of the particles.
As for Tier 1, the threshold for maximal content will not apply when the most abundant impurities and additives (those with a relative content above 2% for a nanoform) are identical for the two nanoforms under comparison. In that case, the difference in relative content of these impurities/additives should be below 5-fold between the two nanoforms under comparison, and the functional assays should support their similarity.
6.2. Surface treatment
Surface treatment are usually applied on nanoforms in order to modulate properties such as their dispersibility, reactivity, or dissolution rate. These are properties that are closely related to the fate, toxicokinetics and toxicity of nanoforms.
Note that we did not develop rules to handle sequential surface treatments, as these type of nanoforms are considered a small fraction of those with commercial relevance. Future revisions of the NanoApp will reconsider the need for such considerations.
Tier 1. A set of similar nanoforms should contain either untreated NFs, or NFs with surface treatments that are chemically identical. Within Tier 1 a variation below 1.5-fold in the content of such surface treatments is allowed. We could not identify any study that compared nanoforms that only differed in their relative content of a surface treatment agent. Therefore, this is considered a provisional threshold, and it should be reevaluated when data becomes available.
Tier 2. A set of similar nanoforms should contain either untreated NFs, or NFs with surface treatments that are chemically similar. Thus, in contrast to Tier 1, some degree of chemical variation in the surface treatment agents is accepted under Tier 2.
The reasoning to conclude on such chemical similarity (for the surface treatment agents and for the resulting nanoform surface chemistry) needs to be provided by the user. As suggested by the Appendix for nanoforms (ECHA Citation2019a), it could be based on common functional groups, similar alkyl chains, etc. Chemical similarity indices as commonly used in QSAR models and in software to identify analogues for consideration for read-across (e.g. the OECD QSAR toolbox or the LRI Ambit Tool) could also be used to support chemical similarity of surface treatment agents. Surface treatment agents holding different CLP classification cannot be concluded to be chemically similar. We consider that only inorganic treatments of identical chemistry (i.e. same CAS number) should belong to a set of similar nanoforms. The main applications concern a metal-oxide or metal-sulfide shell around the core material. Therefore, when we refer to similar chemistry it refers to organic treatments.
The user also needs to assess whether differences in particle coverage are expected when comparing each pair of two nanoforms.
Another difference versus Tier 1, is that in Tier 2 a variation below 5-fold in the content of such surface treatments is allowed (both for chemically identical and for chemically similar surface treatments). There is very limited data on the content of surface treatment agents, and we could not identify a single in vivo study that compared two NFs with differing content in the surface treatment agent. Therefore, the factor on acceptable variation in relative content of surface treatments is also considered a provisional threshold, and it should be reevaluated when data becomes available.
The potential impact that variations in content and in the chemical structure of the particle surface need to be evaluated by means of functional assays: dissolution and reactivity are required in all cases, and in vitro toxicity is also required when surface treatments are not chemically identical.
6.3. CLP Classification
CLP classification rules for NFs are not yet developed, and strictly speaking they are ‘substances’ and not ‘mixtures’ under CLP. However, we take the pragmatic choice to look at constituents as if they were components of a mixture. The CLP classification resulting from this, should be the same for all NFs in a ser of similar nanoforms.
6.4. Size
Particle size distribution data is required in number metrics for registration, in particular d10, d50 and d90. For highly narrow size distributions, these parameters are close to each other. The wider the size distribution, the more these will differ among them, and the lower the mass (and also the surface area) contribution of d50 and d10 will be. We thus err on the side of caution, by choosing number metrics instead of surface area metrics for the comparison of nanoforms, and can disregard the tail of the distribution described by D10, since that tail contributes least to surface area dose (and even less to mass dose). Indeed, for nanomaterials with wide size distributions (let’s assume PDI of 1 and more), the mass contribution of d10 particles can easily become lower than 1%. Examples can be found in the NanoDefine case studies that report mass and number metrics (Mehn et al. Citation2018). Even when two nanoforms would differ in their d10, it is highly unlikely that such difference would be reflected in the results of (eco)toxicological studies, as the relative mass and surface area contribution of such fraction would be minimal for both nanoforms. For this reason, we only base the similarity assessment on d50 and d90.
The size of particles is known to affect their toxicokinetics and hazard in a number of ways. First, a decrease in particle size is thought to increase the potential of translocation through biological barriers. Evidence for some, albeit minor, systemic translocation after inhalation, ingestion and dermal exposure exists, and suggests that translocation increases with decreasing particle size (Kreyling et al. Citation2002; Choi et al. Citation2010; Geraets et al. Citation2014; Larese-Filon et al., Citation2015). In addition, in the case of the inhalation route, smaller alveolar deposited particles are cleared less efficiently by lung macrophages compared to particles in the micrometer range, resulting in a longer retention time in the lung (Geiser et al. Citation2008; Braakhuis et al. Citation2014). A reduction in size has also been shown to increase adsorption in the gills or the gastrointestinal tract of fish (e.g. Osborne et al. Citation2015), and increase depuration times in other environmental species (Skjolding et al. Citation2016).
At the same time, size of particles inversely correlates with specific surface area, which in turn implies that the smaller the size, the higher the reactivity and dissolution rate.
Tier 1. We consider that differences below 1.5-fold in size (for both d50 and d90) between two nanoforms would be acceptable. Size descriptors for the smallest dimension and for the largest dimension are compared between the two nanoforms. In the case of spherical particles, descriptors for the largest dimension are assumed to be equal to those of the smallest dimension, unless the user can provide measured data.
This threshold corresponds approximately to the reproducibility of the measurement methods. NanoDefine observed that the inter-lab reproducibililty of EM techniques was within a factor 1.5 (Babick et al. Citation2016). In addition, all commercial nanoforms tested in NanoDefine had a polydispersity around 0.5 or more. This indicates that, for the acceptable variations in d50 and d90, the size distributions of the two nanoforms would overlap substantially (NanoDefine D7.13, Citation2019). Moreover, the existing scientific evidence suggest that larger differences in size are needed to result on a relevant impact on toxicokinetics and toxicity (Kreyling et al. Citation2009; Geraets et al. Citation2012; Gosens et al. Citation2010; Gosens et al., Citation2014; Horie et al. Citation2012; Osborne et al. Citation2015; Seitz et al. Citation2015; Wiemann et al. Citation2018).
Tier 2. Under this Tier, we differentiate between sets that include only nanoforms with d50 values for their smallest dimension above 10 nm, and sets that include nanoforms with d50 values below this threshold. The main reason for this differentiation is the evidence that nanoforms smaller than 10 nm may have a different systemic biodistribution that larger nanoforms. This could lead to the exposure of target tissues, such as kidneys, that would otherwise not be expected to be reached by larger particles (Choi et al. Citation2009; Choi et al. Citation2010). This differentiation by size does not apply to nanoforms that quickly dissolve (which we define as those with dissolution half-time in lung lining fluid shorter than 2 days). The size of such type of nanoforms would quickly evolve in a relevant time period and consequently, concerns about size specific translocation or biodistribution would not apply.
The two nanoforms have d50 values for their smallest dimension equal or above 10 nm or have dissolution half-time values in lung lining fluid lower than 2 days. We consider that differences below 3-fold in size (d50 and d90) between two nanoforms would be acceptable, as long as the results of the following functional assays support similarity of the NFs: dissolution, reactivity, in vitro toxicity, and environmental dispersion stability (see Section 7 for decision criteria related to these properties).
We consider that larger variations in size might for some substances be associated with gradual changes in toxicity. Therefore, we consider that differences below 5-fold in size (d50 and d90) would also be acceptable, if supported by the same functional assays as above and the additional condition that the worst-case nanoform in the set is identified as a conservative representative of the whole set. Such conservative representative should be used for testing to fill in the data requirements in REACH for this set of nanoforms.
One or the two nanoforms under comparison have d50 values for their smallest dimension below 10 nm. In this case, we consider that differences below 3-fold in size (d50 and d90) between two nanoforms would be acceptable, as long as the results of the following functional assays support similarity of the NFs: dissolution, reactivity, in vitro toxicity, and environmental dispersion stability (see section 7 for decision criteria related to these properties), and, as a special condition for this scenario, an in vivo study providing data on toxicokinetics and toxicity (see for decision criteria related to this study). As an alternative to conducting such in vivo study, the user is also offered the choice to select a worst-case nanoform. This would be the nanoform with the smallest size, which as a conservative representative of the whole set would need to be used for testing to fill in the data requirements in REACH.
Table 3. Descriptors and thresholds for justification of similarity between two nanoforms based on the Tier 2 additional assays.
In both scenarios, the nanoform with the smallest size is considered the worst-case nanoform, for the reasons described above, which are in summary: higher concerns on potential translocation through biological barriers, as well as higher reactivity and ion release. A theoretical decrease of systemic exposure due to increased renal elimination (that would only be relevant for nanoforms below the 10 nm threshold) is considered negligible after inhalation exposure (Choi et al. Citation2010).
6.5. Specific surface area
Specific surface area is required for registration. A larger surface area implies that an increased number of atoms will be available at the surface of the particles to interact with their surroundings. It has been shown also experimentally that specific surface area is an important determinant of dissolution and reactivity of nanoforms, and consequently of their hazard profile, toxicokinetics and environmental fate (Duffin et al. Citation2007; Van Hoecke et al. Citation2008; Seitz et al. Citation2014; Schmid and Stoeger Citation2016; Burello Citation2017). For non-porours materials, specific surface area inversely correlates with size, and for this reason thresholds for specific surface area have been aligned to those for size.
Tier 1. In alignment to the threshold for size descriptors, differences below 1.5-fold in SSA between each pair of two nanoforms would be acceptable.
Tier 2. In alignment to the threshold for size descriptors, differences below 3-fold in SSA between each pair of two nanoforms would be acceptable, or differences below 5-fold if a worst-case nanoform is selected to be used in testing for REACH data requirements. Experimental data on functional assays for justification of similarity under Tier 2 is aligned to the tests described above for size.
These rules are likely to be overconservative for porous nanoparticles, in which their level of porosity is likely to be the main determinant of specific surface area. There is some evidence that porosity influences toxicity of nanoparticles, although it is unclear if that is a direct effect or indirectly through a porosity-driven increase in aggregation (Yu et al. Citation2012). With our thresholds, a porous and a non-porous nanoform would never be grouped into the same set, since their differences in specific surface area would be way higher than our thresholds.
6.6. Morphology–shape category, aspect ratio, and assembly structure
6.6.1. Shape category and aspect ratio
Marked differences in shape e.g. spherical versus platelets, and versus high aspect ratio elongated nanoforms, are known to clearly affect toxicokinetics and toxicity of NFs by the inhalation route (Schinwald et al. Citation2012; Porter et al. Citation2013; Ma-Hock et al. Citation2013). Such marked differences relate to aspect ratios differing by a factor more than 100. Evidence on the role of shape on oral and dermal routes of exposure is much more limited. Also, in the case of environmental fate and ecotoxicity, the role of shape does not seem to be as marked as it is for inhalation toxicity (Dai et al. Citation2015; Wray and Klaine Citation2015; Zhang, Xiao, and Fang Citation2018; Melegari et al. Citation2019).
Very few in vivo studies have experimentally investigated the impact of small variations in morphology by relevant routes of exposure, and they did not find relevant effects related to variations in aspect ratio (e.g. Poulsen et al. Citation2016). Considering the magnitude of the toxicological differences observed in the studies with clear morphological differences, small variations in morphology are not expected to have an impact on fate and (eco)toxicity. One exception might be in morphological attributes related to fiber pathogenicity (e.g. Schinwald et al. Citation2012).
The Appendix for nanoforms (ECHA Citation2019a) defines four different shape categories: spheroidal (aspect ratios <3:1), elongated (those with one larger dimension, with aspect ratios ≥3:1), platelets (those with two larger dimensions), and multimodal shapes (those that contain particles belonging to more than one of other shape categories). The Appendix for nanoforms (ECHA Citation2019a) states that nanoforms in a set should belong to the same shape category, unless they are very close to the limits of those categories. That might be the case for spheroidal and elongated nanoforms that have aspect ratios slightly below and slightly above the 3:1 threshold that defines these categories. In order to evaluate similarity, we require data on the aspect ratio for all the nanoforms, even if that is not strictly required for registration of spheroidal nanoforms.
Tier 1. We consider that up differences below 2-fold in aspect ratio (defined as highest/lowest dimension) between two nanoforms would be acceptable. Indirectly this condition translates into sets that only contain nanoforms belonging to the same shape category (as defined in the Appendix for nanoforms; ECHA Citation2019a), except when they are very close to the boundaries of the spheroidal vs. elongated shape categories. Given that the aspect ratio boundaries for the category of platelets have not been clearly defined, and the technical difficulties in evaluating size for the three dimensions of a nanoform, we decided to restrict grouping of platelets with nanoforms of other shape categories. Mixed-shape category nanoforms that contain platelets can only be grouped with other mixed-shape category nanoforms that also contain platelets, when differences in their relative content are below 3-fold. Taking into consideration concerns of fiber toxicity, it is also required that all nanoforms have d90 values for length below 5 µm. This is a conservative approach, since dissolution and/or lack of rigidity would increase similarity in the toxicological profile of such long NFs. But, at the moment, we have not developed rules to support of sets of nanoforms for such long nanoforms.
Tier 2. The same conditions considered in Tier 1 are applied, except that wider differences are allowed for the aspect ratio between two nanoforms (below 5-fold), and for differences in the content of platelets within a mixed shape category nanoform (below 5-fold, and excluding from this condition mixed-shaped nanoforms with a percentage of platelets below 10%). In vitro toxicity tests are required to ensure that such morphological differences to not influence the toxicological profile of the nanoforms under comparison (see Section 7 for decision criteria related to in vitro toxicity studies).
6.6.2. Morphology–assembly structure
Both in Tier 1 and Tier 2, identifying whether a nanoform consists or not of an assembly structure is required, and only nanoforms sharing the same assembly structure can be part of the same set of similar nanoforms. It is assumed that variations in the number of layers within an assembly structure will be captured by size descriptors.
6.7. Morphology–crystal forms
Crystallinity of a nanoform can influence exposure and hazard. Silica (amorphous vs. crystalline) and titania (rutile vs. anatase) nanoforms are the most widely used examples when referring to the role of nanoform crystallinity in toxicity (Park et al. Citation2018). But many more nanoforms of a substance, inorganic and also organic, can be present in different crystalline forms. Sometimes, different crystallinity leads to different CAS Numbers (a scenario that would preclude including them into the same set of nanoforms), but sometimes they share the same CAS Number. There are also nanoforms that may contain more than one crystalline form.
We developed similarity rules addressed mostly to nanoforms containing multiple crystalline structures, which allow grouping when different proportions of such crystalline forms are present in the two nanoforms under comparison. Although our rules, by default, restrict grouping of nanoforms with different crystalline forms of the same substance, there could be cases in which data may exist showing that two specific crystallinities do not impact exposure and hazard of nanoforms of such substance. If the user can provide such type of evidence, those two crystal forms are considered as a single crystal form in relation to the rules described below.
Tier 1. All nanoforms within a set of similar nanoforms should have the same crystalline structure or be all amorphous. For nanoforms consisting of multiple crystalline structures, differences below 1.5-fold in their relative content would be acceptable. This threshold represents the reproducibility of the measurement methods. With this condition, even in the case that only one crystal form would cause toxicity, whereas the other would not, the results of the toxicity testing would be expected to differ by 1.5-fold.
Tier 2. The main difference versus Tier 1 lays on the differences tolerated on the relative content of crystalline forms between two nanoforms: below 4-fold. This threshold requires some overlap in the presence of crystal forms, in order to exclude major impacts on reactivity and dissolution, which needs to be proved experimentally (see Section 7 for decision criteria related to these properties).
Tier 2 testing is also triggered in the following case. For very small organic nanoforms, sometimes it is possible to conclude that they are crystalline, but determining the actual crystalline form is hindered due to broadened diffraction peaks in the XRD analyses. Taken into consideration the uncertainty in the actual crystalline form of nanoforms falling under these circumstances, reactivity and dissolution data is required to conclude on their similarity.
6.8. Aggregation/agglomeration state
The Appendix for nanoforms (ECHA Citation2019a) does not explicitly include the need to consider agglomeration/aggregation state of nanoforms. However, we consider that, at least aggregation, is relevant in relation to exposure and toxicokinetics and, consequently, to hazard (Landsiedel et al. Citation2012; Bruinink, Wang, and Wick Citation2015), and in fact the ECHA Guidance on read-across for nanoforms specifies the need to consider agglomeration/aggregation state (ECHA Citation2019b).
Agglomeration and deagglomeration are important processes that are known to occur during environmental fate of nanoforms. They will determine water dispersion stability and consequently likelihood of exposure for different environmental compartments. They partly depend on the initial agglomeration state of the nanoform, but very strongly also on extrinsic factors, such as the composition of the environmental media (Abdolahpur Monikh et al. Citation2018). Besides determining the site of initial deposition along the respiratory tract (Pauluhn, Citation2009), the actual impact of agglomeration on toxicokinetics and hazard is still under debate, due to the lack of understanding on the level of agglomeration/deagglomeration that can occur once an organism is exposed to nanoforms. Some studies comparing toxicity of TiO2 NPs at different agglomeration states exist, but the agglomerated sizes they compared were rather similar and impact on toxicity either undetectable or minor (Gosens et al. Citation2010; Noël et al. Citation2012; Noël et al. Citation2013; Murugadoss et al. Citation2020).
Particle aggregates (sintered) are not expected to disaggregate, unless they dissolve. Partial dissolution may also lead to the formation of aggregates, as shown by some recent studies with silica (Keller et al., in preparation). However, for the great majority of nanoforms, it can be assumed that aggregation will limit the capacity of nanoforms to interact and translocate through biological barriers and will condition mechanisms of cell internalization.
The aggregate size is not typically listed in technical data sheets of industrial materials, with the exception of Carbon Black, of which the different grades are sometimes specified by aggregate size due to technical relevance (Mark, Erman, and Roland Citation2013). For this specific substance, methods are standardized by ISO Citation15825:2017 ‘Rubber compounding ingredients—Carbon black—Determination of aggregate size distribution by disc centrifuge photosedimentometry,’ and there have been attempts to generalize the method (Retamal Marín, Babick, and Stintz Citation2017).
At the moment, there are no widely applicable methods to evaluate size of nanoform aggregates/agglomerates. The NanoDefine method manual considers the dispersibility in selecting methods, but all recommended methods only evaluate the constituent particles, not the aggregates or agglomerates (Mech et al. Citation2020c). For this reason, as an alternative, the user is prompted to consider whether the overall production processes compared on each pair of two nanoforms may lead to different aggregation/agglomeration state, such as unbound versus aggregated particles. For example, the Stoeber process leading to colloidal silica without aggregates is different from a pyrolytic process leading to fumed silica with substantial aggregates.
Tier 1. Only nanoforms with no expected differences in their aggregation/agglomeration state due to their respective production processes can be within the same set of similar nanoforms.
Tier 2. In cases where different production processes are considered to potentially lead to different aggregation/agglomeration states, data needs to be provided to justify similarity of these nanoforms. Such data consists of environmental dispersion stability and dustiness (see section 7 for decision criteria related to these properties).
7. Thresholds for functional assays triggered by Tier 2
This section describes methods, descriptors and rationale for the decision rules that lead to the conclusion on whether the results of functional assays justify similarity of each pair of two nanoforms ().
7.1. Dissolution
Dissolution is a clear determinant of fate (in the environment and in the organisms) and (eco)toxicity, particularly for nanoforms that release toxic ions or molecules (Misra et al. Citation2012; Braakhuis et al. Citation2014; Hund-Rinke et al. Citation2018; Kühnel et al. Citation2019). Variations in most of the properties of a nanoform can be associated to differences in dissolution (Misra et al. Citation2012). For this reason, dissolution is required for justification under Tier 2 for the majority of the intrinsic properties we included. Dissolution strongly depends on the test media, not only due to differences in pH, but also ionic strength, redox potential, and presence of complexing agents. For these reasons, two different media are requested for the assessment: one physiological media and one environmental media. Our suggested choice is simulated lysosomal fluid as physiological media, and synthetic freshwater as environmental media. In line with the discussion on the use of environmental freshwater compositions for grouping purposes (Abdolahpur Monikh et al. Citation2018), we require the same medium to be used in comparing nanoforms, and specifically recommend the intermediate water quality (with NOM, 1 mM Ca, pH7) out of the range tested in OECD TG318. This should align well with the upcoming OECD guidance on environmental dissolution rate and dispersion stability (OECD Citation2020).
Dissolution rate is a parameter that can span orders of magnitude (Wohlleben et al. Citation2019). We consider that dissolution half-times of two nanoforms that differ below a factor of 3 are sufficiently similar. Theoretically, these differences in dissolution could lead to differences in toxicity thresholds up to such value. Some experimental data exists that confirms this relation, but generally in short-term studies and quickly dissolving nanoforms (e.g. Braakhuis et al. Citation2016, assuming that specific surface area correlated with dissolution). This impact on toxicity is expected to decrease with increasing exposure duration periods, where, assuming that particles are not cleared from the organism prior to full dissolution, actual ion release of nanoforms (for a given substance) with different dissolution half-times would gradually approximate to the same value.
In practice, potential differences in toxicity up to 3-fold are narrower than the usual width of categories used for CLP classification (usually 5 to 10-fold), they are below the reported inter-study variability for repeated dose toxicity studies (around 5 to 10-fold for oral studies) derived from relatively large datasets on classical substances (Friedmann Citation2019). Although the datasets are much more limited for nanomaterials, they suggest that inter-study variability may even exceed that recorded for classical substances (Scoville et al. Citation2015; Drew et al. Citation2017). The threshold is also in the order or below most uncertainty factors used in the risk assessment process.
In some scenarios we accept differences in dissolution below 5-fold, but these are always linked to the use of a worst-case material as conservative estimate for testing to fill in data requirements in REACH.
For very poorly soluble nanoforms, mechanism other than dissolution drive lung clearance (ECETOC-TR122, Citation2013). In such cases, differences in dissolution half-times become irrelevant in terms of lung clearance. As a conservative threshold, and to minimize also any concern on differences due to release of toxic ions, we consider that when two nanoforms have dissolution half-times above 1 year, they can be considered similar in terms of dissolution.
7.2. Reactivity
Surface reactivity of nanomaterials, particularly for relatively low solubility materials, is also a key determinant of hazard (Duffin et al. Citation2007). As for dissolution, variations in most of the properties of a nanoform can be associated to differences in reactivity, and this is why it is also frequently required for justification under Tier 2. Reactivity has been recommended by ECHA for grouping and read-across of nanoforms (ECHA Citation2019b), and was considered as distinguishing parameter both for environmental hazard grouping and human hazard grouping (Hund-Rinke et al. Citation2018; Bahl et al. Citation2020).
There exist multiple assays that have been proposed to evaluate reactivity of nanoforms, and not all the assays are suitable for all nanoforms due to potential interferences with the detection principle. We recommend the use of one of the following assays: DCFH, EPR or FRAS, because SOPs are available for these assays (ISO 18827:2017; Gandon et al. Citation2017; Hellack et al. Citation2017; Bahl et al. Citation2020), and some of them have undergone interlaboratory round robin tests already (DCFH in the H2020 project Gracious; Boyles et al., in preparation).
The dynamic range of surface reactivity outcomes depend on the assay used in the evaluation. EPR and DCFH have relatively narrow dynamic ranges. In these cases, reactivity values that differ less than 10% (expressed relative to the positive control in the assay) are considered sufficiently similar. Stricter thresholds would approach the reproducibility of the assays. For FRAS, the dynamic range of the assay is much wider (up to four orders of magnitude; Wohlleben et al. Citation2019) and this threshold would not be sufficiently restrictive. In this case, we require that reactivity values are within a factor of 5-fold for the two nanoforms under comparison.
7.3. In vitro toxicity
Dissolution and reactivity of a nanoform contribute to its toxicity. Yet there are more factors affecting cell toxicity and induction of inflammation. For this reason, two in vitro toxicity studies (one with macrophages and another with another mammalian cell line) are required. Such in vitro studies address key events of (putative) AOP that inform on biological similarity, which is relevant to the in vivo outcome.
Demonstrating correlations between in vitro and in vivo data is challenging due to several toxicokinetic and toxicodynamic factors (Landsiedel et al. Citation2014; Sauer et al., Citation2014; Drasler et al. Citation2017). Other studies could not directly and fully quantitatively correlate in vitro and in vivo effects, but showed that in vitro toxicity tests can be used to identify differences across nanoforms that are reflected into different in vivo toxicity. The LOAEC of an in vitro toxicity study with macrophages evaluating lactate dehydrogenase, glucuronidase, tumor necrosis factor alpha, and released H2O2 correctly predicted assignment of nanoforms into broad groups of passive or active nanomaterials based on the NOAECs from in vivo STIS studies (Wiemann et al. Citation2016, Citation2018). Correlations of outcomes of in vitro toxicity studies in macrophages and in other cell lines (e.g. A549, 6HBE) and in vivo inflammation after inhalation exposure have also been reported by other research groups (e.g. Rushton et al. Citation2010; Han et al. Citation2012; Kim et al. Citation2014; Braakhuis et al. Citation2016; NANoREG D5.5, Citation2017; Kolling et al. Citation2020).
We are comparing NFs of the same composition that are similar–within boundaries–in shape, surface and size (if differences were large, we would not allow for Tier 2). It is hence reasonable to assume that these NFs share the same mechanism/initial interactions (MIE analogues), and that in vitro studies could identify differences in potency that could eventually translate into different in vivo toxicity.
Reproducibility of in vitro studies is around ± 50% for conventional substances (e.g. Fautrel et al. Citation1991). The datasets for nanoforms, although scarce, also suggest variabilities around or above these values (Xia et al. Citation2013; Piret et al. Citation2017; Elliott et al. Citation2017). Yet, interlaboratory variability improves with standardized assay protocols (Xia et al. Citation2013), as well as dispersion protocols (Hartmann et al. Citation2015) and particle dosimetry consideration (Weldon et al. Citation2018; Wiemann et al. Citation2018; Teeguarden et al. Citation2007, Hinderliter et al. Citation2010). The use of Benchmark Dose Response (BMD) instead of a LOAEC provides a more robust point of departure (Weldon et al. Citation2018). Good In Vitro Method Practices (GIVIMP; OECD, Citation2018) and defined standards for regulatory testing under Good Laboratory Practice (GLP) further improve reproducibility.
The inter-laboratory reproducibility of the macrophage assay has not yet been established in a validation study. Nevertheless, a pre-validation study funded by the German ZEBET is available (Wiemann Frede, and Albrecht Citation2013). The ISO standard for in vitro cytotoxicity using the MTS assay (ISO Citation19007:2018) or other well-proven methods (i.a., Kroll et al. Citation2011) are recommended to evaluate cytotoxicity in the second cell line, provided that no interferences of the tested materials with the read-out of the assay occurs (Wohlleben et al. Citation2011; Kroll et al. Citation2012; Mitjans et al. Citation2018).
As in other functional assays, the same test protocol (including nanoform dispersion) shall be used to generate data for the multiple nanoforms under comparison.
Two nanoforms should yield in similar results within a factor of 3-fold–in both of the two in vitro toxicity assays. This factor reflects the usual test concentration spacing and the reproducibility of cytotoxicity assays. The threshold is also consistent with the thresholds we have established for other related functional assays, such as dissolution.
7.4. Environmental dispersion stability
Environmental dispersion stability is mostly used in our assessment as a surrogate of aggregation/agglomeration level. Aggregation/agglomeration, in addition to strongly influencing dispersion stability, might also impact toxicokinetics and consequently on toxicity.
The choice of the test media is a major determinant of dispersion stability, and for this reason we suggest that the study is performed with media that would a priori lead to higher dispersion stability (Abdolahpur Monikh et al. Citation2018). In line with the discussion on the use of environmental freshwater compositions for grouping purposes (Abdolahpur Monikh et al. Citation2018), we require the same medium to be used in comparing nanoforms, and specifically recommend the intermediate water quality (with NOM, 1 mM Ca, pH7) out of the range tested in OECD TG318. This aligns well with the recently published OECD guidance on environmental dissolution rate and dispersion stability (OECD Citation2020).
We aligned the threshold for similarity in environmental dispersion stability to the spacing of categories used in the OECD TG 318, which has cutoffs a 10%, 50%, and 90% to define low/intermediate low/intermediate high/high stability. Thus, when the difference in the percentage of material in suspension for two nanoforms is within a range of 40%, these are considered sufficiently similar. Note also that environmental factors (NOM and water hardness) are much stronger determinants of dispersion stability than NF properties as such (Abdolahpur Monikh et al. Citation2018). Our main intention with this assay in our framework is to clearly differentiate between nanoforms that are highly aggregated/agglomerated, from those that are not.
7.5. Dustiness
Dustiness is an established determinant of exposure, widely used in exposure modeling (Cherrie et al. Citation2020), and considered as input in several risk assessment tools (Nymark et al. Citation2020). Dustiness is a mandatory data requirement by REACH (Annex VII) for substances produced or imported above 1 ton per year. In our assessment, it is used as a surrogate of aggregation/agglomeration level. Therefore, differences in dustiness are also indicative of potential differences in toxicokinetics.
The threshold that we defined is 5-fold in the ratio of dustiness descriptors for the two nanoforms. This value is consistent with the width of the narrower dustiness categories proposed by the EN 15051, which includes 4 categories with ranges that cover factors of 5- to 10-fold. It also reflects the level of variation on dustiness that the relative humidity (at usual workplace conditions) and physical load during storage introduces for the majority of nanoforms (Levin et al. Citation2015). Although it should be noted that such level of variation can be much higher for some nanoforms, as the case of TiO2, where a change in humidity from 30 to 50% led to over 400-fold difference in the measured respirable dustiness index (Levin et al. Citation2015).
We do not restrict the type of method used to evaluate dustiness, since also the EN standard offers four valid methods (EN1719917199, Citation2019). However, the method must be the same for the two nanoforms under comparison, as the aerosolization process has a strong influence on the measured dustiness (Ding et al. Citation2015).
8. Thresholds for in vivo testing
Currently, there are no in vitro assays available to reliably assess potential differences in systemic uptake and distribution of particles. Hence, as described in section 6.3, a pre-selection of a worst-case nanoform as representative for regulatory testing (i.e. to fill in REACH data requirements) may be required under some circumstances (when nanoforms are below 10 nm and not rapidly dissolved). As an alternative to restricting the nanoform to be used in further testing, an in vivo study may be used to justify similarity of nanoforms that differ in their primary particle size (depicted in as ‘tier 3’). Once in vitro assays reliably predicting systemic uptake and distribution of particles become available, they could replace the in vivo study in the context of justifying sets of nanoforms (and would be integrated in tier 2). The goal of this in vivo study is mainly to address the concern on potential toxicokinetic differences (beyond gradual qualitative changes, such as differences in target organs) after inhalation exposure when particle sizes are very low. We are not aware of similar evidence for key differences in fate/bioaccumulation/toxicity for NFs related to relatively narrow variations in a NF property (always considering NFs of the same substance) for oral and dermal relevant hazards and for environmental health hazards that would request such type of Tier 3 testing. For all these cases, we consider that Tier 2 testing sufficiently justifies similarity for the purpose of defining a set of similar NFs.
A short-term inhalation toxicity study with evaluation of lung clearance, and translocation to secondary organs (in addition to toxicity evaluations) is currently the option to reveal toxicokinetic differences. An OECD test guideline on toxicokinetics of NFs is currently under development, although at a rather early stage. As there is no other appropriate OECD test guideline available for such study, we suggest the use of STIS, which has already been used for a decade (Ma-Hock, Burkhardt, et al. Citation2009,) for numerous nanomaterials by various research groups (Ma-Hock et al. Citation2014; Landsiedel et al. Citation2014; Gosens et al. Citation2016; Kim et al. Citation2018). The STIS is currently not a regulatory requirement, but it could markedly reduce animal testing in supporting grouping into sets of similar nanoforms, and regardless of the outcome of grouping, it serves as a dose-range finder which is required in a toxicological testing program for repeated -dose inhalation regulatory studies (Wiench and Ma-Hock Citation2019).
In order to conclude that two nanoforms are similar enough to belong to the same set, the LOAECs or BMDs should differ less than 3-fold (or 5-fold if the worst-case nanoform is selected for further regulatory testing) (). These values reflect usual dose-spacing of in vivo studies and are in line with the level of variability observed in regulatory in vivo studies (already discussed in Section 7.1). Note that the LOAECs of materials that have been tested in STIS span across three orders of magnitude, ranging from <0.1 to >50 mg/m3 (Ma-Hock, Burkhardt, et al. Citation2009; Landsiedel et al. Citation2014).
Table 4. Descriptors and thresholds for justification of similarity between two nanoforms based on the Tier 3 in vivo study.
The organ burden for at least lung, spleen, liver, kidney and blood should not exceed 3-fold differences between the two nanoforms under comparison. The threshold reflects the limited precision of organ burden measurements (few time-points, individual intra-experimental and inter-experimental variability, limited analytical precision). This comparison is not required for organs with a burden representing less than 1% of the total body burden, because analytical challenges for an accurate determination increase at such low levels, increasing variability in organ burdens and hindering their comparability. Moreover, it is unlikely that this low relative organ burden would cause the most relevant target organ toxicity compared to those organs bearing the major burdens.
It is also required that the lung clearance half-times of the two nanoforms under comparison differ less than a factor of 2-fold. Note that this comparison should be done at lung burdens that do not induce lung toxicity, as this usually reduces lung clearance. A factor of 2-fold reflects the limited precision of half-time measurements (few time points, individual, intra-experimental and inter-experimental variability, limited analytical precision) (Tentschert et al. Citation2020).
9. Conclusions
Several frameworks on grouping of nanoforms existed already. Some of these were purely conceptual (Oomen et al. Citation2015; Sellers et al. Citation2015). Others followed statistical approaches (clustering or regression analyses) to group nanomaterials (Drew et al. Citation2017; Knudsen et al., Citation2019) but, considering the limited available datasets, such approaches are of unclear relevance beyond the range of properties of the materials used in the studies. Others developed specific grouping rules, as in DF4nano (Arts et al. Citation2015) or Nanogravur (Hund-Rinke et al. Citation2018; Wohlleben et al. Citation2019), but these rules were based on fixed boundaries and pre-defined categories. In addition, most of these frameworks had not been developed for nanoforms of a single substance, but for much broader groups of nanoforms.
All these existing frameworks, together with the ECHA Guidance documents have been taken into consideration during the development of the ECETOC NanoApp. But we took a step forward by proposing rules to systematically evaluate similarity in the context of generating sets of similar nanoforms. These rules were based on pairwise similarity to overcome the limitations of pre-defined categories. The rules were defined taking into consideration current evidence on the role of different intrinsic and extrinsic properties on exposure, toxicokinetics, fate, and (eco)toxicity, and ultimately on risks to environment and humans. Current datasets do not allow a comprehensive validation of the rules that we developed, for several reasons: (i) nanoforms have rarely been characterized with all descriptors required by the NanoApp, (ii) a low number of (comparable) in vivo studies for human health endpoints exist for variants of nanoforms for a same substance, (iii) ongoing discussions on adequacy of standard ecotoxicological tests (designed to test soluble substances) for nanoforms. The legal requirement to register nanoforms will considerably increase these datasets and will allow the future reassessment of the thresholds that we have proposed.
Overall, the systematic rules that are presented here and incorporated in the NanoApp will help REACH registrants and dossier evaluators during the process of registering sets of similar nanoforms. This framework may as well be useful as a low tier in the consideration of read-across for nanoforms. The application of the NanoApp to real case studies, including silica NFs of different sizes, ceria NFs from different production processes, and other nanoforms, will be described in detail in a follow-up manuscript currently in preparation.
TNAN-2020-OR-0223-File002.docx
Download MS Word (14.1 KB)Disclosure statement
Robert Landsiedel and Wendel Wohlleben are employees of a company producing and marketing nanomaterials.
Additional information
Funding
References
- Abdolahpur Monikh, F., M. A. Praetorius, A. Schmid, P. Kozin, B. Meisterjahn, E. Makarov, T. Hofmann, and F. Von der Kammer. 2018. “Scientific Rationale for the Development of an OECD Test Guideline on Engineered Nanomaterial Stability.” NanoImpact 11: 42–50. doi:10.1016/j.impact.2018.01.003.
- Abschlussbericht des ZEBET Projektes „Prävalidierungsstudie zur Prüfung der toxischen Wirkung von schwer löslichen, lungengängigen Stäuben mit demVektorenmodell. “Förderkennzeichen: 0315483A, 0315483B und 0315483C, Berichtszeitraum: 1.5.2009–31.12.2012.
- Ahamed, M., M. A. M. Khan, M. J. Akhtar, H. A. Alhadlaq, and A. Alshamsan. 2017. “ Ag-doping regulates the cytotoxicity of TiO2 nanoparticles via oxidative stress in human cancer cells.” Scientific Reports 7 (1): 17662. doi:10.1038/s41598-017-17559-9.
- Arts, Josje H. E., Mackenzie Hadi, Muhammad-Adeel Irfan, Athena M. Keene, Reinhard Kreiling, Delina Lyon, Monika Maier, et al. 2015. “A Decision-Making Framework for the Grouping and Testing of Nanomaterials (DF4nanoGrouping).” Regulatory Toxicology and Pharmacology : RTP 71 (2 Suppl): S1–S27. doi:10.1016/j.yrtph.2015.03.007.
- Babick, F., J. Mielke, W. Wohlleben, S. Weigel, and V. D. Hodoroaba. 2016. “How Reliably Can a Material Be Classified as a Nanomaterial? Available Particle-Sizing Techniques at Work.” J Nanopart Res 18: 158. doi:10.1007/s11051-016-3461-7.
- Bahl, Aileen, Bryan Hellack, Martin Wiemann, Anna Giusti, Kai Werle, Andrea Haase, Wendel Wohlleben, et al. 2020. “Nanomaterial Categorization by Surface Reactivity: A Case Study Comparing 35 Materials with Four Different Test Methods.” NanoImpact 19: 100234.
- Braakhuis, H. M., M. V. D. Z. Park, I. Gosens, W. H. De Jong, and F. R. Cassee. 2014. “Physicochemical Characteristics of Nanomaterials That Affect Pulmonary Inflammation.” Particle and Fibre Toxicology 11 (1): 18.
- Braakhuis, Hedwig M., Christina Giannakou, Willie J. G. M. Peijnenburg, Jolanda Vermeulen, Henk van Loveren, and Margriet V. D. Z. Park. 2016. “Simple in Vitro Models Can Predict Pulmonary Toxicity of Silver Nanoparticles.” Nanotoxicology 10 (6): 770–779. doi:10.3109/17435390.2015.1127443.
- Bruinink, A., J. Wang, and P. Wick. 2015. “Effect of Particle Agglomeration in Nanotoxicology.” Archives of Toxicology 89 (5): 659–675. doi:10.1007/s00204-015-1460-6.
- Burello, E. 2017. “A Mechanistic Model for Predicting Lung Inflammogenicity of Oxide Nanoparticles.” Toxicological Sciences: An Official Journal of the Society of Toxicology 159 (2): 339–353. doi:10.1093/toxsci/kfx136.
- Cherrie, J. W., W. Fransman, G. A. H. Heussen, D. Koppisch, and K. A. Jensen. 2020. “Exposure Models for REACH and Occupational Safety and Health Regulations.” International Journal of Environmental Research and Public Health 17 (2): 383.
- Choi, Hak Soo., Yoshitomo Ashitate, Jeong Heon Lee, Soon Hee Kim, Aya Matsui, Numpon Insin, Moungi G. Bawendi, et al. 2010. “Rapid Translocation of Nanoparticles from the Lung Airspaces to the Body.” Nature Biotechnology 28 (12): 1300–1303.
- Choi, H. S., B. I. Ipe, P. Misra, J. H. Lee, M. G. Bawendi, and J. V. Frangioni. 2009. “Tissue- and Organ-Selective Biodistribution of NIR Fluorescent Quantum Dots.” Nano Letters 9 (6): 2354–2359. doi:10.1021/nl900872r.
- Dai, L., G. T. Banta, H. Selck, and V. E. Forbes. 2015. “Influence of Copper Oxide Nanoparticle Form and Shape on Toxicity and Bioaccumulation in the Deposit Feeder, Capitella Teleta.” Marine Environmental Research 111: 99–106. doi:10.1016/j.marenvres.2015.06.010.
- Das, B. K., S. K. Verma, T. Das, P. K. Panda, K. Parashar, M. Suar, and S. K. S. Parashar. 2019. “Altered Electrical Properties with Controlled Copper Doping in ZnO Nanoparticles Infers Their Cytotoxicity in Macrophages by ROS Induction and Apoptosis.” Chemico-Biological Interactions 297: 141–154. doi:10.1016/j.cbi.2018.11.004.
- Dekkers, S., M. R. Miller, R. P. F. Schins, I. Römer, M. Russ, R. J. Vandebriel, I. Lynch, et al. 2017. “The Effect of Zirconium Doping of Cerium Dioxide Nanoparticles on Pulmonary and Cardiovascular Toxicity and Biodistribution in Mice after Inhalation.” Nanotoxicology 11 (6): 794–808. doi:10.1080/17435390.2017.1357214.
- Ding, Yaobo, Burkhard Stahlmecke, Araceli Sánchez Jiménez, Ilse L. Tuinman, Heinz Kaminski, Thomas A. J. Kuhlbusch, Martie van Tongeren, et al. 2015. “Dustiness and Deagglomeration Testing: Interlaboratory Comparison of Systems for Nanoparticle Powders.” Aerosol Science and Technology. 49 (12): 1222–1231.
- Drasler, B., P. Sayre, K. G. Steinhäuser, A. Petri-Fink, and B. Rothen-Rutishauser. 2017. “In Vitro Approaches to Assess the Hazard of Nanomaterials.” NanoImpact 8: 99–116. doi:10.1016/j.impact.2017.08.002.
- Drew, N. M., E. D. Kuempel, Y. Pei, and F. Yang. 2017. “A Quantitative Framework to Group Nanoscale and Microscale Particles by Hazard Potency to Derive Occupational Exposure Limits: Proof of Concept Evaluation.” Regulatory Toxicology and Pharmacology89: 253–267. doi:10.1016/j.yrtph.2017.08.003.
- Duffin, R., L. Tran, D. Brown, V. Stone, and K. Donaldson. 2007. “Proinflammogenic Effects of Low-Toxicity and Metal Nanoparticles In Vivo and In Vitro: Highlighting the Role of Particle Surface Area and Surface Reactivity.” Inhalation Toxicology 19 (10): 849–856. doi:10.1080/08958370701479323.
- Dunnick, K. M., A. M. Morris, M. A. Badding, M. Barger, A. B. Stefaniak, E. M. Sabolsky, and S. S. Leonard. 2016. “Evaluation of the Effect of Valence State on Cerium Oxide Nanoparticle Toxicity following Intratracheal Instillation in Rats.” Nanotoxicology 10 (7): 992–1000. doi:10.3109/17435390.2016.1157220.
- ECETOC-TR122. 2013. Poorly Soluble Particles/Lung Overload. Technical Report No. 122. 2013.
- ECHA. 2019a. Appendix for Nanoforms Applicable to the Guidance on Registration and Substance Identification.
- ECHA. 2019b. Appendix R.6-1 for Nanoforms Applicable to the Guidance on QSARs and Grouping of Chemicals.
- Elliott, J. T., M. Rösslein, N. W. Song, B. Toman, A. Kinsner-Ovaskainen, R. Maniratanachote, M. L. Salit, et al. 2017. “Toward Achieving Harmonization in a Nano-Cytotoxicity Assay Measurement through an Interlaboratory Comparison Study.” ALTEX 34 (2): 201–218. doi:10.14573/altex.1605021.
- EN17199. 2019. “Workplace exposure—Measurement of dustiness of bulk materials that contain or release respirable NOAA or other respirable particles”.
- EUoN. 2020. NanoApp helps navigate legal obligations under REACH. Accessed 27 October 2020. https://euon.echa.europa.eu/de/nanopinion/-/blogs/nanoapp-helps-navigate-legal-obligations-under-reach.
- Fautrel, A., C. Chesné, A. Guillouzo, G. de Sousa, M. Placidi, R. Rahmani, F. Braut, et al. 1991. “A Multicentre Study of Acute In Vitro Cytotoxicity in Rat Liver Cells.” Toxicol Vitr 5 (5–6): 543–547.
- Friedmann. 2019. Accessed 27 October 2020. https://www.epa.gov/sites/production/files/2020-01/documents/4_508_katie_paulfriedman_nams_2019.pdf).
- Gandon, A., Werle, K., Neubauer N., and Wohlleben W. Surface Reactivity Measurements as Required for Grouping and Read-across: An Advanced FRAS Protocol. In: Journal of Physics: Conference Series 2017. IOP Publishing: 012033. doi:10.1088/1742-6596/838/1/012033.
- Geiser, M., M. Casaulta, B. Kupferschmid, H. Schulz, M. Semmler-Behnke, and W. Kreyling. 2008. “The Role of Macrophages in the Clearance of Inhaled Ultrafine Titanium Dioxide Particles.” American Journal of Respiratory Cell and Molecular Biology 38 (3): 371–376. doi:10.1165/rcmb.2007-0138OC.
- Geraets, L., A. G. Oomen, J. D. Schroeter, V. A. Coleman, and F. R. Cassee. 2012. “Tissue Distribution of Inhaled Micro- and Nano-Sized Cerium Oxide Particles in Rats: Results from a 28-Day Exposure Study.” Toxicological Sciences 127 (2): 463–473.
- Geraets, Liesbeth, Agnes G. Oomen, Petra Krystek, Nicklas R. Jacobsen, Håkan Wallin, Michel Laurentie, Henny W. Verharen, et al. 2014. “Tissue Distribution and Elimination after Oral and Intravenous Administration of Different Titanium Dioxide Nanoparticles in Rats.” Particle and Fibre Toxicology 11: 30. doi:10.1186/1743-8977-11-30.
- Gosens, Ilse, Flemming R. Cassee, Michela Zanella, Laura Manodori, Andrea Brunelli, Anna Luisa Costa, Bas G. H. Bokkers, et al. 2016. “Organ Burden and Pulmonary Toxicity of Nano-sized Copper (II) Oxide Particles after Short-term Inhalation Exposure.” Nanotoxicology 10 (8): 1084–1095. doi:10.3109/17435390.2016.1172678.
- Gosens, Ilse, Jan Andries Post, Liset J. J. de la Fonteyne, Eugene H. J. M. Jansen, John W. Geus, Flemming R. Cassee, Wim H. de Jong, et al. 2010. “Impact of Agglomeration State of Nano- and Submicron Sized Gold Particles on Pulmonary Inflammation.” Particle and Fibre Toxicology 7 (1): 37. doi:10.1186/1743-8977-7-37.
- Gosens, I., L. E. Mathijssen, B. G. Bokkers, H. Muijser, and F. R. Cassee. 2014. “Comparative Hazard Identification of Nano- and micro-sized cerium oxide particles based on 28-day inhalation studies in rats.” Nanotoxicology 8 (6): 643–653. doi:10.3109/17435390.2013.815814.
- Han, Xianglu, Nancy Corson, Pamela Wade-Mercer, Robert Gelein, Jingkun Jiang, Manoranjan Sahu, Pratim Biswas, et al. 2012. “Assessing the Relevance of In Vitro Studies in Nanotoxicology by Examining Correlations between In Vitro and In Vivo Data.” Toxicology 297 (1–3): 1–9. doi:10.1016/j.tox.2012.03.006.
- Hartmann, N. B., K. A. Jensen, A. Baun, K. Rasmussen, H. Rauscher, R. Tantra, D. Cupi, D. Gilliland, F. Pianella, and J. M. Riego Sintes. 2015. “Techniques and Protocols for Dispersing Nanoparticle Powders in Aqueous Media-Is There a Rationale for Harmonization?” Journal of Toxicology and Environmental Health. Part B, Critical Reviews 18 (6): 299–326. doi:10.1080/10937404.2015.1074969.
- Hellack, Bryan, Carmen Nickel, Catrin Albrecht, Thomas A. J. Kuhlbusch, Sonja Boland, Armelle Baeza-Squiban, Wendel Wohlleben, et al. 2017. “Analytical Methods to Assess the Oxidative Potential of Nanoparticles: A Review.” Environmental Science 4 (10): 1920–1934.
- Hinderliter, Paul M., Kevin R. Minard, Galya Orr, William B. Chrisler, Brian D. Thrall, Joel G. Pounds, Justin G. Teeguarden, et al. 2010. “ISDD: A Computational Model of Particle Sedimentation, Diffusion and Target Cell Dosimetry for in Vitro Toxicity Studies.” Particle and Fibre Toxicology 7 (1): 36. doi:10.1186/1743-8977-7-36.
- Horie, Masanori, Katsuhide Fujita, Haruhisa Kato, Shigehisa Endoh, Keiko Nishio, Lilian Kaede Komaba, Ayako Nakamura, et al. 2012. “Association of the Physical and Chemical Properties and the Cytotoxicity of Metal Oxide Nanoparticles: Metal Ion Release, Adsorption Ability and Specific Surface area.” Metallomics: Integrated Biometal Science 4 (4): 350–360. doi:10.1039/c2mt20016c.
- Hund-Rinke, K., K. Schlich, D. Kühnel, B. Hellack, H. Kaminski, and C. Nickel. 2018. “Grouping Concept for Metal and metal oxide Nanomaterials with Regard to Their Ecotoxicological Effects on Algae, Daphnids and Fish Embryos.” NanoImpact 9: 52–60. doi:10.1016/j.impact.2017.10.003.
- ISO 18827:2017. “Nanotechnologies—Electron spin resonance (ESR) as a method for measuring reactive oxygen species (ROS) generated by metal oxide nanomaterials.”
- ISO 19007:2018. "Nanotechnologies — In Vitro MTS Assay for Measuring the Cytotoxic Effect of Nanoparticles." https://www.iso.org/standard/63698.html.
- Kim, Y. H., E. Boykin, T. Stevens, K. Lavrich, and M. I. Gilmour. 2014. “Comparative Lung Toxicity of Engineered Nanomaterials Utilizing In Vitro, Ex Vivo and In Vivo Approaches.” Journal of Nanobiotechnology 12 (1): 12–47.
- Kim, Young Hun., Mi Seong Jo, Jin Kwon Kim, Jae Hoon Shin, Jin Ee Baek, Hye Seon Park, Hyo Jin An, et al. 2018. “Short-Term Inhalation Study of Graphene Oxide Nanoplates.” Nanotoxicology 12 (3): 224–238. doi:10.1080/17435390.2018.1431318.
- Knudsen, K. B., T. Berthing, P. Jackson, S. S. Poulsen, A. Mortensen, N. R. Jacobsen, V. Skaug, et al. 2019. “Physicochemical Predictors of Multi-Walled Carbon Nanotube-induced pulmonary histopathology and toxicity one year after pulmonary deposition of 11 different Multi-Walled Carbon Nanotubes in mice .” Basic & Clinical Pharmacology & Toxicology 124 (2): 211–227. doi:10.1111/bcpt.13119.
- Kolling, J., J. Tigges, B. Hellack, C. Albrecht, and R. P. F. Schins. 2020. “Evaluation of the NLRP3 Inflammasome Activating Effects of a Large Panel of TiO2 Nanomaterials in Macrophages.” Nanomaterials 10 (9): 1876.
- Kreyling, W. G., M. Semmler, F. Erbe, P. Mayer, S. Takenaka, H. Schulz, G. Oberdörster, et al. 2002. “Translocation of Ultrafine Insoluble Iridium Particles from Lung Epithelium to Extrapulmonary Organs is Size Dependent but Very Low.” J Toxicol Environ Health A 65 (20): 1513–1530.
- Kreyling, Wolfgang G., Manuela Semmler-Behnke, Jürgen Seitz, Wilfried Scymczak, Alexander Wenk, Paula Mayer, Shinji Takenaka, et al. 2009. “Size Dependence of the Translocation of Inhaled Iridium and Carbon Nanoparticle Aggregates Fürom the Lung of Rats to the Blood and Secondary Target Organs.” Inhal Toxicol 21 (sup1): 55–60.
- Kroll, Alexandra, Christian Dierker, Christina Rommel, Daniela Hahn, Wendel Wohlleben, Christian Schulze-Isfort, Christian Göbbert, et al. 2011. “Cytotoxicity Screening of 23 Engineered Nanomaterials Using a Test Matrix of Ten Cell Lines and Three Different Assays.” Particle and Fibre Toxicology 8: 9. doi:10.1186/1743-8977-8-9.
- Kroll, A., M. H. Pillukat, D. Hahn, and J. Schnekenburger. 2012. “Interference of Engineered Nanoparticles with In Vitro Toxicity assays.” Archives of Toxicology 86 (7): 1123–1136. doi:10.1007/s00204-012-0837-z.
- Kühnel, Dana, Carmen Nickel, Bryan Hellack, Esther van der Zalm, Carola Kussatz, Monika Herrchen, Boris Meisterjahn, et al. 2019. “Closing Gaps for Environmental Risk Screening of Engineered Nanomaterials.” NanoImpact 15: 100173.
- Landsiedel, Robert, Eric Fabian, Lan Ma-Hock, Ben van Ravenzwaay, Wendel Wohlleben, Karin Wiench, Franz Oesch, et al. 2012. “Toxico-/Biokinetics of Nanomaterials.” Archives of Toxicology 86 (7): 1021–1060. doi:10.1007/s00204-012-0858-7.
- Landsiedel, Robert, Lan Ma-Hock, Thomas Hofmann, Martin Wiemann, Volker Strauss, Silke Treumann, Wendel Wohlleben, et al. 2014. “Application of Short-Term Inhalation Studies to Assess the Inhalation Toxicity of Nanomaterials.” Particle and Fibre Toxicology 11: 16. doi:10.1186/1743-8977-11-16.
- Larese-Filon, F.,. M. Mauro, G. Adami, M. Bovenzi, and M. Crosera. 2015. “Nanoparticles Skin Absorption: New Aspects for a Safety Profile evaluation.” Regul Toxicol Pharmacol 72 (2): 310–322. doi:10.1016/j.yrtph.2015.05.005.
- Levin, M., E. Rojas, E. Vanhala, et al. 2015. “Influence of Relative Humidity and Physical Load during Storage on Dustiness of Inorganic Nanomaterials: Implications for Testing and Risk Assessment.” J Nanoparticle Res 17 (8): 1–13.
- Ma-Hock, Lan, Silke Burkhardt, Volker Strauss, Armin O. Gamer, Karin Wiench, Bennard van Ravenzwaay, Robert Landsiedel, et al. 2009. “Development of a Short-Term Inhalation Test in the Rat Using Nano-Titanium Dioxide as a Model Substance.” Inhalation Toxicology 21 (2): 102–118. doi:10.1080/08958370802361057.
- Ma-Hock, L., T. Hofmann, R. Landsiedel, and B. van Ravenzwaay. 2014. “A Short-Term Inhalation Study Protocol: Designed for Testing of Toxicity and Fate of Nanomaterials.” Methods in Molecular Biology 1199: 207–212. doi:10.1007/978-1-4939-1280-3_16.
- Ma-Hock, Lan, Volker Strauss, Silke Treumann, Karin Küttler, Wendel Wohlleben, Thomas Hofmann, Sibylle Gröters, et al. 2013. “Comparative Inhalation Toxicity of Multi-Wall Carbon Nanotubes, Graphene, Graphite Nanoplatelets and Low Surface Carbon Black.” Particle and Fibre Toxicology 10: 23. doi:10.1186/1743-8977-10-23.
- Ma-Hock, Lan, Silke Treumann, Volker Strauss, Sandra Brill, Frederic Luizi, Michael Mertler, Karin Wiench, et al. 2009. “Inhalation Toxicity of Multiwall Carbon Nanotubes in Rats Exposed for 3 months.” Toxicological Sciences 112 (2): 468–481. doi:10.1093/toxsci/kfp146.
- Mark, J. E., B. Erman, and M. Roland. 2013. The Science and Technology of Rubber. New York: Academic press.
- Mech, A., H. Rauscher, K. Rasmussen, F. Babick, V.-D. Hodoroaba, A. Ghanem, W. Wohlleben, H. Marvin, R. Brüngel, and C. M. Friedrich. 2020a. The NanoDefine Methods Manual – Part 2: Evaluation of Methods. The NanoDefine Methods Manual. Luxembourg: Publications Office of the European Union. JRC117501, 1–133.
- Mech, A., Rauscher, H., Babick F., Hodoroaba V., Ghanem A., Wohlleben, W., Marvin H, et al. 2020c. The NanoDefine Methods Manual, EUR 29876 EN, Publications Office of the European Union, Luxembourg. ISBN 978-92-76-12335-4 (online),978-92-76-12336-1 (print), doi:10.2760/79490.(online),10.2760/58586 (print), JRC117501.
- Mech, A., W. Wohlleben, A. Ghanem, V. D. Hodoroaba, S. Weigel, F. Babick, R. Brüngel, ChM. Friedrich, K. Rasmussen, and H. Rauscher. 2020b. “Nano or Not Nano? A Structured Approach for Identifying Nanomaterials according to the European Commission’s Definition.” Small 16 (36): 2002228.
- Mehn, Dora, Iria Maria Rio-Echevarria, Douglas Gilliland, Michael Kaiser, Klaus Vilsmeier, Peter Schuck, Wendel Wohlleben, et al. 2018. “Identification of Nanomaterials: A Validation Report of Two Laboratories Using Analytical Ultracentrifugation with Fixed and Ramped Speed Options.” NanoImpact 10: 87–96.
- Melegari, S. P., C. F. Fuzinatto, R. A. Gonçalves, B. V. Oscar, D. S. Vicentini, and W. G. Matias. 2019. “Can the Surface Modification and/or Morphology Affect the Ecotoxicity of Zinc Oxide Nanomaterials?” Chemosphere 224: 237–246. doi:10.1016/j.chemosphere.2019.02.093.
- Misra, S. K., A. Dybowska, D. Berhanu, S. N. Luoma, and E. Valsami-Jones. 2012. “The Complexity of Nanoparticle Dissolution and Its Importance in Nanotoxicological Studies.” The Science of the Total Environment 438: 225–232. doi:10.1016/j.scitotenv.2012.08.066.
- Mitjans, M.,. D. R. Nogueira-Librelotto, M. P. Vinardell, D. R. Nogueira-Librelotto, and M. P. Vinardell. 2018. “Nanotoxicity In Vitro: Limitations of the Main Cytotoxicity Assays.” In Nanotoxicology: Toxicity Evaluation, Risk Assessment and Management, edited by V. Kumar, N. Dasgupta, S. Ranjan, 171–192. CRC Press.
- Murugadoss, Sivakumar, Sybille van den Brule, Frederic Brassinne, Noham Sebaihi, Jorge Mejia, Stéphane Lucas, Jasmine Petry, et al. 2020. “Is Aggregated Synthetic Amorphous Silica Toxicologically Relevant?” Particle and Fibre Toxicology 17 (1): 1. doi:10.1186/s12989-019-0331-3.
- Naatz, H., S. Lin, R. Li, W. Jiang, Z. Ji, C. H. Chang, J. Köser, et al. 2017. “Safe-by-Design CuO Nanoparticles via Fe-Doping, Cu-O Bond Length Variation, and Biological Assessment in Cells and Zebrafish Embryos.” ACS Nano 11 (1): 501–515. doi:10.1021/acsnano.6b06495.
- NanoDefine Technical Report D7.13. 2019. Report on Case Studies, Publicly. Accessed 27 October 2020. http://www.nanodefine.eu/publications/reports/NanoDefine_TechnicalReport_D7.13.pdf
- NANoREG D5.5. 2017. Report on cell type and in vitro-in vivo correlation studies for inhalation toxicity. Accessed 27 October 2020. https://www.rivm.nl/en/documenten/nanoreg-d5-05-dr-report-on-cell-type-and-in-vitro-in-vivo-correlation-studies-for.
- Noël, A., M. Charbonneau, Y. Cloutier, R. Tardif, and G. Truchon. 2013. “Rat Pulmonary Responses to Inhaled nano-TiO2: Effect of Primary Particle Size and Agglomeration State.” Particle and Fibre Toxicology 10 (1): 48.
- Noël, A., K. Maghni, Y. Cloutier, C. Dion, K. J. Wilkinson, S. Hallé, R. Tardif, et al. 2012. “Effects of Inhaled nano-TiO2 Aerosols Showing Two Distinct Agglomeration States on Rat Lungs.” Toxicology Letters. 214 (2): 109–119.
- Nymark, Penny, Martine Bakker, Susan Dekkers, Remy Franken, Wouter Fransman, Amaia García‐Bilbao, Dario Greco, et al. 2020. “Toward Rigorous Materials Production: New Approach Methodologies Have Extensive Potential to Improve Current Safety Assessment Practices.” Small 16 (6): 1904749.
- OECD. 2018. Guidance Document on Good In Vitro Method Practices (GIVIMP), OECD Series on Testing and Assessment, No. 286, OECD Publishing, Paris.
- OECD. 2020. Guidance document for the testing of dissolution and dispersion stability of nanomaterials and the use of the data for further environmental testing and assessment strategies. Series on Testing and Assessment No. 318.
- OECD. 2018. Case study on grouping and read-across for nanomaterials ─ genotoxicity of nano-TiO2 Series on Testing and Assessment No. 292. (292). Accessed 27 October 2020. http://www.oecd.org/officialdocuments/publicdisplaydocumentpdf/?cote=ENV/JM/MONO(2018)28&docLanguage=En.
- Oomen, A. G., E. A. Bleeker, P. M. Bos, F. Van Broekhuizen, S. Gottardo, M. Groenewold, D. Hristozov, et al. 2015. “Grouping and Read-Across Approaches for Risk Assessment of Nanomaterials.” International Journal of Environmental Research and Public Health 12 (10): 13415–13434. doi:10.3390/ijerph121013415.
- Osborne, Olivia J., Sijie Lin, Chong Hyun Chang, Zhaoxia Ji, Xuechen Yu, Xiang Wang, Shuo Lin, et al. 2015. “Organ-Specific and Size-Dependent Ag Nanoparticle Toxicity in Gills and Intestines of Adult Zebrafish.” ACS Nano 9 (10): 9573–9584. doi:10.1021/acsnano.5b04583.
- Park, Margriet Vdz., Julia Catalán, Natalia Ferraz, Joan Cabellos, Ralph Vanhauten, Socorro Vázquez-Campos, Gemma Janer, et al. 2018. “Development of a Systematic Method to Assess Similarity between Nanomaterials for Human Hazard Evaluation Purposes – Lessons learnt.” Nanotoxicology 12 (7): 652–676. doi:10.1080/17435390.2018.1465142.
- Pauluhn, J. 2009. “Comparative Pulmonary Response to Inhaled Nanostructures: Considerations on Test Design and Endpoints.” Inhalation Toxicology 21 (sup1): 40–54. doi:10.1080/08958370902962291.
- Porter, Dale W., Nianqiang Wu, Ann F. Hubbs, Robert R. Mercer, Kathleen Funk, Fanke Meng, Jiangtian Li, et al. 2013. “Differential Mouse Pulmonary Dose and Time Course Responses to Titanium Dioxide Nanospheres and Nanobelts.” Toxicological Sciences 131 (1): 179–193.
- Poulsen, Sarah S., Petra Jackson, Kirsten Kling, Kristina B. Knudsen, Vidar Skaug, Zdenka O. Kyjovska, Birthe L. Thomsen, et al. 2016. “Multi-Walled Carbon Nanotube Physicochemical Properties Predict Pulmonary Inflammation and Genotoxicity.” Nanotoxicology 10 (9): 1263–1275. doi:10.1080/17435390.2016.1202351.
- Piret, J. P., O. M. Bondarenko, M. S. P. Boyles, M. Himly, A. R. Ribeiro, F. Benetti, C. Smal, et al. 2017. “Pan-European Inter-Laboratory Studies on a Panel of in Vitro Cytotoxicity and Pro-Inflammation Assays for Nanoparticles.” Archives of Toxicology 91 (6): 2315–2330. doi:10.1007/s00204-016-1897-2.
- Rauscher H., A. Mech, P. Gibson, D. Gilliland, A. Held, V. Kestens, R. Koeber, T. Linsinger, and E. Stefaniak. 2019. Identification of nanomaterials through measurements, EUR 29942 EN, Publications Office of the European Union, Luxembourg, 2019. ISBN 978-92-76-10371-4.
- Retamal Marín, R. R., F. Babick, and M. Stintz. 2017. “Ultrasonic Dispersion of Nanostructured Materials with Probe Sonication − Practical Aspects of Sample Preparation.” Powder Technology 318: 451–458.
- Rushton, Erik K., Jingkun Jiang, Stephen S. Leonard, Shirley Eberly, Vincent Castranova, Pratim Biswas, Alison Elder, et al. 2010. “Concept of Assessing Nanoparticle Hazards considering Nanoparticle Dosemetric and Chemical/Biological Response Metrics.” Journal of Toxicology and Environmental Health. Part A 73 (5): 445–461. doi:10.1080/15287390903489422.
- Sauer, U. G., S. Vogel, A. Aumann, A. Hess, S. N. Kolle, L. Ma-Hock, W. Wohlleben, et al. 2014. “Applicability of Rat Precision-Cut Lung Slices in Evaluating Nanomaterial Cytotoxicity, Apoptosis, Oxidative Stress, and Inflammation.” Toxicology and Applied Pharmacology 276 (1): 1–20.
- Schinwald, Anja, Fiona A. Murphy, Adriele Prina-Mello, Craig A. Poland, Fiona Byrne, Dania Movia, James R. Glass, et al. 2012. “The Threshold Length for Fiber-Induced Acute Pleural Inflammation: Shedding Light on the Early Events in Asbestos-Induced Mesothelioma.” Toxicological Sciences: An Official Journal of the Society of Toxicology 128 (2): 461–470. doi:10.1093/toxsci/kfs171.
- Schmid, O., and T. Stoeger. 2016. “Surface Area is the Biologically Most Effective Dose Metric for Acute Nanoparticle Toxicity in the Lung.” Journal of Aerosol Science. 99: 133–143.
- Scoville, David K., Collin C. White, Dianne Botta, Lisa A. McConnachie, Megan E. Zadworny, Stefanie C. Schmuck, Xiaoge Hu, et al. 2015. “Susceptibility to Quantum Dot Induced Lung Inflammation Differs Widely among the Collaborative Cross Founder Mouse Strains.” Toxicology and Applied Pharmacology 289 (2): 240–250. doi:10.1016/j.taap.2015.09.019.
- Seitz, F., R. R. Rosenfeldt, S. Schneider, R. Schulz, and M. Bundschuh. 2014. “Size-, Surface- and Crystalline Structure Composition-Related Effects of Titanium Dioxide Nanoparticles during Their Aquatic Life Cycle.” The Science of the Total Environment 493: 891–897. doi:10.1016/j.scitotenv.2014.06.092.
- Seitz, Frank, Ricki R. Rosenfeldt, Katharina Storm, George Metreveli, Gabriele E. Schaumann, Ralf Schulz, Mirco Bundschuh, et al. 2015. “Effects of Silver Nanoparticle Properties, Media pH and Dissolved Organic Matter on Toxicity to Daphnia Magna.” Ecotoxicology and Environment Safety. 111: 263–270.
- Sellers, K., N. M. E. Deleebeeck, M. Messiean, M. Jackson, E. A. J. Bleeker, D. T. H. M. Sijm, and F. A. van Broekhuizen. 2015. “Grouping Nanomaterials: A Strategy towards Grouping and Read-Across.” In RIVM Report 2015-0061. Bilthoven, The Netherlands: National Institute of Public Health and the Environment (RIVM).
- Skjolding, L. M., S. N. Sørensen, N. B. Hartmann, R. Hjorth, S. F. Hansen, and A. Baun. 2016. “Aquatic Ecotoxicity Testing of Nanoparticles-The Quest To Disclose Nanoparticle Effects.” Angewandte Chemie (International ed. in English) 55 (49): 15224–15239. doi:10.1002/anie.201604964.
- Teeguarden, J. G., P. M. Hinderliter, G. Orr, B. D. Thrall, and J. G. Pounds. 2007. “Particokinetics In Vitro: Dosimetry Considerations for In Vitro Nanoparticle Toxicity Assessments.” Toxicological Sciences: An Official Journal of the Society of Toxicology 95 (2): 300–312. doi:10.1093/toxsci/kfl165.
- Tentschert, Jutta, Peter Laux, Harald Jungnickel, Josephine Brunner, Irina Estrela-Lopis, Carolin Merker, Jan Meijer, et al. 2020. “Organ Burden of Inhaled Nanoceria in a 2-Year Low-Dose Exposure Study: Dump or Depot?” Nanotoxicology 14 (4): 554–576. doi:10.1080/17435390.2020.1736355.
- Van Hoecke, K., K. A. C. De Schamphelaere, P. Van Der Meeren, S. Lucas, and C. R. Janssen. 2008. “Ecotoxicity of Silica Nanoparticles to the Green Alga Pseudokirchneriella subcapitata: Importance of Surface Area.” Environmental Toxicology and Chemistry 27 (9): 1948–1957. doi:10.1897/07-634.1.
- Weldon, B. A., W. C. Griffith, T. Workman, D. K. Scoville, T. J. Kavanagh, and E. M. Faustman. 2018. “In Vitro to In Vivo Benchmark Dose Comparisons to Inform Risk Assessment of Quantum Dot Nanomaterials.” Wiley Interdisciplinary Reviews. Nanomedicine and Nanobiotechnology 10 (4): e1507. doi:10.1002/wnan.1507.
- Wiemann, M, S. Frede, C. Albrecht. 2013. ZEBET Projektes “Prävalidierungsstudie zur Prüfung der toxischen Wirkung von schwer löslichen, lungengängigen Stäuben mit demVektorenmodell”. Förderkennzeichen: 0315483A, 0315483B und 0315483C, Berichtszeitraum: 1.5.2009–31.12.2012.
- Wiemann, Martin, Antje Vennemann, Ursula G. Sauer, Karin Wiench, Lan Ma-Hock, and Robert Landsiedel. 2016. “An In Vitro Alveolar Macrophage Assay for Predicting the Short-Term Inhalation Toxicity of Nanomaterials.” Journal of Nanobiotechnology 14.1 (1): 16.
- Wiemann, Martin, Ursula Sauer, Antje Vennemann, Sandra Bäcker, Johannes-Georg Keller, Lan Ma-Hock, Wendel Wohlleben, et al. 2018. “In Vitro and In Vivo Short-Term Pulmonary Toxicity of Differently Sized Colloidal Amorphous SiO2.” Nanomaterials 8 (3): 160.
- Wiench, K., and L. Ma-Hock. 2019. “The Short-Term Inhalation Study (STIS) as a Range Finder and Screening Tool in a Tiered Grouping Strategy.” In: In Vivo Inhalation Toxicity Screening Methods for Manufactured Nanomaterials. Current Topics in Environmental Health and Preventive Medicine, edited by T. Takebayashi, R. Landsiedel, M. Gamo.Singapore: Springer.
- Wohlleben, Wendel, Bryan Hellack, Carmen Nickel, Monika Herrchen, Kerstin Hund-Rinke, Katja Kettler, Christian Riebeling, et al. 2019. “The nanoGRAVUR Framework to Group (nano)materials for their occupational, consumer, environmental risks based on a harmonized set of material properties, applied to 34 case studies.” Nanoscale 11 (38): 17637–17654. doi:10.1039/c9nr03306h.
- Wohlleben, W.,. S. N. Kolle, L. C. Hasenkamp, A. Böser, S. Vogel, B. Vacano, B. van Ravenzwaay, and R. Landsiedel. 2011. “Artifacts by Marker Enzyme Adsorption on Nanomaterials in Cytotoxicity Assays with Tissue Cultures.” Journal of Physics: Conference Series 304 (1): 012061.
- Wray, A. T., and S. J. Klaine. 2015. “Modeling the Influence of Physicochemical Properties on Gold Nanoparticle Uptake and Elimination by Daphnia Magna.” Environmental Toxicology and Chemistry 34 (4): 860–872. doi:10.1002/etc.2881.
- Xia, Tian, Raymond F. Hamilton, James C. Bonner, Edward D. Crandall, Alison Elder, Farnoosh Fazlollahi, Teri A. Girtsman, et al. 2013. “Interlaboratory Evaluation of In Vitro Cytotoxicity and Inflammatory Responses to Engineered Nanomaterials: The NIEHS Nano Go Consortium.” Environmental Health Perspectives 121 (6): 683–690. doi:10.1289/ehp.1306561.
- Xia, Tian, Yan Zhao, Tina Sager, Saji George, Suman Pokhrel, Ning Li, David Schoenfeld, et al. 2011. “Decreased Dissolution of ZnO by Iron Doping Yields Nanoparticles with Reduced Toxicity in the Rodent Lung and Zebrafish Embryos.” ACS Nano 5 (2): 1223–1235. doi:10.1021/nn1028482.
- Yu, Tian, Khaled Greish, Lawrence D. McGill, Abhijit Ray, and Hamidreza Ghandehari. 2012. “Influence of Geometry, Porosity, and Surface Characteristics of Silica Nanoparticles on Acute Toxicity : Their Vasculature Effect and.” ACS na 6 (3): 2289–2301.
- Zhang, W., B. Xiao, and T. Fang. 2018. “Chemical Transformation of Silver Nanoparticles in Aquatic Environments: Mechanism, Morphology and Toxicity.” Chemosphere 191 (7): 324–334. doi:10.1016/j.chemosphere.2017.10.016.