
Abstract
The in vitro and in vivo toxicity of copper oxide nanoparticles (CuO NPs) is attributed to both particle and dissolved copper ion species. However, a clear understanding of (1) the specific cellular responses that are modulated by the two species and (2) the temporal dynamics in toxicity, as the proportional amount of particulate and ionic forms change over time, is lacking. In the current study, in vitro responses to microparticulate CuO (CuO MPs), CuO NPs, and dissolved Cu2+ were characterized in order to elucidate particle and ion-induced kinetic effects. Particle dissolution experiments were carried out in a relevant cell culture medium, using CuO NPs and MPs. Mouse lung epithelial cells were exposed for 2–48 h with 1–25 µg/mL CuO MPs, CuO NPs, or 7 and 54 µg/mL CuCl2. Cellular viability and genome-wide transcriptional responses were assessed. Dose and time-dependent cytotoxicity were observed in CuO NP exposed cells, which was delayed and subtle in CuCl2 and not observed in CuO MPs treated cells. Analyses of differentially expressed genes and associated pathway perturbations showed that dissolved ions released by CuO NPs in the extracellular medium are insufficient to account for the observed potency and cytotoxicity. Further organization of gene expression results in an Adverse Outcome Pathway (AOP) framework revealed a series of key events potentially involved in CuO NPs toxicity. The AOP is applicable to toxicity induced by metal oxide nanoparticles of varying solubility, and thus, can facilitate the development of in vitro alternative strategies to screen their toxicity.
Introduction
Metal and metal oxide nanomaterials (NM/NMs) are one of the largest classes of NMs listed in the Nanomaterial Consumer Products Inventory, making up 37% of listed entries in 2014 (Vance et al. Citation2015). Copper oxide (CuO) nanoparticles (NPs) are soluble metal oxide nanoparticles (MONPs) that have been utilized in many industries globally for their unique electrical and biocidal properties (Gawande et al. Citation2016; Grigore et al. Citation2016).
Owing to its large production rates and wide-spread utilization, the potential for accidental exposure through inhalation in an occupational setting during its manipulation and handling is high (Hristozov et al. Citation2018). Human exposure to CuO NPs can also occur through industrial processes that involve the evaporation of metals (Tossavainen Citation1976). A wealth of toxicological information exists, which shows that CuO NPs are a particularly potent type of MONP that cause pulmonary toxicity in both in vitro (Semisch et al. Citation2014; Akhtar et al. Citation2016; Titma et al. Citation2016; Strauch et al. Citation2017) and in vivo experimental models (Cho et al. Citation2012; Costa et al. Citation2018; Gosens et al. Citation2016; Lai et al. Citation2018).
Pronounced cytotoxicity, genotoxicity, and oxidative stress due to reactive oxygen species (ROS) formation (Akhtar et al. Citation2016; Semisch et al. Citation2014; Strauch et al. Citation2017; Titma et al. Citation2016) are the commonly observed toxic effects in vitro. In vivo, pulmonary toxicity (in rats, nose-only inhalation) following exposure to CuO NPs is observed and is characterized by transient alveolitis, bronchiolitis, and epithelial vacuolization (Gosens et al. Citation2016) and upregulation of cell survival and, proliferation and inflammation pathways (Costa et al. Citation2018). However, in vivo, changes associated with oxidative stress pathways are not always observed (Costa et al. Citation2018). In another study, intranasal instillation of CuO NPs in C57BL/6 mice was shown to induce pronounced pulmonary inflammation and oxidative stress, which progressed to fibrosis 28 days post-exposure (Lai et al. Citation2018). A study by Cho et al. compared the pulmonary inflammogenic potential of 15 MONPs types in rats exposed via intratracheal instillations and showed that CuO NPs were among the most potent recruiters of granulocytes to the bronchoalveolar lavage fluid, inciting an acute inflammatory response 24 h post-exposure (Cho et al. Citation2012). Thus, as compared to other MONPs, CuO NPs are particularly potent.
In vitro mechanistic research has shown that CuO NPs exert their effects through a ‘Trojan Horse’ mechanism, whereby particles are internalized by cells and trafficked to lysosomes for degradation (Moschini et al., Citation2013; Wongrakpanich et al. Citation2016; Strauch, Hubele, and Hartwig Citation2020). The acidic microenvironment of lysosomes, where CuO NPs get sequestered, is conducive to rapid particle dissolution (Cho et al. Citation2012; Semisch et al. Citation2014), resulting in dramatic increases in intracellular copper ion levels. These copper ions can produce ROS through interaction with bio-molecules, while CuO NPs can produce ROS via particle surface interactions (Angelé-Martínez et al. Citation2017). The particle overload and/or the oxidative stress damages the lysosomal membrane, leading to permeabilization and leakage of contents into the cytoplasm (Zhang et al. Citation2018). The increase in oxidative stress overwhelms the antioxidant defenses of the cell and causes lipid, protein, and nucleic acid damage. Although the toxicity mechanisms of CuO NPs are fairly well understood, a clear knowledge of the proportional contribution of nanoparticulate and ionic forms to the observed toxicity remains a subject for debate (Strauch et al. Citation2017; Jeong et al. Citation2018). CuO NP dissolution experiments in cell culture media have shown that CuO NPs dissolve at a much faster rate than an equal-mass dose of copper oxide microparticles (CuO MP), due to their increased surface area, which allows for enhanced interaction with the surrounding aqueous microenvironment (Midander et al. Citation2009; Semisch et al. Citation2014). A holistic understanding of how dissolution affects the toxic responses of soluble metal oxide particles over time will inform the current mechanistic understanding of MONP induced toxicity and provide experimental evidence to support the read-across approaches associated with regulatory decision making.
Transcriptomic changes have been shown to be sensitive indicators of response, which can help delineate differences in underlying property-specific toxicity mechanisms and exposure conditions (Poulsen et al., Citation2013; Decan et al. Citation2016; Labib et al. Citation2016; Halappanavar et al. Citation2015, Citation2019). Therefore, the primary objective of the present study was to apply global transcriptomic analysis to determine the temporal transition of cellular toxicity and the relative influence of dissolution and particle size fraction on response. In specific, the transcriptional responses, over time, of immortalized mouse lung epithelial cells (FE1) exposed to CuO NPs, CuO MPs, as well as dissolved Cu2+ in the form of CuCl2 for 2–48 h were characterized. Genome-wide transcriptional profiles were generated and were compared between the various exposure conditions and timepoints to specifically delineate particle size and particle vs ion mediated effects. The results were used to establish a putative adverse outcome pathway (AOP) for in vitro cytotoxicity, which is applicable to a diverse group of MONPs.
Methods
Materials
CuO NPs with a manufacturer reported an average primary particle size of 28 nm (Lot number: MKAA0633), cell culture pure copper (II) dihydrate (CuCl2·2H2O referred to as ‘CuCl2’ in this paper), and cell culture pure sodium chloride (NaCl) were procured from Sigma-Aldrich Inc. (Darmstadt, Germany). CuO MPs with a manufacturer reported average primary particle size of 5 µm were obtained from US Research Nanomaterials Inc. (Houston, TX, USA).
Cell culture
Immortalized FE1 cells derived from the Muta™Mouse transgenic rodent model were used for particle and ion exposures. This cell line, which shares characteristics of type I and II alveolar epithelial cells, has been extensively used for mechanistic genotoxicity and toxicogenomic response analysis of a variety of NMs including carbon black, carbon nanotubes, and others (White et al. Citation2003; Jacobsen et al. Citation2011; Poulsen et al., Citation2013; Decan et al. Citation2016). In addition, since metal oxides are known to induce oxidative stress and DNA damage if deemed necessary, FE1 cells will allow a detailed analysis of the mutagenic potential of CuO NPs, and thus, were chosen in the study.
Cells were cultured as described in Decan et al. (Citation2016), in Dulbecco’s Modified Eagle’s Medium Nutrient Mixture F-12HAM (DMEM F12HAM) supplemented with 2% fetal bovine serum (FBS), 1 ng/mL epidermal growth factor (EGF), 100 U/mL penicillin G, and 100 µg/mL streptomycin and maintained at 37 °C, with 5% CO2.
Preparation of particle suspension
Both CuO NPs and CuO MPs were prepared at stock concentrations of 5 mg/mL in ultrapure, cell culture grade H2O. The suspensions were sonicated using protocols optimized in Avramescu et al. (Citation2019). For sonication procedures, a Branson Ultrasonics Sonifier™ SFX550 and a ½ in horn probe with extension and the removable flat tip was used, with delivered sonication energy of 24 J/mL. The stocks were further diluted in cell culture media with the serum to 1 mg/mL and, subsequently, to 1, 5, 10, 25, 50, and 100 µg/mL exposure dilutions.
Particle characterization
A JEM-2100F Field Emission transmission electron microscope (TEM) (JEOL, USA) was used to capture 7 non-overlapping transmission electron micrographs of dry CuO NPs and a JSM-7500F Field Emission scanning electron microscope (SEM) (JEOL, USA) was used to capture 5 non-overlapping scanning electron micrographs of dry CuO MPs used in this study, for the primary particle size measurement. All electron microscopy images were imported into ImageJ for particle size analysis. From the TEM images of the CuO NPs, the length and width of 9–20 individual particles per image were analyzed for a total of 105 particles. From the SEM images of the CuO MPs, the length and width of 10 well-isolated particles were analyzed per image for a total of 50 particles. The size distributions were plotted in histogram format using SigmaPlot12 (Systak Software Inc., UK), and the mean length and width were reported with standard deviation.
Particle characterization for CuO NP suspensions was carried out using dynamic light scattering (DLS). The stocks of CuO NPs suspended in ultrapure H2O (5 mg/mL) and in cell culture media (1 mg/mL) were diluted to 50 µg/mL in the corresponding medium, and aliquots were analyzed by DLS using a Zetasizer Nano ZSP (Malvern Panalytical, Westborough, MA, USA). For each analysis, the mean hydrodynamic diameter (aggregate size in nm), and the zeta potential (a measure of the surface charge of the particles) were determined. Each measurement was conducted in triplicate for the calculation of mean and standard deviation.
Dose finding study
A dose-range finding study was carried out to determine the right exposure concentrations for gene expression analysis. Lactate dehydrogenase (LDH) assay was used to assess cytotoxicity.
FE1 cells were exposed for 2, 24 and 48 h to 1, 5, 10, 25, 50, and 100 µg/mL CuO NPs. Only CuO NPs were used for dose range finding. Cells treated with 10% lysis buffer were used as an assay control for cytotoxicity and media only treated cells served as negative controls. A fresh passage of FE1 cells was plated at a density of 30 000 cells/well in 96 well plates and allowed to acclimatize overnight. Subsequently, media was swapped for exposure media containing CuO NPs, 10% lysis buffer, or blank cell culture media. Cytotoxicity was assessed using the LDH Assay Kit (ab65393) from Abcam Inc. (Toronto, Canada) according to the manufacturer’s instructions. All results were expressed as a percent of response observed in the vehicle only treated cells.
It was observed that the copper ions interfere with LDH reagents and thus, the rest of the cytotoxicity experiments were conducted using Trypan Blue dye exclusion staining. This method of measuring cell viability is reliable with respect to CuO NPs exposure (Karlsson et al. Citation2008).
Particle dissolution experiments
Dissolution experiments using CuO NPs and CuO MPs were conducted using a protocol adapted from Organization for Economic Co-operation and Development (Citation1995) as described by Avramescu et al. (Citation2020). CuO NPs were suspended in ultrapure water, sonicated as previously described, and diluted to 10 or 100 µg/mL in culture media. The high concentration of 100 μg/mL conforms to the Organization for Economic Co-operation and Development guideline for water solubility experiments, which recommends the inclusion of 100 mg/L (100 μg/mL) concentration or higher for solubility testing (Organization for Economic Co-operation and Development Citation1995). The 10 μg/mL concentration was selected based on the results of the dose-range finding experiments for the toxicity testing, at which an appreciable level of viability loss is observed. Nanoparticle suspensions were incubated in 50 mL polypropylene conical tubes at 37 °C for 0, 2, 24, and 48 h on an orbital shaker (MaxQ4000, Thermo Scientific, Canada) with 1 h shaking per day at 100 rpm (Organization for Economic Co-operation and Development Citation1995; Semisch et al. Citation2014). At the designated time intervals, samples were withdrawn and used to measure the dissolved metal fraction after particle separation using centrifugation. Before separation, aliquots were sampled at each time interval, for particle characterization using DLS. The centrifugal separation was conducted sequentially, at 20 000 g (2 × 30 min) using an Allegra 64 R centrifuge (Beckman Coulter, Canada) using optimized protocols from Avramescu et al. (Citation2019). In between centrifugations, the top part of the supernatant was carefully transferred into a new tube by pipette to avoid particle re-suspension. The absence of particles from the supernatant was confirmed via DLS. At each time point, particle size measurements of the blank medium that had been centrifuged showed a hydrodynamic diameter (Dh) of 12.1–12.4 nm, which was similar to those of the centrifugation filtrate containing dissolved Cu (Dh = 12.4–15.8 nm), as reported previously (Avramescu et al. Citation2020). This confirmed lack of particles in the filtrate of dissolved Cu. The final extracts were acidified to a concentration of 2.5% HNO3 and the dissolved metal concentration was measured using inductively coupled plasma optical emission spectroscopy (ICP-OES). Blanks and spiked matrix blanks (containing 0.5 ppb to 1 ppm Cu) were incubated alongside the CuO NP and CuO MP derived samples. Dissolution was calculated as the percent of metal dissolved.
Spectroscopic measurements were conducted using a 5100 Synchronous Vertical Dual View (SVDV) ICP-OES (Agilent Technologies, Canada) at a wavelength of 327.395 nm as recommended by the manufacturer. The machine was operated at 1.2 kW power, 12 L/min plasma, 1 L/min auxiliary, 0.7 L/min nebulizer flow rates in SVDV mode. Three replicate readings were taken for the monitored wavelength for all samples.
Preparation of copper chloride suspensions
To mimic a Cu2+ ion only exposure, CuCl2 solution was prepared from cell culture grade pure copper (II) chloride dihydrate. CuCl2 solution was prepared in FE1 cell culture media with 2% serum at two different concentrations. The high concentration of CuCl2 (54 µg/mL, 570 nmol Cu) is equivalent to the total copper content contained in 25 µg/mL CuO NPs (566 nmol Cu). The 7 µg/mL concentration of CuCl2, which is more relevant, represents 2.64 times the predicted extracellular Cu expected to be released from 10 µg/mL CuO NPs based on 48 h particle dissolution experiments. The 54 μg/mL concentration of CuCl2 reflecting a 100% particle dissolution scenario was included in the viability experiments to assess the degree of cytotoxicity induced by exposure to an equimolar dose of dissolved Cu compared to CuO NPs. However, this dose was not included in the toxicogenomics experiments since it does not represent a realistic exposure scenario with relation to the extracellular dissolution of CuO NPs. In order to account for the influence of chloride (Cl) ions on transcriptional responses, NaCl was prepared in FE1 cell culture medium at a dose that contains an equimolar amount of Cl ions as 7 μg/mL CuCl2.
Dose metrics
The particle and metal salt concentrations used in this study are expressed in terms of mass-concentration. For comparative purposes, the particle and salt concentrations expressed in terms of copper molar concentration, mass-surface area concentration, and particle specific surface area are provided in .
Table 1. Copper oxide particle concentrations and copper chloride salt concentrations expressed in terms of copper molarity, surface area of exposure, and particle specific surface area.
Cell exposure, imaging, and sample collection for cell viability and transcriptomic analyses
For the CuO NPs, CuO MPs and CuCl2 experiments, cells from four individual passages were used (four biological replicates) in four separate experiments. Cells were plated at a cell density of 130 000 cells/well in 6-well plates. Following overnight incubation, cells were exposed to 1.8 mL of 1, 5, 10, and 25 µg/mL CuO NPs, CuO MPs or 7 and 54 µg/mL CuCl2. For all exposures, blank media exposed cells served as negative controls. For CuCl2 experiments, cells treated with 5 µg/mL NaCl were also used as an additional control to rule out the possible contribution of Cl ions to the observed cellular toxicity in CuCl2 exposures. Following 2, 24, and 48 h of exposure, cell supernatant was harvested, cells were washed with PBS. Phase-contrast images were acquired for all exposed samples at 4X, 10X, or 20X. Following imaging, cells were trypsinized and suspended in fresh cell culture media. An aliquot of cell suspension was used for Trypan Blue dye exclusion staining and the rest of the cells were pelleted by centrifugation (8000 rpm, 10 min, 4 °C) and frozen at −80 °C for subsequent analysis.
Trypan blue dye exclusion staining
Trypan Blue dye exclusion staining was conducted as per Decan et al. (Citation2016). Briefly, 10 µL of cell suspension was combined with 10 µL Trypan Blue dye and incubated for 5–7 min at room temperature before cell counting in a hemocytometer. The number of white and blue cells were counted in four quadrants. The ratio between white and total cells was used to calculate percent cell viability for each exposure condition and timepoint. Each measurement was conducted in triplicate or quadruplicate (n = 3, 4).
RNA extraction, quantification, and integrity analysis
RNA extraction, quantification, and integrity analysis were conducted as in Decan et al. (Citation2016). Following exposure and collection of cell pellets, TRIzol reagent was used to isolate RNA in conjunction with Direct-zol RNA Miniprep Kit (Zymo Research Corp, Irvine, USA) according to manufacturer’s protocol (with a 2 min incubation in water prior to elution). Total RNA concentration and purity were determined using a NanoDrop 2000 spectrophotometer (Thermo Fisher Scientific Inc., Waltham, USA). RNA integrity and quality analysis were conducted using an Agilent 2100 Bioanalyzer system (Agilent Technologies, Inc., Santa Clara, USA). RNA samples with an RNA Integrity Number (RIN) of ≥5 were used for subsequent microarray experiments.
Microarray hybridization
RNA microarray hybridization and scanning were performed as outlined in Decan et al. (Citation2016). Briefly, 200 ng of purified RNA from each exposure group (CuO NP, CuO MP, CuCl2 (7 µg/mL), or vehicle control exposed; n = 3 for each) and universal reference RNA were reverse transcribed into double-stranded cDNA which were then transcribed into cyanine 5-CTP (sample) and cyanine 3-CTP (reference) labeled cRNA. Each experimental cRNA sample was mixed with an equimolar amount of reference cRNA and hybridized to 8x60K Agilent SurePrint G3 Mouse Gene Expression v2 Microarray (Agilent Technologies, Inc., Santa Clara, USA) slides in a hybridization chamber for 17 h at 65 °C rotating at 10 rpm. Microarray slides were washed according to the manufacturer’s protocol and scanned on an Agilent G2505B scanner. Data from the resulting images was extracted using Agilent Feature Extraction software version 11.01.1.
Statistical analysis of microarray data
Statistical analysis of microarray data sets was conducted as outlined in Poulsen et al. (Citation2015). In brief, a randomized reference design using reference and sample cRNA was used (Kerr and Churchill Citation2001). The commonly used LOWESS method was employed to normalize the data sets and statistically significant differences between differentially expressed genes were determined using microarray analysis of variance (MANNOVA) test in the ‘R’ statistical software (Wu et al. Citation2003). The Fs statistic was used to test for treatment effects. The permutation method was used to estimate p-values for each statistical comparison, with adjustment for multiple comparisons using the false discovery rate multiple testing correction (Benjamini and Hochberg Citation1995). Fold changes of differentially expressed genes (DEGs) were based on least-square means (Searle, Speed, and Milliken Citation1980). Genes showing at least 1.5-fold expression changes in either direction and corrected p-values ≤ 0.05 were considered as significantly differentially expressed. All microarray datasets used in this study have been deposited in the NCBI gene expression omnibus database and can be accessed via the accession number GSE161017.
Pathway analysis of microarray data
Canonical pathway analysis was conducted on statistically significant DEGs (FDR p ≤ 0.05, fold change ≥ 1.5) using Ingenuity Pathway Analysis (IPA) software (content version 48207413, license from Ingenuity Systems, Redwood City, CA, USA). Only samples with ≥ 40 DEGs were used for IPA analysis. Pathways were considered significantly perturbed if –log(p-value) was ≥1.3. Pathways were considered significantly activated if the –log(p-value) was ≥1.3, with a Z-score ≥2. Similarly, pathways were considered significantly inactivated if the –log(p-value) was ≥1.3, with a Z-score ≤2.
In addition, targeted analysis of genes associated with processes such as oxidative stress, DNA damage, cellular stress, and cell cycle was conducted. For this, the 84-gene lists extracted from the mouse Qiagen RT2 Profiler qPCR arrays available for Autophagy, Apoptosis, Necrosis, Cell Cycle, DNA Damage Signaling Pathway, Cellular Stress Responses, Oxidative Stress, and Antioxidant Defenses were used and the specific differences between NPs and ion mediated responses in these key processes were determined.
Cytoscape ClueGO annotation of low responding samples
For samples with <40 DEGs, ClueGO enrichment analysis was conducted in Cytoscape 3.7 for gene ontology (GO) biological process, cellular component, and molecular function simultaneously. Significantly up and down-regulated genes were placed in two clusters (labeled red or blue, respectively). A right-sided hypergeometric enrichment test was conducted for both sample cluster sets, with a Benjamini–Hochberg corrected p-value cutoff of ≤0.05. Enriched GO terms are displayed according to cluster specificity. If >60% of mapped genes correspond to one gene cluster, the cluster was labeled as specific to the gene list (red or blue), otherwise, the GO term was colored gray and was labeled as nonspecific to any gene cluster.
Results
Particle characterization and dissolution in culture media
The CuO NPs used in this study had a manufacturer-reported primary particle size of 28 nm and a specific surface area of 33 m2/g. Supplementary TEM imaging shows that the CuO NPs have an oblong shape with an average length of 45.9 (±28.0) nm and an average width of 64.8 (±47.0) nm (Supplementary Figure S1). Detailed characterization of the primary CuO NPs can be found in Bushell et al. (Citation2020), which shows that the crystallite size is 49.0 (±28.1) nm. Dynamic light scattering analysis of suspended CuO NPs is summarized in , and shows a high degree of suspension stability over time, with a PDI of <0.3 for all time points tested. Multi-modal distribution analysis of DLS results shows that at 0, 2, and 24 h the particle distribution is unimodal, and at 48 h a small secondary peak appears (1.2%) which represents 5 μm aggregates (Supplementary Table S1). Particle dissolution experiments show that the dissolution of CuO NPs increases with increasing concentration, reaching 12.6 and 51.5% dissolved particle mass after 48 h at concentrations of 10 and 100 µg/mL, respectively (). In contrast, CuO MPs exhibited negligible dissolution across the experimental timeframe, with only 1.5% of the initial particle mass dissolving by 48 h at a concentration of 100 µg/mL. Additional information concerning the dissolution of CuO NPs and MPs in water and cell culture media can be found in Avramescu et al. (Citation2020).
Figure 1. Dissolution of CuO NPs and MPs in DMEM culture medium with 2% FBS for 0–48 h. Error bars indicate one standard deviation about the mean.
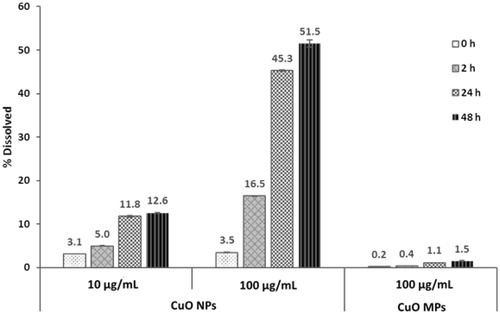
Table 2. Characterization of CuO NPs used for in vitro FE1 exposures. PDI: poly-dispersity index.
The CuO MPs examined in this study had an average primary particle size of 5 µm, with a specific surface area of 4–6 m2/g as reported by the manufacturer. Additional SEM imaging confirms the primary size reported by the manufacturer and shows that the particles have a slightly oblong shape with an average length of 4.4 (±2.9) μm and an average width of 6.3 (±3.5) μm (Supplementary Figure S2). Due to rapid sedimentation in suspension, DLS analysis could not be completed.
Selection of doses
The LDH enzymatic method of cytotoxicity assessment resulted in pronounced interference with CuO NPs (Supplementary Figure S3) at higher doses. Cytotoxicity was not observed for any doses at 2–24 h post-exposure; however, a dose-dependent quenching of absorbance associated with the two highest doses (50 and 100 µg/mL) was observed at all time points. At 48 h, subtle dose-dependent cytotoxicity was observed at the lower doses of 5–10 µg/mL CuO NPs. The two highest doses (50 and 100 µg/mL CuO NPs) showed complete quenching of absorbance at 48 h. Phase-contrast imaging showed no adherent cells at the two highest doses of 50 and 100 µg/mL at 48 h (data not shown). Thus, for the purposes of subsequent experiments, 1–25 µg/mL concentrations of CuO NPs were used and the cytotoxicity assessment method was changed to cell viability assessment by Trypan Blue dye exclusion staining.
Viability assessment
Exposing FE1 cells to 1–25 µg/mL CuO MPs did not result in a significant decrease in viability as compared to time-matched media controls at any time point tested (). No viability loss was observed following 2 h of exposure to any dose of CuO NPs, at 24 h following low dose (1 and 5 µg/mL), or at 48 h after exposure to 1 µg/mL dose. Treatment with 10 or 25 µg/mL CuO NPs resulted in a statistically significant decrease in cell viability to 89.7% (±3.4%, p < 0.01) and 64.6% (±12.2%, p < 0.01), respectively at 24 h. At 48 h, viability was decreased to 91.6, 71.4, 13.1% (±2.9, 2.5, 10.0%, p < 0.05, 0.01, 0.001) after exposure to 5, 10, and 25 µg/mL CuO NPs, respectively.
Figure 2. Trypan Blue exclusion assay results. FE1 cell viability following 2–48 h exposure to media control, CuO NPs, CuO MPs, or CuCl2. Error bars represent standard error. Significant differences between each treatment group and media control at respective timepoints were determined using a Students’ t-test (n = 4). *p < 0.05; **p < 0.01; ***p < 0.001.
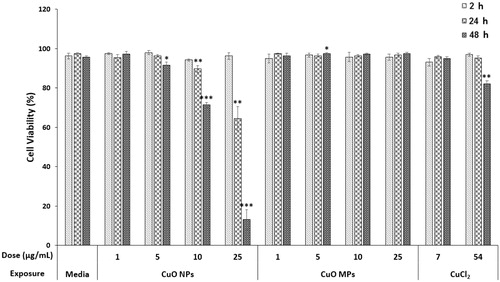
Treatment with 7 µg/mL CuCl2, resulted in no loss of viability across the exposure duration. Treatment with 54 µg/mL CuCl2 resulted in significantly decreased viability only at 48 h, with 82.2% (±2.5%, p < 0. 05) viable cells.
DEG analysis of CuO NPs and CuO MPs exposed FE1 cells
Gene expression analysis was conducted on all CuO NPs exposed sample groups (with the exception of 25 µg/mL dose group at the 48 h timepoint due to overt cytotoxicity and an insufficient amount of material for RNA extraction), CuO MPs, and 7 µg/mL CuCl2 exposed groups ().
Figure 3. Number of DEGs (as compared to media controls) in FE1 cells exposed to CuO NPs, CuO MPs, and 7 µg/mL CuCl2 for 2 h, 24 h, and 48 h. A DEG is defined as having at least 1.5-fold expression change in either direction from time matched media control with a FDR p-value ≤ 0.05. Red (Left bar): Upregulated; Blue (Right bar): Downregulated. Refer to the online copy of this manuscript for the original colour version of this figure.
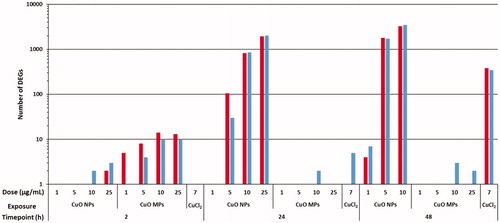
In general, the transcriptional response to CuO MPs was subtle with a maximum of 30 DEGs at any time point of assessment. The most pronounced response was observed at the 2 h timepoint, where a dose-dependent increase in DEGs was observed (24 total DEGs at the highest dose; 13 up-regulated, and 11 down-regulated). At 24 and 48 h, the response was reversed, with less than 5 DEGs at any dose.
Exposure to CuO NPs resulted in pronounced gene expression changes in a dose and time-dependent manner. The response to CuO NPs was subtle at the 2 h timepoint with less than 10 DEGs at any dose. At 24 h, 1 (downregulated), 135 (105 upregulated, 30 downregulated), 1677 (819 upregulated, 858 downregulated), and 3934 (1924 upregulated, 2010 downregulated) DEGs were observed, for cells treated with 1, 5, 10, and 25 µg/mL CuO NPs, respectively. The response at 48 h for 5 and 10 µg/mL treated cells was greater than at 24 h, with 3493 DEGs (1781 up, 1712 down) and 6730 DEGs (3272 up, 3458 down) respectively, however, the response was minimal for cells treated with 1 µg/mL CuO NPs (11 DEGs, 4 upregulated and 7 downregulated).
In contrast, there were only 2 and 6 DEGs in cells treated with 7 µg/mL CuCl2 at 2 h and 24 h, respectively. At 48 h, CuCl2 induced 725 DEGs (379 upregulated, 346 downregulated).
Cytoscape – ClueGO gene set enrichment of low responding experimental groups
All samples which showed a cumulative DEG count <40 were used for GO gene set enrichment analysis (molecular function, biological process, and cellular compartment) using ClueGO. From all samples analyzed, only FE1 cells exposed to 25 µg/mL CuO MPs at the 2 h timepoint had significantly enriched GO terms (Supplementary Figure S4). The enriched categories were represented by the downregulated DEGs implicated in the biological processes ‘regulation of meiotic cell cycle’ [GO:0051445] and ‘anaphase-promoting complex-dependent catabolic process’ [GO:0031145], as well as the cellular components ‘nuclear ubiquitin ligase complex’ [GO:0000152] and ‘anaphase-promoting complex’ [GO:0005680].
Ingenuity pathway analysis of transcriptomic response in FE1 cells treated with CuO NPs or CuCl2 for 24 and 48 h
The complete list of significantly perturbed canonical pathways for all relevant samples can be found in the supplement information (Supplementary Tables S2–S7). In brief, treatment with 5, 10, or 25 µg/mL CuO NPs for 24 and 48 h resulted in a dose and time-dependent increase in the number of perturbed pathways. At 24 h, 11, 47, and 90 canonical pathways were perturbed after treatment with 5, 10, and 25 µg/mL, respectively. At 48 h, 25 µg/mL CuO NP exposure was overtly cytotoxic and could not be assessed for transcriptional response. In cells exposed to 5 and 10 µg/mL CuO NPs for 48 h, 80, and 123 pathways were perturbed, respectively. In response to 48 h treatment with 7 µg/mL CuCl2, 37 canonical pathways were perturbed.
The 10 most significantly perturbed IPA canonical pathways for all CuO NPs samples are shown in . ‘Phagosome maturation’ and ‘Iron homeostasis’ are the most affected canonical pathways in the 5 µg/mL dose group at 24 h (−log(p-value) >5 in both cases), with other pathways mostly related to biosynthesis and cellular metabolism. In addition, ‘Bag2 signaling pathway,’ and ‘Autophagy’ related to an unfolded protein response were also perturbed. At 10 µg/mL, pathways involved in cellular injury and stress, such as oxidative stress (‘Nrf2-mediated oxidative stress’), protein turnover (‘Protein ubiquitination pathway’), and detoxification (‘Glutathione redox reactions I,’ ‘Glutathione mediated detoxification’) were among the most significantly altered. At the highest dose of 25 µg/mL CuO NPs at 24 h, DNA damage and repair pathways (‘Mismatch repair in eukaryotes,’ ‘Role of BRCA1 in DNA damage response’) and protein damage pathways (‘Unfolded protein response’) were among the most significantly affected. Furthermore, pathways implicated in cell death were also altered at this dose, at 24 h (Supplementary Table S4).
Figure 4. Top 10 most significantly perturbed IPA canonical pathways in relevant CuO NPs and CuCl2 exposed samples. If z-score ≥ 2, the pathway is unambiguously activated.
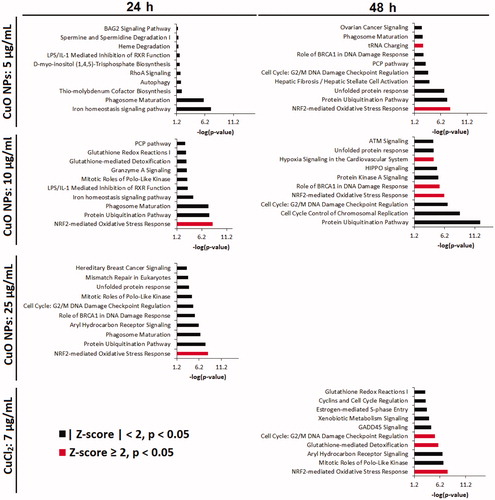
At 48 h, cells treated with 5 and 10 µg/mL CuO NPs both exhibited substantial disturbances in cellular stress (‘NRF2-mediated oxidative stress response,’ ‘Protein ubiquitination pathway,’ ‘Unfolded protein response’), and DNA damage response (‘Cell cycle: G2/M DNA damage checkpoint regulation,’ ‘Role of BRCA1 in DNA damage response’) pathways (). Cell death pathways (‘Death receptor signaling,’ ‘p53 signaling’) were also disturbed in both dose groups of CuO NPs at this timepoint, albeit with lower significance (Supplementary Tables S5 and S6).
The transcriptional response to 7 µg/mL CuCl2 was pronounced only at 48 h (). Oxidative stress (‘NRF2-mediated oxidative stress response’), DNA damage responses (‘GADD45 signaling,’ ‘Cell cycle: G2/M DNA damage checkpoint regulation’), cell cycle processes (‘Estrogen-mediated S-phase entry,’ ‘Cyclins and cell cycle regulation,’ ‘Mitotic roles of polo-like kinase’) and detoxification responses (‘Aryl hydrocarbon receptor signaling,’ ‘Glutathione-mediated detoxification,’ ‘Xenobiotic metabolism signaling,’ ‘Glutathione redox reactions I’) were the most affected. The ‘Bag2 signaling pathway’ was also affected, albeit less significantly (−log(p-value) = 1.3, Z-score = 2, Supplementary Table S7).
Analysis of relevant cellular stress responses
From the heat maps shown (), it can be seen that CuO NPs begin to induce differential expression of genes related to oxidative stress and cellular stress at 24 h after exposure to 5 µg/mL dose. Hspa1a (25.4-fold), Hmox1 (6.3-fold), Hspb1 (2.0-fold) and Sqstm1 (2.8-fold) were the most upregulated genes. At 10 µg/mL, the response observed at 5 µg/mL dose was amplified both in the number of DEGs and the magnitude of the expression fold change. Eighteen DEGs related to oxidative stress and antioxidant defenses, and cellular stress responses, 7 DEGs associated with DNA damage signaling, and 8 cell cycle process related DEGs were observed at this dose and timepoint. At 48 h, cells exposed to CuO NPs exhibited severe cellular stress with altered expression of genes related to all cell stress-related processes assessed. Specifically, for 5 and 10 µg/mL CuO NPs exposed cells respectively; 32 and 42 DEGs related to oxidative stress and antioxidant defenses, 39 and 22 DEGs related to cellular stress, 38 and 24 DEGs related to DNA damage signaling, and 47 and 28 DEGs related to cell cycle processes were observed.
Figure 5. Heatmap of key differentially expressed genes related to 4 relevant cellular stress response pathways after exposure to 1–10 µg/mL CuO NPs or 7 µg/mL CuCl2 for 2–48 h.
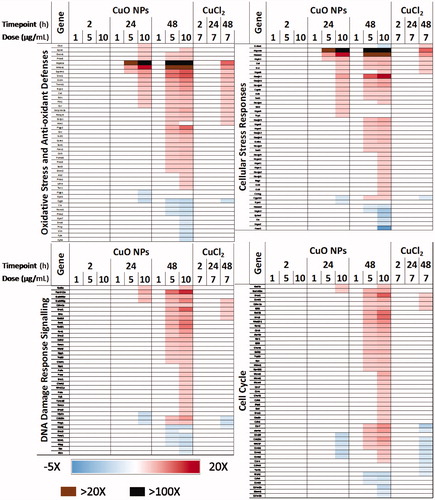
In comparison, cells exposed to 7 µg/mL CuCl2 () show differential expression of genes related to all assessed processes, but only at 48 h and with lower severity. At this late time point, cell cycle processes, oxidative stress, and antioxidant defenses were the most affected with 15 and 16 DEGs respectively and 8 DEGs were associated with cellular stress and DNA damage signaling.
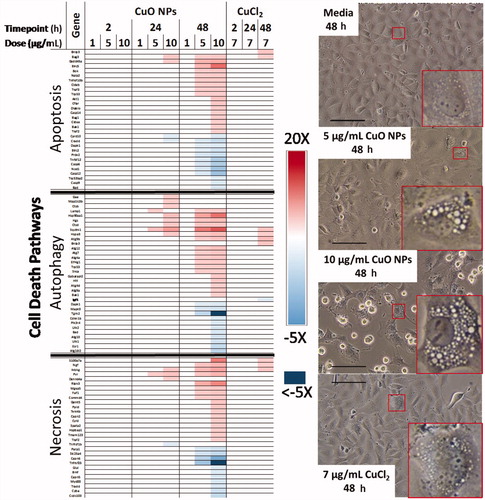
The process of cytotoxicity was also assessed separately. A heatmap representation of key DEGs related to the cell death processes of apoptosis, autophagy, and necrosis is presented in . A total of 6 DEGs were common to two pathways: Dapk1, Bnip3, Trp53, Bad, and Bak1 are involved in apoptosis and autophagy, while Traf2 is involved in apoptosis and necrosis. At 24 h, there was a dose-dependent increase in DEGs related to autophagy (2 DEGs at 5 µg/mL, 8 DEGs at 10 µg/mL). Subtle changes in a few genes related to necrosis and apoptosis was also seen at 10 µg/mL (4 DEGs for both), and to a lesser extent in 5 µg/mL CuO NP treated cells (upregulation of Pvr is noted). After 48 h of exposure to CuO NPs, all three cell death pathways showed similar numbers of DEGs, with a dose-dependent increase from 5 to 10 µg/mL CuO NPs (16 and 29 DEGs related to autophagy, 17 and 29 DEGs related to apoptosis, 11 and 28 DEGs related to necrosis, respectively). While all three cell death pathways have similar numbers of DEGs at 48 h after exposure to 10 µg/mL CuO NPs; autophagy and necrosis related transcripts had a larger range in differential expression as compared to apoptosis (−5 to 11.5-fold, −6.7 to 8.6-fold, −3.4 to 9.7-fold for autophagy, necrosis, and apoptosis-related transcripts respectively). In comparison, CuCl2 exposed cells at 48 h displayed mild differential expression of 10 cell death-related transcripts; 2 related to apoptosis (Bnip3, 2.3-fold; Bag3, 1.6-fold), 5 related to autophagy (Atg9b, 3.2-fold; Bnip3, 2.3-fold; Sqstm1, 2.5-fold; Hspa8, 1.5-fold; Igf1, −1.6-fold), and 3 related to necrosis (Ikbkg, 2.2-fold; S100a7a, 1.7-fold; Ngf, 1.6-fold), with no differential expression noted at earlier timepoints. Phase-contrast images from the 48 h timepoint highlight extensive cytoplasmic vacuolation seen for cells exposed to 5 and 10 µg/mL CuO NPs as compared to time-matched media control and 7 µg/mL CuCl2 exposed cells ().
Figure 6. Heatmap of key DEGs related to the cell death pathways of apoptosis, autophagy, and necrosis. Phase contrast micrographs highlight cytoplasmic morphology after exposure to CuO NPs, CuCl2, and media control for 48 h, scale bar = 125 µm, red insets highlight representative cells.
Discussion
The toxicity of CuO MPs and CuO NPs is well established and is mostly attributed to 1) the particles’ ability to interact with cellular membranes or intracellular components and 2) their ability to dissolve in physiological environments, both of which are additionally influenced by their specific physical-chemical properties such as size and concentration of particles in suspension (; Semisch et al. Citation2014). While the toxicity mechanisms of CuO NPs have been well studied, the proportional contribution of ions and particles to toxicity has not been assessed systematically. In this study, genome-wide transcriptional profiling was carried out to elucidate the temporal transition of toxicity and the relative influence of particle size and form on cellular toxicity. A mode-of-action pathway was constructed to summarize these key differences ().
Figure 7. Proposed mode-of-action pathway built from transcriptional analysis for a minimally-cytotoxic dose of CuO NPs (5 µg/mL) (A) as compared to a relevant dose of CuCl2 (7 µg/mL) (B), and the highest dose of CuO MPs tested (25 µg/mL) (C). Labels in red within the cell indicate induced responses, for which there is pathway and gene level evidence. Squiggle represents protein aggregates. Red circles with a solid squiggle represent autophagosomes. Green solid circles represent stable lysosomes. Green dashed circles represent permeabilized lysosomes. Yellow solid circle with a dashed squiggle represents autophagolysosomes. In this model, kinetic differences in transcriptional responses are suggested to result from the CuO particle size and species-specific cellular interactions. At the time of exposure, CuO MPs have negligible or no Cu2+ species and CuO NPs exposure stock consist of ∼3% ions, whereas CuCl2 suspension is predominantly made up of Cu2+ ions. The mild and acute transcriptional responses to the highest dose of CuO MPs are transitory in nature, and are only observed sub-acutely after exposure, which is thought to be related to nonspecific interaction of large particles with the cell membrane. Lack of change in response with longer exposure duration suggests that CuO MPs are stable extracellularly and most likely will require prolonged exposure to be able to induce toxicity in whole animals or humans. In contrast, CuO NPs are rapidly internalized through nanoparticle-mediated bulk-transport mechanisms between 2 and 24 h after exposure, quickly overwhelming cellular defence mechanisms and leading to cellular injury with transcriptional disturbances in oxidative and cellular stress functions at 24–48 h. With increasing ionic concentration and overwhelmed autophagy response, leaky lysosomes can trigger cell death leading to loss of cell viability. Only a part of this response is observed in cells exposed to CuCl2 and only at 48 h of exposure. Please refer to the online copy of this manuscript for the original colour version of this figure.
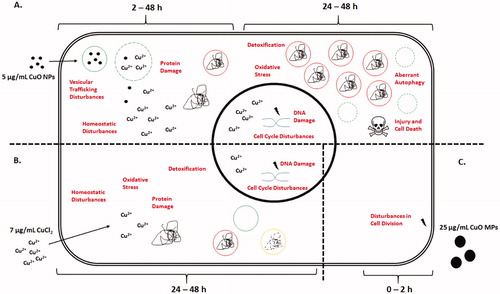
In alignment with the results of previously published studies, CuO NPs exhibited higher levels of cytotoxicity in comparison to the same mass doses of CuO MPs and an equimolar dose of Cu ions (Wongrakpanich et al. Citation2016; Strauch et al. Citation2017). Cellular response to CuO MPs was negligible and only observed at the transcriptional level, with altered expression of a few genes associated with cell cycle functions (Supplementary Figure S3). The altered transcriptional response was evident early, within two hours of exposure (2 h), at the highest dose tested but was not observed after 24 h or 48 h of exposure. CuO MPs are slow to dissolve in culture medium () and the large average primary particle size of the CuO MPs (5 µm) in the present study is not conducive to uptake by lung epithelial cells, which have been shown to efficiently internalize particles up to 3 µm in size (Foster, Yazdanian, and Audus Citation2001). It is posited that the acute transcriptional responses observed at 2 h following CuO MPs exposure are due to extracellular particle – membrane interactions. However, low levels of particle dissolution and inefficient cellular uptake of CuO MPs explain the dampened response at later post-exposure time points and cellular adaptation.
Exposure to both CuO NPs and dissolved copper ions has been shown to induce similar downstream cellular responses, such as cell cycle arrest, oxidative stress, DNA damage signaling, and apoptosis (Strauch et al. Citation2017). From temporal gene expression analysis conducted in the present study, observed CuO NPs mediated cellular stress responses are induced at a low concentration of 5 µg/mL at 24 h and involve a heat shock response, disturbances in metabolic pathways, and vesicular trafficking (‘Autophagy,’ ‘Phagosome maturation’) (; Supplementary Table S2). However, there was no concomitant pathway induction of an oxidative stress response noted at this time point and dose. Analysis of the ‘Bag2 signaling pathway’ mediated heat shock response shows the disturbance is caused by upregulation of heat shock protein (HSP) transcripts Hspa1a (25-fold), and Hspa1b (11-fold) (Supplementary Figure S8), responsible for proper protein folding and maintenance and whose expression is increased due to cellular stress (Daugaard, Rohde, and Jäättelä Citation2007). Furthermore, at 24 h, metallothionein (MT) transcripts Mt1 and Mt2 were both upregulated after exposure to 5–25 µg/mL CuO NPs (Mt1: 6.2, 7.4, 5.3-fold respectively; Mt2: 7.0, 7.8, 4.8-fold respectively; Supplementary Figure S7), which are indicative of marked intracellular Cu accumulation (Strauch et al. Citation2017). Similar transcriptional responses have been reported in more advanced cells culture model systems, such as 3D cultures and air–liquid interface (ALI) exposure systems. Increases in the expression of MT1X, MT2A, and HSPA1A have been reported in A549 cells exposed for 24 h to CuO NPs in an ALI system (Hufnagel et al. Citation2020). Increased expression of HSP and MT transcripts has also been seen in 3D human bronchial epithelial cell cultures exposed to CuO NPs for 25 h in ALI (HSP90AA1, MT1M, MT2F) and in mouse lung tissue from 24 h in vivo oropharyngeal CuO NP exposures (Hsp90aa1, Mt1, Mt2) (Ndika et al. Citation2020). These results suggest that the gene expression changes observed in the present study under the submerged exposure conditions are also observed in other cell types exposed under more complex exposure conditions as well as in vivo.
At 48 h after exposure to 5 and 10 µg/mL CuO NPs, the initial stress response is complemented by dose-dependent induction of oxidative stress, DNA damage, cell cycle disturbances and cell death pathway signaling (; Tables S1 and S2; Tables S4–S5). With respect to oxidative stress-related transcripts, pronounced upregulation of Hmox1 (32, 33-fold), Sqstm1 (8.7, 11-fold), and Srxn1 (9.4, 11-fold) were noted for both tested concentrations, as well as dose-dependent downregulation of 4 transcripts including Cygb (−2.2, −2.4-fold) and Ccs (−1.6, −2.1-fold) (). Upregulation of MT transcript expression is still evident, but to a lesser magnitude for both doses (Mt1: 2.8, 3.5-fold respectively; Mt2: 2.1-fold for 5 μg/mL; Supplementary Figure S7). Treatment with 7 µg/mL CuCl2 resulted in a meaningful transcriptional response only at 48 h. At this timepoint, Mt1 and Mt2 are both upregulated (5.7, 7.9-fold respectively), and similar pathways to CuO NP exposed cells are affected, including the ‘Bag2 signaling pathway’ with upregulated expression of Hspa1a (10.5-fold), Hspa1b (5.2-fold), Cdkn1a (2.6-fold), and Hspa8a (1.5-fold) (Supplementary Figure S8), and oxidative stress signaling with upregulation of Hmox1 (6.7-fold), Sqstm1 (2.5-fold) and Srxn1 (3.6-fold) as well as downregulation of Cygb (−2.0-fold) (). While the extracellular dissolution of CuO NPs in cell culture media is low at the 10 μg/mL concentration (12.6% at 48 h, ), particle dissolution is suggested to increase markedly in acidic conditions, such as those found within lysosomal and endosomal vesicles (Moschini et al., Citation2013; Strauch, Hubele, and Hartwig Citation2020), resulting in marked increases in intracellular copper levels (Strauch, Hubele, and Hartwig Citation2020). In addition, while CuO NPs can be efficiently internalized through endocytosis (Strauch, Hubele, and Hartwig Citation2020), dissolved copper ions are transported into the cell using solute carrier family transport proteins such as the high-affinity copper uptake protein 1 (Ctr1, encoded by Slc31a1) (Prohaska Citation2008). Finally, it is known that transcriptional regulation of heavy metal response in mice is accomplished through increased metal regulatory transcription factor 1 (Mtf1) expression levels (Balamurugan and Schaffner Citation2006), which is seen after exposure to 5 μg/mL CuO NPs at 48 h (1.6-fold, data not shown), but not after exposure to CuCl2. These results indicate, first, that similar pathways are induced at the transcriptional level after treatment with CuO NPs and dissolved CuCl2 and second, that the temporal aspects of response are potentiated by the presence of elevated intracellular Cu ion levels, which is more pronounced after NP exposure due to the known ‘Trojan-Horse’ mechanism of toxicity as described in Moschini et al., (Citation2013) and Strauch, Hubele, and Hartwig (Citation2020). Damage to intracellular organelles and biomolecules can induce the process of autophagy, which recycles deformed or malfunctioning cellular components into reagents necessary for cell growth and homeostasis. At 24 h, CuO NPs induce significant disturbances in the canonical pathway of ‘Autophagy’ (Supplementary Tables S2–S4). At 48 h post-exposure, key transcripts related to autophagy are disturbed after treatment with 5 and 10 µg/mL CuO NPs – but no longer in a way as to induce pathway disturbance (; Supplementary Tables S5 and S6). Concomitantly, key transcripts related to apoptosis and necrosis are recruited and there is a significant disturbance of cell death pathways (; Supplementary Tables S5 and S6). Phase-contrast images at 48 h post-exposure show extensive cytoplasmic vacuolization for cells treated with CuO NPs, but not for cells treated with 7 µg/mL CuCl2. Despite the fact that the high dose of CuCl2 was not assessed transcriptionally, phase-contrast images of FE1 cells following 48 h exposure to 54 µg/mL show qualitatively similar vacuolization as seen in CuO NPs exposed cells (Supplementary Figure S5). The lysosomal sequestration of CuO NPs leads to lysosomal depletion through vesicular instability, resulting in a cytoplasmic overload of non-degraded autophagosomes, downstream blockage of autophagy, and cell death (Sun et al. Citation2012; Laha et al. Citation2014; Zhang et al. Citation2018). Our results show that cellular exposure to a high level of dissolved copper ions may induce similar disturbances in autophagy but at a slower pace compared to cells exposed to CuO NPs.
Considering that differences in transcriptional pathway induction became apparent only after longer exposure duration (48 h), future transcriptomic studies should design experiments involving lower doses and longer exposure timespans.
An AOP for in vitro cytotoxicity with relevance to MONPs
Based upon the systematic analysis of the transcriptomic responses after in vitro exposure to different forms of CuO, and analysis of the existing literature, a putative AOP with relevance to MONPs of diverse properties is proposed for cytotoxicity, a commonly assessed and reported adverse outcome in vitro for NMs ().
Figure 8. A proposed adverse outcome pathway for in vitro cytotoxicity relevant to MONPs. MIE: molecular initiating event; KE: key event; AO: adverse outcome. Solid arrows: adjacent key event relationship; dashed arrows: non-adjacent key event relationship. Event IDs in blue indicate a connection to a KE present in the AOPwiki. Relevant endpoints for assessment are listed, with a suggested assay for rapid screening in parentheses.
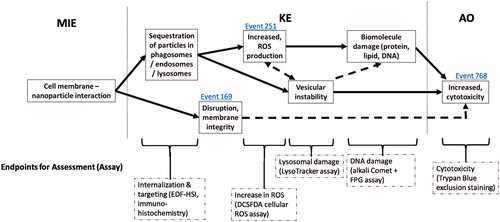
The molecular initiating event (MIE) in this putative AOP is the nano-bio interaction (not assessed in the present study). The lack of significant response after exposure to CuO MPs in this study highlights the importance of primary particle size in the induction of downstream events leading to cell death. Similar size dependence on toxic response has been shown in FE1 cells in vitro after exposure to silica nanoparticles (Decan et al. Citation2016).
From the research conducted so far, vesicular localization of MONPs seems to be a hallmark event of MONPs-induced cytotoxicity in vitro or in vivo. Endocytic or lysosomal sequestration is attributed to cytotoxicity induced by several MONPs including CuO, zinc oxide (ZnO), titanium dioxide (TiO2), silica (SiO2), and cerium (IV)oxide (CeO2) (Singh et al. Citation2007; Asati et al. Citation2010; Zhu, Eaton, and Li Citation2012; Lai et al. Citation2015; Decan et al. Citation2016; Strauch, Hubele, and Hartwig Citation2020), which is highly influenced by the degree of solubility and particle-surface properties. Soluble MONPs, such as ZnO, CuO, and rare earth oxides are rapidly dissolved in the endosomal/lysosomal microenvironment, releasing large amounts of reactive ions (Semisch et al. Citation2014; Ivask et al. Citation2017; Mirshafiee et al. Citation2018; Strauch, Hubele, and Hartwig Citation2020). While the dissolution of soluble MONPs within the vesicles causes increased vesicular instability and ROS generation, eventually leading to cell death; insoluble or poorly soluble MONPs, such as SiO2 and TiO2, cause vesicular destabilization due to particle overload and inhibition of exocytosis (Zhu, Eaton, and Li Citation2012; Decan et al. Citation2016). The intrinsic reactivity of poorly soluble MONPs has a strong impact on the level of toxicity observed. For example, a strong correlation in toxicity for poorly soluble MONPs which have conductance band gaps in the range of the cellular redox potential (−4.12 to −4.84 eV) (Zhang et al. Citation2012) was shown in a study using 24 different MONPs. Particles with band gaps in the range are liable to strongly interfere with cellular redox couples (Zhang et al. Citation2012), which contributes to enhanced vesicular instability. The toxification of the cytoplasm (through acidification, metal ion overload, and ROS generation) leads to biomolecule damage, which culminates in cytotoxicity if left unchecked (Boya and Kroemer Citation2008). Inhibition of endocytosis or endosomal/lysosomal vesicle acidification is shown to drastically reduce or inhibit MONP induced cytotoxicity (Asati et al. Citation2010; Zhang et al. Citation2018; Strauch, Hubele, and Hartwig Citation2020).
In addition to increased cytotoxicity arising from particle internalization and vesicular localization, research has shown that direct ENM (including MONP) interaction with the cell membrane can induce membrane damage, which can also lead to cytotoxicity. SiO2 NPs have been shown to disrupt model lipid bilayers in cell-free conditions through direct association (Leroueil et al. Citation2008; de Planque et al. Citation2011). Membrane disruption and increased permeability have also been reported in lipid bilayers exposed to cationic quantum dots, iron oxide NPs, Au NPs, and complex layered iron oxide SiO2 NPs (Schulz, Olubummo, and Binder Citation2012). The specific effect on the lipid bilayer depends on physical-chemical properties such as surface charge and hydrophilicity/phobicity (Schulz, Olubummo, and Binder Citation2012). This extracellular membrane-NP interaction leading to membrane disruption can explain residual cytotoxicity seen in cells after exposure to MONPs in the presence of endocytosis inhibitors, such as in Asati et al. (Citation2010). It is granted that the KEs identified in the putative AOP are influenced by the physical-chemical properties of the MONP being investigated (ex. chemical composition and degree of particle solubility). The putative AOP is relevant to adverse outcomes observed in vivo following lung exposure to a range of MONPs. For example, cellular uptake, vesicular instability, and cytoplasmic vacuolization, and increased cytotoxicity are all observed in vivo after exposure to ZnO, cobalt oxide (CoO), lanthanum oxide (La2O3), CuO, and TiO2 (Cho et al. Citation2011; Sisler et al. Citation2015; Gosens et al. Citation2016; Rahman et al. Citation2017). Thus, although in its preliminary roadmap version, the AOP highlights common KEs that can be targeted for measurement in vitro by specific endpoints and assays, and enable the development of tier-1 testing or screening strategies to prioritize MONPs for further testing by more advanced models involving animals. Moreover, specific genes highlighted in this study that showed dose-response and relevance to one or more of KEs (ex. Hspa1a, Hspa1b) can aid in the design of biomarker gene panels for measuring single or multiple KEs. However, more work is warranted before a quantitative AOP is built and specific biomarkers are validated. The putative AOP presented here specifically addresses the cytotoxicity mechanism induced by MONPs of varying solubility, where particle interaction with the cellular membrane and consequent cellular uptake plays an important role. It does not, however, include the specific interaction of released ions with the surrounding biomolecules, which may also be one of the MIEs triggering toxicity.
In conclusion, transcriptomic analysis of lung epithelial cells treated with CuO MPs, CuO NPs, and CuCl2 indicates temporal differences in response between the three exposure types plausibly related to the dynamics of cell-stressor interaction. Particle dissolution experiments in relevant culture media show differences based on particle size as well as concentration.
Mode-of-action analysis using transcriptional response as a basis highlights NP-specific effects related to vesicular internalization of NPs as integral to downstream toxicity. It is shown that there is a dose-dependent temporal stratification of injury type response after CuO NPs exposure, indicating that homeostatic disturbances and heat shock precede significant disturbances in oxidative stress, DNA damage, cell cycle, and cell death-related processes.
Using the mechanistic knowledge gathered from the transcriptomic response analyses and the existing literature on metal oxide-induced toxicity, a putative AOP for in vitro cytotoxicity induced by MONPs was proposed. The AOP describes the most essential KEs implicated in MONP induced toxicity in vitro and provides easily assessable endpoints with suggested rapid screening assays that can facilitate high-throughput tier-1 screening of MONPs toxicity in support of regulatory decision making.
TNAN-2020-OR-0220-File012.docx
Download MS Word (7.2 MB)Acknowledgments
The authors would like to thank Silvia Aidee Solorio Rodriguez and Luna Rahman for their help in reviewing the manuscript.
Disclosure statement
No potential conflict of interest was reported by the author(s).
References
- Akhtar, M., S. Kumar, H. Alhadlaq, S. Alrokayan, K. Abu-Salah, and M. Ahamed. 2016. “Dose-Dependent Genotoxicity of Copper Oxide Nanoparticles Stimulated by Reactive Oxygen Species in Human Lung Epithelial Cells.” Toxicology and Industrial Health 32 (5): 809–821. doi:10.1177/0748233713511512.
- Angelé-Martínez, C., K. Nguyen, F. Ameer, J. Anker, and J. Brumaghim. 2017. “Reactive Oxygen Species Generation by Copper(II) Oxide Nanoparticles Determined by DNA Damage Assays and EPR Spectroscopy.” Nanotoxicology 11 (2): 278–288. doi:10.1080/17435390.2017.1293750.
- Asati, A., S. Santra, C. Kaittanis, and J. Perez. 2010. “Surface-Charge-Dependent Cell Localization and Cytotoxicity of Cerium Oxide Nanoparticles.” ACS Nano 4 (9): 5321–5331. doi:10.1021/nn100816s.
- Avramescu, M., M. Chénier, H. Gardner, and P. Rasmussen. 2019. “Solubility of Metal Oxide Nanomaterials: Cautionary Notes on Sample Preparation.” Journal of Physics: Conference Series 1323: 012001.
- Avramescu, M-l, M. Chénier, S. Palaniyandi, and P. E. Rasmussen. 2020. “Dissolution Behaviour of Metal Oxide Nanomaterials in Cell Culture Media vs Distilled Water.” Journal of Nanoparticle Research 22 (8): 222. doi:10.1007/s11051-020-04949-w.
- Balamurugan, K., and W. Schaffner. 2006. “Copper Homeostasis in Eukaryotes: Teetering on a Tightrope.” Biochimica Et Biophysica Acta (BBA)- Molecular Cell Research 1763 (7): 737–746. doi:10.1016/j.bbamcr.2006.05.001.
- Benjamini, Y., and Y. Hochberg. 1995. “Controlling the False Discovery Rate: A Practical and Powerful Approach to Multiple Testing.” Journal of the Royal Statistical Society: Series B 57 (1): 289–300. doi:10.1111/j.2517-6161.1995.tb02031.x.
- Boya, P., and G. Kroemer. 2008. “Lysosomal Membrane Permeabilization in Cell Death.” Oncogene 27 (50): 6434–6451. doi:10.1038/onc.2008.310.
- Bushell, M., S. Beauchemin, F. Kunc, D. Gardner, J. Ovens, F. Toll, D. Kennedy, et al. 2020. “Characterization of Commercial Metal Oxide Nanomaterials: Crystalline Phase, Particle Size and Specific Surface Area.” Nanomaterials 10 (9): 1812. doi:10.3390/nano10091812.
- Cho, W., R. Duffin, S. Howie, C. Scotton, W. Wallace, W. MacNee, M. Bradley, I. Megson, and K. Donaldson. 2011. “Progressive Severe Lung Injury by Zinc Oxide Nanoparticles; the Role of Zn2+ Dissolution inside Lysosomes.” Particle and Fibre Toxicology 8 (1): 27. doi:10.1186/1743-8977-8-27.
- Cho, W., R. Duffin, F. Thielbeer, M. Bradley, I. Megson, W. MacNee, C. Poland, C. Tran, and K. Donaldson. 2012. “Zeta Potential and Solubility to Toxic Ions as Mechanisms of Lung Inflammation Caused by Metal/Metal Oxide Nanoparticles.” Toxicological Sciences 126 (2): 469–477. doi:10.1093/toxsci/kfs006.
- Costa, P., I. Gosens, A. Williams, L. Farcal, D. Pantano, D. Brown, V. Stone, F. Cassee, S. Halappanavar, and B. Fadeel. 2018. “Transcriptional Profiling Reveals Gene Expression Changes Associated with Inflammation and Cell Proliferation following Short-Term Inhalation Exposure to Copper Oxide Nanoparticles.” Journal of Applied Toxicology 38 (3): 385–397. doi:10.1002/jat.3548.
- Daugaard, M., M. Rohde, and M. Jäättelä. 2007. “The Heat Shock Protein 70 Family: Highly Homologous Proteins with Overlapping and Distinct Functions.” FEBS Letters 581 (19): 3702–3710. doi:10.1016/j.febslet.2007.05.039.
- de Planque, M., S. Aghdaei, T. Roose, and H. Morgan. 2011. “Electrophysiological Characterization of Membrane Disruption by Nanoparticles.” ACS Nano 5 (5): 3599–3606. doi:10.1021/nn103320j.
- Decan, N., D. Wu, A. Williams, S. Bernatchez, M. Johnston, M. Hill, and S. Halappanavar. 2016. “Characterization of in Vitro Genotoxic, Cytotoxic and Transcriptomic Responses following Exposures to Amorphous Silica of Different Sizes.” Mutation Research. Genetic Toxicology and Environmental Mutagenesis 796: 8–22. doi:10.1016/j.mrgentox.2015.11.011.
- Foster, K., M. Yazdanian, and K. Audus. 2001. “Microparticulate Uptake Mechanisms of in-Vitro Cell Culture Models of the Respiratory Epithelium.” The Journal of Pharmacy and Pharmacology 53 (1): 57–66. doi:10.1211/0022357011775190.
- Gawande, M., A. Goswami, F. Felpin, T. Asefa, X. Huang, R. Silva, X. Zou, R. Zboril, and R. Varma. 2016. “Cu and Cu-Based Nanoparticles: Synthesis and Applications in Catalysis.” Chemical Reviews 116 (6): 3722–3811. doi:10.1021/acs.chemrev.5b00482.
- Gosens, I., F. Cassee, M. Zanella, L. Manodori, A. Brunelli, A. Costa, B. Bokkers, et al. 2016. “Organ Burden and Pulmonary Toxicity of Nano-Sized Copper (II) Oxide Particles after Short-Term Inhalation Exposure.” Nanotoxicology 10 (8): 1084–1095. doi:10.3109/17435390.2016.1172678.
- Grigore, M., E. Biscu, A. Holban, M. Gestal, and A. Grumezescu. 2016. “Methods of Synthesis, Properties and Biomedical Applications of CuO Nanoparticles.” Pharmaceuticals 9 (4): 75. doi:10.3390/ph9040075.
- Halappanavar, S., L. Rahman, J. Nikota, S. Poulsen, Y. Ding, P. Jackson, H. Wallin, O. Schmid, U. Vogel, and A. Williams. 2019. “Ranking of Nanomaterial Potency to Induce Pathway Perturbations Associated with Lung Responses.” Nanoimpact 14: 100158. doi:10.1016/j.impact.2019.100158.
- Halappanavar, S., A. Saber, N. Decan, K. Jensen, D. Wu, N. Jacobsen, C. Guo, et al. 2015. “Transcriptional Profiling Identifies Physicochemical Properties of Nanomaterials That Are Determinants of the in Vivo Pulmonary Response.” Environmental and Molecular Mutagenesis 56 (2): 245–264. doi:10.1002/em.21936.
- Hristozov, D., L. Pizzol, G. Basei, A. Zabeo, A. Mackevica, S. Hansen, I. Gosens, et al. 2018. “Quantitative Human Health Risk Assessment along the Lifecycle of Nano-Scale Copper-Based Wood Preservatives.” Nanotoxicology 12 (7): 747–765. doi:10.1080/17435390.2018.1472314.
- Hufnagel, M., S. Schoch, J. Wall, B. Strauch, and A. Hartwig. 2020. “Toxicity and Gene Expression Profiling of Copper- and Titanium-Based Nanoparticles Using Air-Liquid Interface Exposure.” Chemical Research in Toxicology 33 (5): 1237–1249. doi:10.1021/acs.chemrestox.9b00489.
- Ivask, A., K. Scheckel, P. Kapruwan, V. Stone, H. Yin, N. Voelcker, and E. Lombi. 2017. “Complete Transformation of ZnO and CuO Nanoparticles in Culture Medium and Lymphocyte Cells during Toxicity Testing.” Nanotoxicology 11 (2): 150–156. doi:10.1080/17435390.2017.1282049.
- Jacobsen, N., P. White, J. Gingerich, P. Møller, A. Saber, G. Douglas, U. Vogel, and H. Wallin. 2011. “Mutation Spectrum in FE1-MUTATMMouse Lung Epithelial Cells Exposed to Nanoparticulate Carbon Black.” Environmental and Molecular Mutagenesis 52 (4): 331–337. doi:10.1002/em.20629.
- Jeong, J., S. Kim, S. Lee, D. Lee, Y. Han, S. Jeon, and W. Cho. 2018. “Differential Contribution of Constituent Metal Ions to the Cytotoxic Effects of Fast-Dissolving Metal-Oxide Nanoparticles.” Frontiers in Pharmacology 9: 15. doi:10.3389/fphar.2018.00015.
- Karlsson, H. L., P. Cronholm, J. Gustafsson, and L. Möller. 2008. “Copper Oxide Nanoparticles Are Highly Toxic: A Comparison between Metal Oxide Nanoparticles and Carbon Nanotubes.” Chemical Research in Toxicology 21 (9): 1726–1732. doi:10.1021/tx800064j.
- Kerr, K., and G. Churchill. 2001. “Experimental Design for Gene Expression Microarrays.” Biostatistics 2 (2): 183–201. doi:10.1093/biostatistics/2.2.183.
- Labib, S., A. Williams, C. Guo, K. Leingartner, V. Arlt, H. Schmeiser, L. Yauk, C. A. P. White, and S. Halappanavar. 2016. “Comparative Transcriptomic Analyses to Scrutinize the Assumption That Genotoxic PAHs Exert Effects via a Common Mode of Action.” Archives of Toxicology 90 (10): 2461–2480. doi:10.1007/s00204-015-1595-5.
- Laha, D., A. Pramanik, J. Maity, A. Mukherjee, P. Pramanik, A. Laskar, and P. Karmakar. 2014. “Interplay between Autophagy and Apoptosis Mediated by Copper Oxide Nanoparticles in Human Breast Cancer Cells MCF7.” Biochimica et Biophysica Acta 1840 (1): 1–9. doi:10.1016/j.bbagen.2013.08.011.
- Lai, X., Y. Wei, H. Zhao, S. Chen, X. Bu, F. Lu, D. Qu, L. Yao, J. Zheng, and J. Zhang. 2015. “The Effect of Fe2O3 and ZnO Nanoparticles on Cytotoxicity and Glucose Metabolism in Lung Epithelial Cells.” Journal of Applied Toxicology 35 (6): 651–664. doi:10.1002/jat.3128.
- Lai, X., H. Zhao, Y. Zhang, K. Guo, Y. Xu, S. Chen, and J. Zhang. 2018. “Intranasal Delivery of Copper Oxide Nanoparticles Induces Pulmonary Toxicity and Fibrosis in C57BL/6 Mice.” Scientific Reports 8 (1): 4499. doi:10.1038/s41598-018-22556-7.
- Leroueil, P., S. Berry, K. Duthie, G. Han, V. Rotello, D. McNerny, J. Baker, B. Orr, and M. Banaszak Holl. 2008. “Wide Varieties of Cationic Nanoparticles Induce Defects in Supported Lipid Bilayers.” Nano Letters 8 (2): 420–424. doi:10.1021/nl0722929.
- Midander, K., P. Cronholm, H. Karlsson, K. Elihn, L. Möller, C. Leygraf, and I. Wallinder. 2009. “Surface Characteristics, Copper Release, and Toxicity of Nano- and Micrometer-Sized Copper and Copper(II) Oxide Particles: A Cross-Disciplinary Study.” Small 5 (3): 389–399. doi:10.1002/smll.200801220.
- Mirshafiee, V., B. Sun, C. Chang, Y. Liao, W. Jiang, J. Jiang, X. Liu, X. Wang, T. Xia, and A. Nel. 2018. “Toxicological Profiling of Metal Oxide Nanoparticles in Liver Context Reveals Pyroptosis in Kupffer Cells and Macrophages versus Apoptosis in Hepatocytes.” ACS Nano 12 (4): 3836–3852. doi:10.1021/acsnano.8b01086.
- Moschini, E., M. Gualtieri, M. Colombo, U. Fascio, M. Camatini, and P. Mantecca. 2013. “The Modality of Cell-Particle Interactions Drives the Toxicity of Nanosized CuO and TiO2 in Human Alveolar Epithelial Cells.” Toxicology Letters 222 (2): 102–116. doi:10.1016/j.toxlet.2013.07.019.
- Ndika, J., M. Ilves, I. M. Kooter, M. Gröllers‐Mulderij, E. Duistermaat, P. C. Tromp, F. Kuper, et al. 2020. “Mechanistic Similarities between 3D Human Bronchial Epithelium and Mice Lung, Exposed to Copper Oxide Nanoparticles, Support Non‐Animal Methods for Hazard Assessment.” Small 16 (36): 2000527. doi:10.1002/smll.202000527.
- Organization for Economic Co-operation and Development. 1995. Test No. 105: Water Solubility. OECD Guidelines for the Testing of Chemicals. Section 1. Paris, France: OECD Publishing.
- Prohaska, J. 2008. “Role of Copper Transporters in Copper Homeostasis.” The American Journal of Clinical Nutrition 88 (3): 826S–829S. doi:10.1093/ajcn/88.3.826S.
- Rahman, L., D. Wu, M. Johnston, A. William, and S. Halappanavar. 2017. “Toxicogenomics Analysis of Mouse Lung Responses following Exposure to Titanium Dioxide Nanomaterials Reveal Their Disease Potential at High Doses.” Mutagenesis 32 (1): 59–76. doi:10.1093/mutage/gew048.
- Schulz, M., A. Olubummo, and W. Binder. 2012. “Beyond the Lipid-Bilayer: Interaction of Polymers and Nanoparticles with Membranes.” Soft Matter 8 (18): 4849. doi:10.1039/c2sm06999g.
- Searle, S., F. Speed, and G. Milliken. 1980. “Population Marginal Means in the Linear Model: An Alternative to Least Squares Means.” The American Statistician 34 (4): 216–221. doi:10.2307/2684063.
- Semisch, A., J. Ohle, B. Witt, and A. Hartwig. 2014. “Cytotoxicity and Genotoxicity of Nano - and Microparticulate Copper Oxide: Role of Solubility and Intracellular Bioavailability.” Particle and Fibre Toxicology 11 (1): 10. doi:10.1186/1743-8977-11-10.
- Singh, S., T. Shi, R. Duffin, C. Albrecht, D. van Berlo, D. Höhr, B. Fubini, et al. 2007. “Endocytosis, Oxidative Stress and IL-8 Expression in Human Lung Epithelial Cells upon Treatment with Fine and Ultrafine TiO2: Role of the Specific Surface Area and of Surface Methylation of the Particles.” Toxicology and Applied Pharmacology 222 (2): 141–151. doi:10.1016/j.taap.2007.05.001.
- Sisler, J., R. Li, W. McKinney, R. Mercer, Z. Ji, T. Xia, X. Wang, et al. 2015. “Differential Pulmonary Effects of CoO and La2O3 Metal Oxide Nanoparticle Responses during Aerosolized Inhalation in Mice.” Particle and Fibre Toxicology 13 (1): 42. doi:10.1186/s12989-016-0155-3.
- Poulsen, S. S., N. Jacobsen, S. Labib, D. Wu, M. Husain, A. Williams, P. Bøgelund, et al. 2013. “Transcriptomic Analysis Reveals Novel Mechanistic Insight into Murine Biological Responses to Multi-Walled Carbon Nanotubes in Lungs and Cultured Lung Epithelial Cells.” PLoS One 8 (11): e80452. doi:10.1371/journal.pone.0080452.
- Poulsen, S. S., A. T. Saber, A. Williams, O. Andersen, C. Købler, R. Atluri, M. E. Pozzebon, et al. 2015. “MWCNTs of Different Physicochemical Properties Cause Similar Inflammatory Responses, but Differences in Transcriptional and Histological Markers of Fibrosis in Mouse Lungs.” Toxicology and Applied Pharmacology 284 (1): 16–32. doi:10.1016/j.taap.2014.12.011.
- Strauch, B., W. Hubele, and A. Hartwig. 2020. “Impact of Endocytosis and Lysosomal Acidification on the Toxicity of Copper Oxide Nano- and Microsized Particles: Uptake and Gene Expression Related to Oxidative Stress and the DNA Damage Response.” Nanomaterials 10 (4): 679. doi:10.3390/nano10040679.
- Strauch, B., R. Niemand, N. Winkelbeiner, and A. Hartwig. 2017. “Comparison between Micro- and Nanosized Copper Oxide and Water Soluble Copper Chloride: Interrelationship between Intracellular Copper Concentrations, Oxidative Stress and DNA Damage Response in Human Lung Cells.” Particle and Fibre Toxicology 14 (1): 28. doi:10.1186/s12989-017-0209-1.
- Sun, T., Y. Yan, Y. Zhao, F. Guo, and C. Jiang. 2012. “Copper Oxide Nanoparticles Induce Autophagic Cell Death in A549 Cells.” PLoS One 7 (8): e43442. doi:10.1371/journal.pone.0043442.
- Titma, T., R. Shimmo, J. Siigur, and A. Kahru. 2016. “Toxicity of Antimony, Copper, Cobalt, Manganese, Titanium and Zinc Oxide Nanoparticles for the Alveolar and Intestinal Epithelial Barrier Cells in Vitro.” Cytotechnology 68 (6): 2363–2377. doi:10.1007/s10616-016-0032-9.
- Tossavainen, A. 1976. “Metal Fumes in Foundries.” Scandinavian Journal of Work, Environment & Health 2 (1): 42–49. doi:10.5271/sjweh.2833.
- Vance, M., T. Kuiken, E. Vejerano, S. McGinnis, M. Hochella, D. Rejeski, and M. Hull. 2015. “Nanotechnology in the Real World: Redeveloping the Nanomaterial Consumer Products Inventory.” Beilstein Journal of Nanotechnology 6: 1769–1780. doi:10.3762/bjnano.6.181.
- White, P., G. Douglas, J. Gingerich, C. Parfett, P. Shwed, V. Seligy, L. Soper, et al. 2003. “Development and Characterization of a Stable Epithelial Cell Line from Muta Mouse Lung.” Environmental and Molecular Mutagenesis 42 (3): 166–184. doi:10.1002/em.10185.
- Wongrakpanich, A., I. Mudunkotuwa, S. Geary, A. Morris, K. Mapuskar, D. Spitz, V. Grassian, and A. Salem. 2016. “Size-Dependent Cytotoxicity of Copper Oxide Nanoparticles in Lung Epithelial Cells.” Environmental Science. Nano 3 (2): 365–374. doi:10.1039/C5EN00271K.
- Wu, H., K. Kerr, X. Cui, and G. Churchill. 2003. “MAANOVA: A Software Package for the Analysis of Spotted cDNA Microarray Experiments.” In The Analysis of Gene Expression Data. Statistics for Biology and Health, edited by G. Parmigiani, E. Garrett, R. Irizarry and S. Zeger, 314–341. New York, NY: Springer.
- Zhang, H., Z. Ji, T. Xia, H. Meng, C. Low-Kam, R. Liu, S. Pokhrel, et al. 2012. “Use of Metal Oxide Nanoparticle Band Gap to Develop a Predictive Paradigm for Oxidative Stress and Acute Pulmonary Inflammation.” ACS Nano 6 (5): 4349–4368. doi:10.1021/nn3010087.
- Zhang, J., Z. Zou, B. Wang, G. Xu, Q. Wu, Y. Zhang, Z. Yuan, X. Yang, and C. Yu. 2018. “Lysosomal Deposition of Copper Oxide Nanoparticles Triggers HUVEC Cells Death.” Biomaterials 161: 228–239. doi:10.1016/j.biomaterials.2018.01.048.
- Zhu, Y., J. Eaton, and C. Li. 2012. “Titanium Dioxide (TiO2) Nanoparticles Preferentially Induce Cell Death in Transformed Cells in a Bak/Bax-Independent Fashion.” PLoS One 7 (11): e50607. doi:10.1371/journal.pone.0050607.