
Abstract
The ECETOC NanoApp was developed to support industry in the registration of sets of nanoforms, as well as regulators in the evaluation of these registration dossiers. The ECETOC NanoApp uses a systematic approach to create and justify sets of similar nanoforms, following the ECHA guidance in a transparent and evidence-based manner. The rational and decision rules behind the ECETOC NanoApp are described in detail in “Janer, G., R. Landsiedel, and W. Wohlleben. 2021. [Rationale and Decision Rules Behind the ECETOC NanoApp to Support Registration of Sets of Similar Nanoforms within REACH. Nanotoxicology 15 (2): 145–122. https://doi.org/10.1080/17435390.2020.1842933]”. The decision criteria apply to human health and environmental hazards and risks. Here, we focus mostly on human health hazards; the decision rules are applied to a series of case studies, each consisting of real nanoforms: two barium sulfate nanoforms, four colloidal silica nanoforms, eight ceria nanoforms, and four copper phthalocyanine nanoforms. For each of them, we show step by step how the ECETOC NanoApp rules are applied. The cases include nanoforms that are justified as members of the same set of similar nanoforms based on sufficient similarity of their intrinsic properties (Tier 1). They also include other nanoforms with a relatively high (but insufficient) similarity of intrinsic properties; their similarity could be justified by functional properties (Tier 2). The case studies also include nanoforms that are concluded not to belong to the same set of similar nanoforms. These outcomes of the NanoApp were overall consistent (sometimes conservative) with available in vivo data. We also noted that datasets for various nanoforms were limited and use of the NanoApp may require the generation of data relevant to the decision criteria.
1. Introduction
In order to provide advice to registrants preparing registration dossiers that cover nanoforms, ECHA published the “Appendix for nanoforms applicable to the Guidance on Registration and Guidance on Substance Identification”. This guidance explains how to create and justify sets of nanoforms, and details reporting requirements for the registration of either individual nanoforms or sets of nanoforms (ECHA, Citation2019a). A 'set of similar nanoforms' is a group of nanoforms with clearly defined boundaries that allow to conclude that the hazard assessment, exposure assessment and risk assessment of these nanoforms can be performed jointly.
Historically, different initiatives in this area have been launched to group nanomaterials with similar characteristics for the purpose of their evaluation (Burden et al. Citation2017; Giusti et al. Citation2019), among them the German-funded NanoGRAVUR (Wohlleben et al. Citation2019), the ECETOC-funded DF4Nano (Landsiedel et al. Citation2017; Gajewicz et al. Citation2018) and the European-funded projects NANOSOLUTIONS (Fadeel et al. Citation2018), MARINA (Oomen et al. Citation2015; Bos et al. Citation2015) and GRACIOUS (Stone et al. Citation2020).
Within an ECETOC project, a tool was developed to support industry in the registration of sets of nanoforms, as well as regulators in the evaluation of these registration dossiers. The ECETOC NanoApp considered the concepts developed in existing grouping frameworks and took them a step forward by developing a systematic approach to create and justify sets of similar nanoforms, following the ECHA guidance in a transparent and evidence-based manner.
The rational and decision rules behind the ECETOC NanoApp are described in detail in Janer, Landsiedel, and Wohlleben (Citation2021). The approach is based on pairwise similarity assessments to ensure that each of the nanoforms within a set is sufficiently similar to all other nanoforms within that set. Briefly, the similarity assessment consists of three Tiers (). In the first Tier, similarity is assessed based on thresholds for maximal differences in intrinsic properties (mostly corresponding to those required for REACh registration). If similarity is sufficient for all of the properties considered, nanoforms can be grouped as a set. If not, depending on their level of dissimilarity in intrinsic properties, it is concluded either that they cannot be included into the same set (if differences of intrinsic properties are large) or that a Tier 2 assessment is needed (if differences of intrinsic properties are small, but above the thresholds set in Tier 1). In the second Tier, additional data are required to assess whether nanoforms are similar based on their functionality (extrinsic properties) and can it hence be justified to group them in the same set. In rare cases a repeated-dose short-term in vivo inhalation study (STIS, Landsiedel, Gamo, and Hirose Citation2019; Jeon, Yi, and Yu Citation2019) may be required as a third Tier. In some scenarios, a wider dissimilarity can be accepted in a set of similar nanoforms, as long as the worst-case nanoform is selected as representative of the whole set for testing to fill in information requirements in REACh.
Figure 1. Tiered approach for building and justification of sets of nanoforms. Properties considered in different Tiers are listed. The expected association between Tier 2/3 properties and exposure, fate, toxicokinetics, toxicity and ecotoxicity is indicated in dark gray (strong/direct), and light gray (for weaker/indirect).
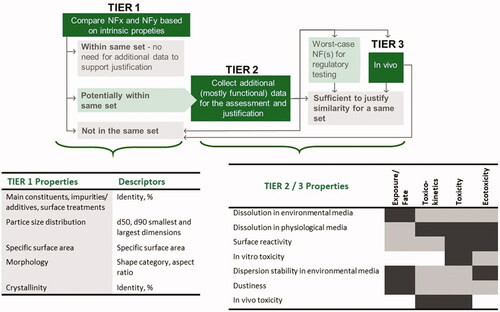
Tier 2 properties were selected, depending on the Tier 1 property not reaching sufficient similarity (see Janer, Landsiedel, and Wohlleben Citation2021 for details), and considering the need to evaluate potential impacts in nanoform exposure, toxicokinetics, human toxicity, fate, and ecotoxicity and ultimate risk to environment and humans ().
The case studies presented here, focus mostly on hazard to human health especially by inhalation exposure.
This is a follow-up manuscript that illustrates how the decision rules are applied to a series of real materials that are considered for grouping into sets of nanoforms.
2. The case studies
Four case studies are presented, each consisting of different nanoforms of a substance (). Similarity across the nanoforms in each of these case studies is evaluated following the rules of the ECETOC NanoApp. The descriptors used in the assessment and the outcomes of the evaluations are provided for each of the relevant Tiers of the ECETOC NanoApp. And the conclusion on the possibility to group any of the nanoforms into a set of similar nanoforms is presented.
Table 1. Overview of the case studies and nanoforms included.
Most of the characterization data for the nanoforms in these case studies had already been published earlier (see references in ). Additional data analyses were conducted to generate the size percentiles needed for the assessment (d50 and d90) as well as the aspect ratios. The methodology for size percentiles can be derived from the NanoDefine Method Manual (Mech et al. Citation2020). Since the methods differ in the metric of the size distribution, and considering that any metrics conversion may distort the comparison between NFs, we chose to use only TEM for powders, and only Analytical Ultracentrifugation for colloidal silica, in accord with the Methods Manual. The size percentile data was not required by national inventories (French decree 2012/232 or Belgian Royal Decree of 27 May 2014), and was not routinely reported, but the NanoDefine algorithms generate raw data that can be exploited for this purpose. These data are now also needed of the REACh registration of nanoforms (2018/1881) since January 2020 and have also to be reported in SDS since January 2021 for an appropriate description. For some of the case studies, the materials were also tested in different functional assays to complete the data matrix needed for the assessments. Test methods used are described in the supplementary material (see Supplementary Material Section 1).
2.1. Barium sulfate nanoforms
Two barium sulfate nanoforms are included in this case study. One of the nanoforms corresponds to NM-220 Barium sulfate NPs (NF1), a reference material for the Nanomaterial Testing Sponsorship Program of the OECD. The second nanoform (NF2) was generated in a different production plant using the same synthesis protocol and was used as test material for repeated dose inhalation toxicity studies (Konduru et al. Citation2014).
2.1.1. Potential sets of similar nanoforms according to the ECETOC NanoApp
summarizes the descriptors of these nanoforms that are used to evaluate similarity under Tier 1. The two nanoforms of this case study fulfill all the conditions laid out by the Tier 1 Rules, as a consequence, they can be concluded to belong to a same set of similar nanoforms.
Table 2. Tier 1 similarity conclusions for BaSO4 nanoforms.
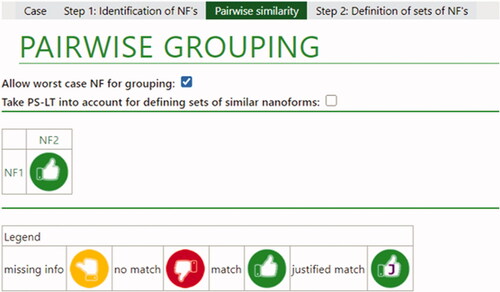
The results for the pairwise comparisons for the barium sulfate materials as presented by the ECETOC NanoApp is shown in .
Figure 2. Overall conclusions for barium sulfate nanoforms. The green thumb indicates that a match was possible based on limited differences in intrinsic properties. If a Tier 2 justification had been needed, a ‘J’ would be present in the green thumb, as indicated in the legend for a justified match.
2.1.2. Hazard data available to evaluate adequacy of the outcome of the ECETOC NanoApp conclusion
Barium sulfate NF1 was evaluated in the short-term inhalation study (STIS) protocol (Landsiedel et al. Citation2014; Klein et al. Citation2012), whereas Barium sulfate NF2 was used in 4-week, 13-week (Konduru et al. Citation2014; Schwotzer et al. Citation2017), and 2-year repeated dose toxicity studies (Tentschert et al. Citation2020). In all studies the aerosol particles were in the respirable range with an MMAD <3 µm.
A common dose of 50 mg/m3 was used in the STIS (5-day), 4- and 13-week studies. Beyond the differences in exposure duration, the exposure pattern and evaluations were mostly the same. Measured lung deposition for NF1 and NF2 was consistent (considering the moderate increase in measured lung deposition between 4 and 13 weeks for NF2). Lung clearance for NF1 and NF2 was also similar (77% in 21 days versus 95% in 34 days, respectively; equivalent to half-times of 9.9 and 7.9 days, respectively). Also, in terms of adverse effects in the lungs the pattern observed in these three studies support the similarity of the two tested nanoforms. No adverse histopathological findings were recorded for NF1 (5-day study) and for NF2 in the 4-week study. The slightly elevated values for BALF neutrophils and some biochemical markers observed for NF1 after 5-day exposure, did not reach statistical significance when compared to the controls, but are consistent with the minimal increases in BALF cell counts and biochemical markers in the 4-week study for the NF2. In general, these responses increased after 13-week exposure, further supporting that exposure duration rather than material differences, explained the minimal but somehow higher response in the 4-week study with NF2 when compared to the STIS with NF1 nanoform (see Supplementary Material for further details on these studies). Therefore, these data are consistent with the conclusion of the ECETOC NanoApp that considers that these two nanoforms could be grouped into the same set of similar nanoforms.
2.2. Silica nanoforms
Spheroidal colloidal silica nanoforms used in this case study are not covered by the REACh dossier for Synthetic Amorphous Silica based on their different production process involving the aggregation route better known as Stöber sols. Four Stöber spheroidal colloidal silica nanoforms are included in this case study. These consist of nanoforms differing mostly in their particle size and their specific surface area. Colloidal silica following the resin and autoclave production routes are REACH registered forms and also called colloidal silica.
2.2.1. Potential sets of similar nanoforms according to the ECETOC NanoApp
summarizes the descriptors of these nanoforms that are used to evaluate similarity under Tier 1. None of the combinations for the four nanoforms of this case study fulfill all the conditions laid out by the Tier 1 Rules. Differences in at least one of the size descriptors and/or in specific surface area are larger than the Tier 1 thresholds for all possible combination of these nanoforms. In fact, for some of the pairwise assessments, the differences in these intrinsic properties are so large that they lead to a definite conclusion that they cannot be grouped into the same set of similar nanoforms (see ‘red’ outcomes for size or specific surface area –SSA– in ). For other nanoforms comparisons, differences in size descriptors and SSA are not as high, and the possibility to be grouped into a same set of similar nanoforms exists (see ‘yellow’ outcomes for size or SSA in ) and depends on the outcomes of the functional assays required under the Tier 2 assessment.
Table 3. Tier 1 similarity conclusions for colloidal silica nanoforms.
Table 4. Tier 2 similarity conclusions in relation to size and specific surface area for colloidal silica nanoforms.
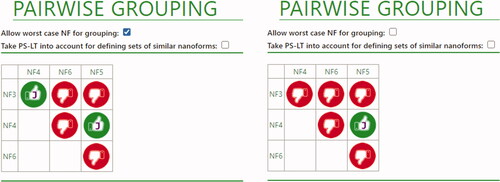
The functional assays performed are summarized in . The results of the environmental dissolution tests would imply that when grouping NF3 in a set with any of the other silicas, that of the smallest size would need to be selected as representative nanoform for further regulatory testing. Reactivity data obtained from the FRAS assay would preclude grouping of NF3 with NF5, and both reactivity and in vitro toxicity data would preclude grouping of NF3 with NF6. These combinations were in fact already excluded due to the differences in size descriptors and specific surface area. Grouping of NF6 with any of the other silicas is also prevented due to differences in their d50 values for size. Altogether, the data on the functional assays, support the formation of a set of nanoforms with NF3 and NF4 (with the condition that NF4 is selected as worst-case representative of the set for regulatory testing), or a set of nanoforms with NF4 and NF5. The overall results for the pairwise comparisons for the silica materials as presented by the ECETOC NanoApp are shown in . Note that the combination of NF3 and NF4 is only possible when the user accepts to use the worst-case NF for further regulatory testing (left panel).
Figure 3. Overall conclusions for silica nanoforms. Left: allowing worst-case NF for grouping; Right: not allowing worst-case NF for grouping. Red thumbs indicate a definite no-match. In this case, this is due to differences in size descriptors and SSA. Green thumbs with a ‘J’ indicate that a match is possible, due to the moderate differences in intrinsic properties, which do not result on relevant differences in functional properties.
2.2.2. Additional toxicological data available to evaluate adequacy of the outcome of the ECETOC NanoApp conclusion
NF3 and NF5 have been tested in an intratracheal instillation study (Maser et al. Citation2015; Wiemann et al. Citation2018). Toxicological responses were qualitatively similar, but the smaller NF5 nanoform induced more pronounced effects than the larger NF3 nanoform.
An increase in polymorphonuclear neutrophils and lymphocytes in BALF was observed for both materials, but more pronounced in the case of NF5. Elevated total protein levels and enzymatic activities for LDH and ALP were also observed for both materials, with higher values in the case of NF5, for which also GGT and NAG were increased. Increases in lung and spleen weights, and in neutrophil counts in blood were only observed in the case of NF5 (Wiemann et al. Citation2018). A mild multifocal granulomatous inflammation with thickening of the alveolar walls was observed for NF3, with increased severity in the case of NF5. In addition, enlarged lymph nodes and lymphoreticular hyperplasia of the mediastinal lymph nodes was observed for NF5 (Maser et al. Citation2015). None of these two materials induced genotoxic effects in treated rats, evaluated by means of the Alkaline Comet assay in lung cells, and the relevant genotoxic effects were observed in the lung cells and the micronucleus tests in bone marrow cells (Maser et al. Citation2015).
The conclusion of the ECETOC NanoApp is that these two materials would not belong to a same set of nanoforms and is consistent with the different potency observed in these intratracheal studies for these two materials. It is, however, challenging to predict to which extent these differences in potency (not in type of adverse effects) would have translated into different dose levels in repeated dose inhalation toxicity studies. Inhalation leads to a more evenly distributed lung exposure compared to instillation (Pritchard et al. Citation1985), which may affect clearance mechanisms (Osier and Oberdörster, Citation1997). In addition, the instillation method by itself may induce inflammation responses that are otherwise not observed after inhalation, and generally more severe lesions are induced after instillation when compared to inhalation (ECETOC TR 122).
The four spheroidal colloidal silica in the case study gradually differed in size and specific surface area. Therefore, it is to be expected that the other two nanoforms (NF4 and NF6) would also have induced similar responses, with gradual differences in potency. In vitro toxicity studies with these four materials support such gradual differences in toxicity (Wiemann et al. Citation2018). The ECETOC NanoApp concluded that NF4 and NF5 could be grouped, and that NF3 and NF4 could also be grouped, as long as NF4 would be selected as representative material for further regulatory testing. In both cases, it can be assumed that differences between these pairs of nanoforms would be considerably lower than those observed in the intratracheal studies described above. The identification of NF4 (smaller than NF3) as worst-case nanoform for this second potential set of similar nanoforms is also consistent with the outcomes of the described intratracheal studies. In the case of NF4 and NF5, the need to pre-select a worst-case nanoform for testing was not triggered, due to lower differences in dissolution values. The fact that differences in most functional assays were smaller for the combination of NF4 and NF5 than for the combination of NF3 and NF4, also supports their higher similarity.
2.3. Cerium dioxide nanoforms
Eight cerium dioxide nanoforms are included in this case study. These consist of nanoforms differing in their production process (precipitation versus pyrolytic), impurities, size and specific surface area. Currently, only the CeO2 nanoforms produced by the precipitation process are covered by the REACh dossier.
2.3.1. Potential sets of similar nanoforms according to the ECETOC NanoApp
summarizes the descriptors of these nanoforms that are used to evaluate similarity under Tier 1. Two potential sets of similar nanoforms are directly derived from Tier 1 rules. These correspond to a first set including NF7 and NF8, and a second set including NF9, NF10, and NF11. The remaining combinations of nanoforms require assessment with Tier 2 rules, except one of the nanoforms (NF14), which cannot be grouped with another nanoform into a set due to its content of impurities.
Table 5. Tier 1 similarity conclusions for ceria nanoforms.
As shows in , some combinations become excluded as potential sets of nanoforms just by looking at the rules for size descriptors. Particularly, NF13 cannot be grouped with NF12, NF7 and NF8 because the ratio between their corresponding size percentiles is above 3, a variation that is not accepted when one of the nanoforms has d50 size percentile below 10 nm. The conclusion for the remaining combinations of nanoforms would then depend on the values of the functional assays necessary to justify the no-match for Tier 1 rules in relation to production process (environmental dispersion stability and dustiness), as well as size and specific surface area (dissolution, reactivity, in vitro toxicity, and dispersion stability).
Table 6. Tier 2 similarity conclusions for ceria nanoforms.
Although the available data matrix is not complete, it allows to already exclude grouping of some materials due to their differences in dispersion stability and dustiness. Thus, the three pyrolytic materials for which all the data was available (NF9, NF10 and NF11) could not be grouped with the precipitated NF12. In addition, also due to differences in dispersion stability, it would not be possible to add any of the remaining pyrolytic materials (NF9, NF10 and NF11) to the set formed already under Tier 1 conditions by NF7 and NF8. For other material combinations (i.e., potential grouping of NF7 and NF8 with NF12), in vitro toxicity in macrophages and dustiness data would still be required to conclude.
Although the NanoApp excluded grouping of NF14 with other nanoforms based on Tier 1 properties. Some Tier 2 data are available for this material and, for completeness, are also presented in . In the hypothetical event that this material had matched Tier 1 conditions, the differences in the (partly available) in vitro toxicity data and/or surface reactivity would have precluded its grouping with at least NF7, NF8, NF10, NF12 and NF13.
The overall results for the pairwise comparisons for the ceria materials as presented by the ECETOC NanoApp is shown in and .
Figure 4. Overall conclusions for ceria nanoforms. Red thumbs indicate a definite no-match. In this case, this is due to differences in size descriptors, or results of some of the functional assays (dispersion stability and dustiness). Green thumbs (without a ‘J’) indicate that a match is possible due because Tier 1 conditions are fulfilled. Yellow thumbs indicate that a definite conclusion still depends on the data that has not been provided (in this case from functional assays).
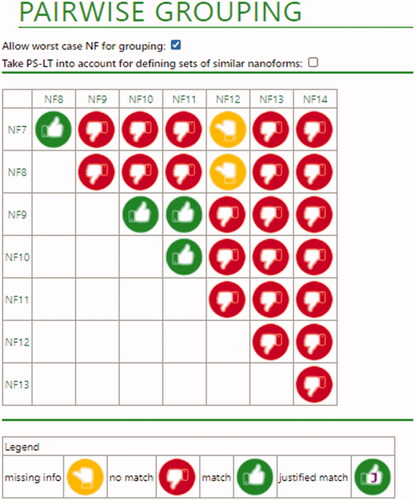
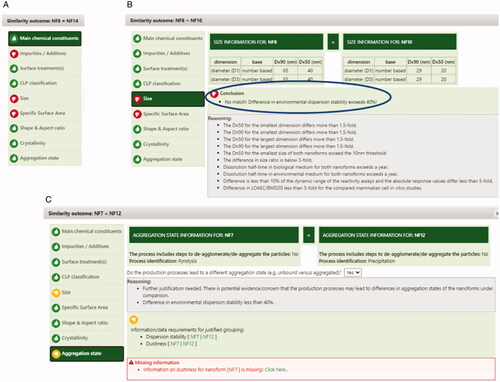
Figure 5. Illustrative screenshots on how the ECETOC NanoApp summarizes the reasons for the overall conclusions for some NF comparisons. Red thumbs on specific parameters indicate a definite no-match, whereas yellow thumbs on specific parameters indicate missing information. A) Impurities, size and specific surface area do not allow grouping of NF8 and NF14 (NFs identified in the table heading). B) Size and specific surface area do not allow grouping of NF8 and NF10, the panel on the right (blue oval) describes that environmental dispersion stability, needed to justify lack of impact of differences in size, resulted in excessive differences between NF8 and NF10. C) Size and aggregation state provisionally prevent grouping of NF7 and NF12. If missing data gaps would be addressed (i.e., dustiness for NF7, as indicated in the red box at the bottom with ‘Missing information’), such grouping might become possible.
This paragraph describes a hypothetical situation that does not apply in this real case study, but that helps the reader understanding how the in vivo short term inhalation data could be used in the NanoApp. In the case described above, if the d90 values for NF12 and NF13 would have been within the 3-fold threshold, their grouping would have been possible, with two possible ways to proceed: either taking NF13 for regulatory testing (as worst-case representative), or conducting short-term inhalation toxicity studies to evaluate relative differences between these two materials. Such studies should have evaluated toxicity, organ burdens and lung clearance. There are in fact STIS available for these two materials (Keller et al. Citation2014; described further down in subsection a). These would have partly supported similarity of these nanoforms in terms of toxicological outcomes (similar LOAELs), but would not have sufficed by themselves because they did not evaluate systemic biodistribution. Systemic biodistribution was evaluated in 4-week studies with these nanoforms and showed no relevant differences (Geraets et al. Citation2012), so it could be assumed that this would also have been the outcome in the STIS.
2.3.2. Additional data available to evaluate adequacy of the outcome of the ECETOC NanoApp conclusion
NF8, NF12, NF13, and NF14 had been tested in STIS (Landsiedel et al. Citation2014; Keller et al. Citation2014). NF7 had been tested in another short-term inhalation study but differing from STIS in overall study design (exposure pattern and evaluations) (Demokritou et al. Citation2013). In addition, NF12, NF13 and a non-nano form of CeO2 (NM-213) had been tested in a 4-week inhalation toxicity study, which mostly followed OECD TG 412, except a reduction of organs selected for pathology (Gosens et al. Citation2014; Geraets et al. Citation2012). NF12, NF13 and the non-nano NM-213 were also tested in a series of standard tests for aquatic toxicity in algae, daphnids, and fish embryos (Hund-Rinke et al. Citation2018). NM-213 had not been included in the case studies above as it is not a nanoform: its mean and SD for ferret size is 615 ± 430 nm and its SSA is 3.7 m2/g. However, for completeness, it is included in the discussion below.
a). Short-term inhalation studies
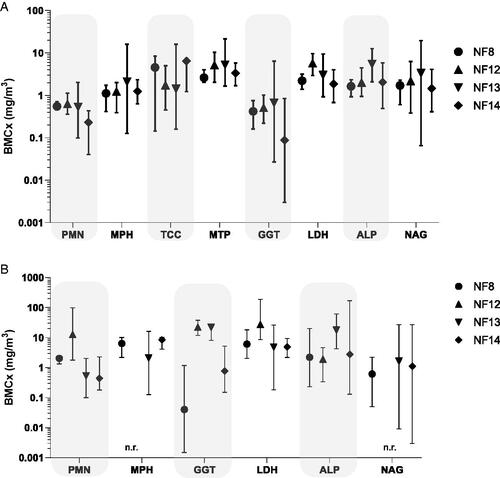
The four nanoforms tested in STIS had a NOAEC below 0.5 mg/m3 and the same type of qualitative responses. The dose–response curves were rather comparable (), and only suggest slight differences in potency with somewhat higher effects (either at the end of the exposure or at the end of the recovery period) in some BALF parameters for NF14> NF8∼NF13> NF12.
Figure 6. Comparison of changes in BALF parameters after 5 days exposure to NF8, NF12, NF13 and NF14. Effects are shown as BMCs using a logarithmic scaling. BMCs were calculated using the benchmark dose software (PROAST, proastweb.rivm.nl, Slob, Citation2002). Critical effect concentrations correspond to the following predetermined changes in the responses over the controls: 400% for PMN, 100% for total protein, LDH, GGT and ALP, and 20% for alveolar macrophages and total cell count. Evaluations 3 days (A) and 24 days (B) after the end of exposure. Data on all parameters were available for all materials at both time points, n.r. denotes the lack of a significant trend in the dataset. Total cell counts and protein levels are not included in (B) as no significant trends were found, except for a slight increase in total protein levels for NF8.
A statistically significant increase in absolute and relative lung weights was recorded at 25 mg/m3 NF13 when compared to the control group (Keller et al. Citation2014). Slightly elevated values were also recorded at the highest dose of NF12 and NF14, although they did not reach statistical significance (Keller et al. Citation2014; Landsiedel et al. Citation2014). The histopathological evaluations showed mostly presence of particles in alveolar macrophages/histiocytes, BALT and/or lymph nodes for all these four materials, which are not considered adverse per se. At the highest dose (25 mg/m3) of NF13 and NF12, alveolar histiocytosis and free eosinophilic granular material with particles, interpreted as remnants of destroyed macrophages and considered as adverse findings, were observed after the exposure period. These mostly regressed after the end of the exposure and only minimal alveolar histiocytosis remained at the second evaluations point (21 days after the end of exposure) (Keller et al. Citation2014). At this evaluation point minimal histiocytosis was also observed in some animals at the medium dose (5 mg/m3) of NF12 and in some animals from all dose groups of NF8 (with increasing incidence and severity with increasing dose). Microscopic findings in the case of NF14 were described as single or aggregated particle-loaded alveolar macrophages. Given that studies were evaluated in different years and by different histopathologists, it is challenging to conclude whether these findings for NF14 are comparable to the histiocytosis reported for other materials. But altogether, considering the differences in doses tested for these four materials (only up to 10 mg/m3 in the case of NF8 and NF14), the incidences and the overall type of effects, these NFs are considered comparable in these short-term inhalation toxicity studies.
NF7 was tested at a single dose level (2.7 mg/m3) that was administered by whole body inhalation for 2 hours/day during 4 consecutive days (Demokritou et al. Citation2013). This would correspond to a dose level of 0.72 mg/m3 in the STIS protocol (6 h/day during 5 consecutive days). Histopathology was not evaluated, and only some cellular (PMN and alveolar macrophages) and biochemical parameters (albumin and LDH) in BALF were reported. The percentage of PMN in BALF was approximately 7.7-fold higher than the levels in the controls, and the LDH values were approximately 2-fold higher than the levels in the controls. No effects on albumin levels or alveolar macrophages counts were observed. The magnitude of the effects observed for PMN would suggest a similar potency to the four ceria materials tested in STIS: the estimated dose that induced a similar response for NF8, NF12, and NF13 in the STIS protocol were in the range of 0.5 to 1 mg/m3. As described above, NF14 had somewhat higher potency than these other NFs, and also when compared to NF7. In the case of LDH, the results were in the range of those for NF8, NF12 and NF13, with estimated values inducing similar effects in the range of 0.2 to 5 mg/m3. Although this inhalation study for NF7 is not directly fully comparable with the STIS studies used for the other nanoforms, the results are compatible with a similar toxicity of all these materials.
b) 4-week inhalation study
Two CeO2 nanoforms (NF12 and NF13) and the non-nano CeO2 NM-213 were tested in the 4-week inhalation study. No clear size- or surface area-related differences on pulmonary deposition and distribution in extrapulmonary tissues were observed, which is explained by similarity in their MMADs generated for animal exposure (Geraets et al. Citation2012). The three nanoforms induced a clear dose-related increase in neutrophile content and biochemical parameters in BALF (ALP, GT, LDH, NAG, and total protein), that were still present after the 28-day recovery period (Gosens et al. Citation2014). BMC values (BMR of 20% or 100%, depending on the parameter) were calculated for LDH, total proteins and PMNs in BALF, and based on mass concentrations, showed that NF13 had the highest toxicity, followed by NF12, and finally NM-213 had the lowest toxicity. Although these parameters indicated the induction of lung inflammation at all dose levels, they were not associated with histopathological evidence of lung tissue damage after the last day of exposure. Microscopic findings common to all the materials were macrophages containing particles in the lungs and tracheobronchial lymph nodes that persisted at the end of the recovery period. In the case of NM-213 and NF12, macrophage/particle aggregates were also found in the trachea and larynx of the animals exposed to the high dose. Increased lung weight and increased septal cellularity was observed in NF12 and NF13 exposed animals (Gosens et al. Citation2014). Therefore, in line with the conclusions from the BMC data for BALF parameters, the microscopic data for lungs also suggests a relative higher toxicity of NF13, followed by NF12, and finally NM-213.
c). Ecotoxicology studies
CeO2 NM-213 (non-nanoform), NF12 and NF13 were tested in a series of standard tests for aquatic toxicity in algae (OECD TG 201), daphnids (OECD TG 202), and fish embryo (OECD TG 236) (Hund-Rinke et al. Citation2018). The EC50 values based on nominal concentrations were above 100 mg/L for the daphnids and fish embryo tests in both materials. Higher toxicity was observed in algae, but there were no statistically significant differences between the EC50 values recorded for the NF13 and NF12: 8.5 (CI 7.7 − 9.3) mg/L and 5.6 (CI 3.0 − 10.4) mg/L, respectively (Hund-Rinke et al. Citation2018). Relatively lower algae toxicity was recorded for NM-213, with an EC50 value of 43.8 mg/L (no confidence intervals were reported; Hund-Rinke et al. Citation2018).
d). Overall conclusions on ceria materials
Available data therefore suggests that NM-213 (beyond the fact that is not a nanoform) should not be grouped in a set of similar nanoforms with any of the other ceria materials, due to its lower toxicity in both rodent inhalation studies and algae. Although the basic characterization data is not complete for this material, the differences in size and SSA by themselves already preclude its grouping with any other nanoform in this case study.
NF12 and NF13 showed similar type of toxicological responses and biodistribution in rat inhalation studies, and similar toxicological potency in aquatic organisms. However, potency in rat inhalation studies was slightly higher for NF13 than for NF12. Therefore, grouping of NF12 and NF13 into a same set of similar nanoforms, might be justified only if NF13 would be used in subsequent toxicological studies for fulfill regulatory data requirements. The ECETOC NanoApp concluded that they could not belong to the same set of similar nanoforms due to differences in their d90 values (3.4-fold), which in this case were not allowed to exceed 3. All the remaining data from intrinsic and functional properties, including in vivo data, would have allowed their grouping into a similar set. However, the fact that NF13 had d50 values below 10 nm combined with the differences in this parameter between the two materials, would have required the choice of NF13 as worst-case representative of this set of similar nanoforms.
NF12 and NF8 showed qualitatively similar responses in the STIS, with only slight differences in potency. Therefore, available data does not clearly support or opposes to the possibility of grouping these nanoforms into a same set of similar nanoforms. The ECETOC NanoApp could also not conclude for these materials, as dustiness and macrophage in vitro studies were not available. All other available data would support their grouping into a set of similar nanoforms.
2.4. Pigment blue 15:3 nanoforms
Four Pigment Blue 15:3 nanoforms (CAS N: 147-14-8) are included in this case study. These consist of organic nanoforms produced through the same process but with slightly different parameters in the synthesis and finishing steps, leading to differences mostly in their particle size, shape, specific surface area, and impurities.
2.4.1. Potential sets of similar nanoforms according to the ECETOC NanoApp
summarizes the descriptors of these nanoforms that are used to evaluate similarity under Tier 1. All the combinations for the four nanoforms of this case study fulfill all the conditions laid out by the Tier 1 Rules. Without any additional data, the user could decide to group all nanoforms into a set. Nevertheless, some additional Tier 2 data presented in which confirmed Tier 1 assessment. The overall results for the pairwise comparisons for the Pigment Blue 15:3 materials as presented by the ECETOC NanoApp is shown in . The justification by Tier 1 is confirmed by the results of the Tier 2, although such confirmation is not required by the NanoApp, and was performed only for validation purposes here: The environmental dispersion stability of the four nanoforms, tested in the OECD GD318 medium selected for the NanoApp (1 mM Ca, pH7, with NOM), remains within the defined range (), as does the abiotic reactivity. The dissolution of all four nanoforms remained below the detection limit of 0.05% (), and is thus no obstacle against registration as a set as well. This confirms that the Tier 1 decision is consistent.
Figure 7. Overall conclusions for Pigment Blue 15:3 nanoforms. Green thumbs indicate that a match is possible due because Tier 1 conditions are fulfilled. Yellow thumbs indicate that a definite conclusion still depends on data that has not been provided (in this case from functional assays in Tier 2).
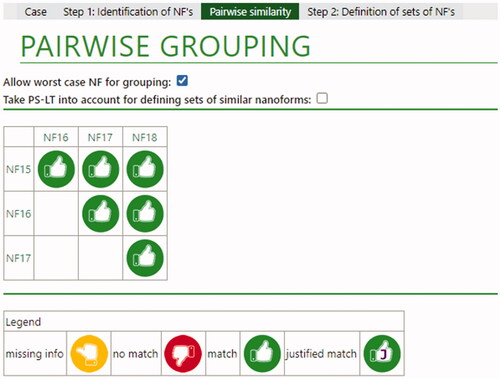
Table 7. Tier 1 similarity conclusions for Pigment Blue 15:3 nanoforms.
Table 8. Tier 2 similarity conclusions for Pigment Blue 15:3 nanoforms.
3. Discussion and conclusions
This manuscript illustrated how the NanoApp works with four different case studies, each consisting of two to eight real nanoforms; it was evaluated whether they could be assembled in sets of similar nanoforms. Data availability was the main criteria used in the selection of the case studies. These examples address a range of variations of nanoforms, but some were not covered: e.g., none of the nanoforms had surface treatments and no nanoforms with mixed crystallinities were included.
The results of the NanoApp were scrutinized for their consistency with results of available in vivo studies. Most of the in vivo data available for these case studies referred to inhalation toxicity studies.
Nanoforms of a single substance which have been investigated in ecotoxicological studies differed considerably in their intrinsic properties, so the NanoApp would usually reject the possibility to group them into a same set of similar nanoforms. This is the case for the three silver nanoforms compared by Hund-Rinke et al. (Citation2018), due to differences in morphology and the three zinc oxide nanoforms compared by Hund-Rinke et al. (Citation2018) due to differences in surface treatments or particle size distribution (based on TEM data from JRC, Singh et al. Citation2011). Also, the five titania nanoforms compared by Schwirn and Völker (Citation2019) were dissimilar due to differences in doping and/or crystallinity. The conclusions of the NanoApp would have been consistent (or in some cases conservative e.g., when comparing the ZnO nanoforms NM-110 and NM-113) with the available ecotoxicity data. Chen et al. (Citation2018) compared the species sensitivity distributions for different variations of nanoforms of silver, and concluded that based on available data, all kinds of silver nanomaterials entering into the environment would share similar maximum acceptable concentrations, regardless of surface coatings, shapes, and sizes. They attributed such similarity partly to the likely physical-chemical transformations in the aquatic media, and partly to the general mechanism of toxicity (toxicity of released Ag ions) shared by all these nanoforms. Some of the nanoforms included in such study might have matched Tier 1 criteria (relatively small variations in size or shape), but most of them would have been excluded from a set based on only their intrinsic properties, a conclusion that in this case would have been overconservative. In several cases, read-across for specific endpoints would still be possible for nanoforms that are considered not suitable to group into a same set of similar nanoforms, but read-across is beyond the scope of the NanoApp.
This study should illustrate the use of the NanoApp and the outcome of assigning real nanoforms to sets of similar nanoforms according to the decision criteria implemented in the NanoApp. It should be noted that these decision criteria are specifications of the guidance provided by ECHA. This study is not a validation of these rules, since much more data would need to be generated for this purpose.
In fact, there are not too many nanoforms of a single substance with openly available data to allow substantiated decisions on their similarity according to these rules. This is one critical learning from this case study: Assembling sets of similar nanoforms requires data on the individual nanoforms and these data may not readily be available but may need to be generated for this purpose. On the other hand, this case study exemplified that if sufficient data are available on nanoforms, the NanoApp helps define sets of similar nanoforms which correspond to the outcome of in vivo toxicity studies or are even more conservative. It is expected that more data on intrinsic and extrinsic properties and hazards of nanoforms become available in the future. That will allow the reevaluation and may trigger adaptations of the decision rules of the NanoApp (and also the rules provided in the ECHA guidance document). Meanwhile, the NanoApp proved to be a useful tool to support assembling and justifying similarity of the nanoforms used in this case study.
Supplemental Material
Download MS Word (33.1 KB)Acknowledgements
The authors acknowledge discussions on case studies and regulatory aspects with Dr. Karin Wiench and discussion of the TEM evaluation with Philipp Mueller, and on in vitro testing with Martin Wiemann. We are grateful for data curation by Emmanuel Ruggiero, and for excellent laboratory support by Tanja Kiessig, Elke Schumacher, Klaus Vilsmeier, Kai Werle and Thorsten Wieczorek. GJ is part of the Emerging Research Group of the ‘Generalitat de Catalunya’ [Ref. 2017 SGR 1759].
Disclosure statement
Didem Ag-Seleci, Robert Landsiedel, Jacques-Aurélien Sergent and Wendel Wohlleben are employees of companies producing and marketing nanomaterials.
Correction Statement
This article has been corrected with minor changes. These changes do not impact the academic content of the article.
Additional information
Funding
References
- Bos, Peter M. J., Stefania Gottardo, Janeck J. Scott-Fordsmand, Martie van Tongeren, Elena Semenzin, Teresa F. Fernandes, Danail Hristozov, et al. 2015. “The MARINA Risk Assessment Strategy: A Flexible Strategy for Efficient Information Collection and Risk Assessment of Nanomaterials.” International Journal of Environmental Research and Public Health 12 (12): 15007–15021. doi:https://doi.org/10.3390/ijerph121214961.
- Burden, Natalie, Karin Aschberger, Qasim Chaudhry, Martin J. D. Clift, Shareen H. Doak, Paul Fowler, Helinor Johnston, et al. 2017. “The 3Rs as a Framework to Support a 21st Century Approach for Nanosafety Assessment.” Nano Today 12: 10–13. doi:https://doi.org/10.1016/j.nantod.2016.06.007.
- Chen, G., W. J. G. M. Peijnenburg, Y. Xiao, and M. G. Vijver. 2018. “Developing Species Sensitivity Distributions for Metallic Nanomaterials considering the Characteristics of Nanomaterials, Experimental Conditions, and Different Types of Endpoints.” Food and Chemical Toxicology: An International Journal Published for the British Industrial Biological Research Association 112: 563–570. doi:https://doi.org/10.1016/j.fct.2017.04.003.
- Demokritou, Philip, Samuel Gass, Georgios Pyrgiotakis, Joel M. Cohen, William Goldsmith, Walt McKinney, David Frazer, et al. 2013. “An In Vivo and In Vitro Toxicological Characterisation of Realistic Nanoscale CeO2 Inhalation Exposures.” Nanotoxicology 7 (8): 1338–1350. doi:https://doi.org/10.3109/17435390.2012.739665.
- ECETOC Technical Report 122. 2013. Poorly Soluble Particles/Lung Overload. Brussels: ECETOC Technical Report 122.
- ECHA. 2019a. Appendix for Nanoforms Applicable to the Guidance on Registration and Substance Identification.
- Fadeel, Bengt, Lucian Farcal, Barry Hardy, Socorro Vázquez-Campos, Danail Hristozov, Antonio Marcomini, Iseult Lynch, et al. 2018. “Advanced Tools for the Safety Assessment of Nanomaterials.” Nature Nanotechnology 13 (7): 537–543. doi:https://doi.org/10.1038/s41565-018-0185-0.
- Gajewicz, Agnieszka, Tomasz Puzyn, Katarzyna Odziomek, Piotr Urbaszek, Andrea Haase, Christian Riebeling, Andreas Luch, et al. 2018. “Decision Tree Models to Classify Nanomaterials According to the DF4nanoGrouping Scheme.” Nanotoxicology 12 (1): 1–17. doi:https://doi.org/10.1080/17435390.2017.1415388.
- Geraets, L., A. G. Oomen, J. D. Schroeter, V. A. Coleman, and F. R. Cassee. 2012. “Tissue Distribution of Inhaled Micro- and Nano-Sized Cerium Oxide Particles in Rats: Results from a 28-Day Exposure Study.” Toxicological Sciences 127 (2): 463–473. doi:https://doi.org/10.1093/toxsci/kfs113.
- Giusti, Anna, Rambabu Atluri, Rositsa Tsekovska, Agnieszka Gajewicz, Margarita D. Apostolova, Chiara L. Battistelli, Eric A. J. Bleeker, et al. 2019. “Nanomaterial Grouping: Existing Approaches and Future Recommendations.” NanoImpact 16: 100182. doi:https://doi.org/10.1093/toxsci/kfs113.
- Gosens, I., L. E. A. M. Mathijssen, B. G. H. Bokkers, H. Muijser, and F. R. Cassee. 2014. “Comparative Hazard Identification of Nano- and Micro-Sized Cerium Oxide Particles Based on 28-Day Inhalation Studies in Rats.” Nanotoxicology 8 (6): 643–653. doi:https://doi.org/10.3109/17435390.2013.815814.
- Hund-Rinke, K., K. Schlich, D. Kühnel, B. Hellack, H. Kaminski, and C. Nickel. 2018. “Grouping Concept for Metal and metal oxide Nanomaterials with Regard to Their Ecotoxicological Effects on Algae, Daphnids and Fish Embryos.” NanoImpact 9: 52–60. doi:https://doi.org/10.1016/j.impact.2017.10.003.
- Janer, G., R. Landsiedel, and W. Wohlleben. 2021. “Rationale and Decision Rules behind the ECETOC NanoApp to Support Registration of Sets of Similar Nanoforms within REACH.” Nanotoxicology 15 (2): 122–145. doi:https://doi.org/10.1080/17435390.2020.1842933.
- Jeon, Ki Soo, Jae Seong Yi, and Il Je Yu. 2019. “Use of Short-Term Inhalation Study to Obtain Initial Hazard Data and Prepare for Subacute and Subchronic Inhalation Studies, and Toxicokinetic Studies." In Vivo Inhalation Toxicity Screening Methods for Manufactured Nanomaterials, 67–77. Singapore: Springer.
- Keller, Jana, Wendel Wohlleben, Lan Ma-Hock, Volker Strauss, Sibylle Gröters, Karin Küttler, Karin Wiench, et al. 2014. “Time Course of Lung Retention and Toxicity of Inhaled Particles: Short-Term Exposure to Nano-Ceria.” Archives of Toxicology 88 (11): 2033–2059. doi:https://doi.org/10.1007/s00204-014-1349-9.
- Klein, C. L., K. Wiench, M. Wiemann, L. Ma-Hock, B. Van Ravenzwaay, and R. Landsiedel. 2012. “Hazard Identification of Inhaled Nanomaterials: Making Use of Short-Term Inhalation Studies.” Archives of Toxicology 86 (7): 1137–1151. doi:https://doi.org/10.1007/s00204-012-0834-2.
- Konduru, Nagarjun, Jana Keller, Lan Ma-Hock, Sibylle Gröters, Robert Landsiedel, Thomas C. Donaghey, Joseph D. Brain, et al. 2014. “Biokinetics and Effects of Barium Sulfate Nanoparticles.” Particle and Fibre Toxicology 11 (1): 15–55. doi:https://doi.org/10.1186/s12989-014-0055-3.
- Landsiedel, Robert, Masashi Gamo, and Akihiko Hirose. 2019. “The Role of In Vivo Screening Studies in Assessing Manufactured Nanomaterials.” In Vivo Inhalation Toxicity Screening Methods for Manufactured Nanomaterials, 1–21. Singapore: Springer.
- Landsiedel, Robert, Lan Ma-Hock, Thomas Hofmann, Martin Wiemann, Volker Strauss, Silke Treumann, Wendel Wohlleben, et al. 2014. “Application of Short-Term Inhalation Studies to Assess the Inhalation Toxicity of Nanomaterials.” Particle and Fibre Toxicology 11: 16. doi:https://doi.org/10.1186/1743-8977-11-16.
- Landsiedel, Robert, Lan Ma-Hock, Karin Wiench, Wendel Wohlleben, and Ursula G. Sauer. 2017. “Safety Assessment of Nanomaterials Using an Advanced Decision-Making Framework, the DF4nanoGrouping.” Journal of Nanoparticle Research: An Interdisciplinary Forum for Nanoscale Science and Technology 19 (5): 171. doi:https://doi.org/10.1007/s11051-017-3850-6.
- Maser, Elena, Markus Schulz, Ursula G. Sauer, Martin Wiemann, Lan Ma-Hock, Wendel Wohlleben, Andrea Hartwig, et al. 2015. “In Vitro and In Vivo Genotoxicity Investigations of Differently Sized Amorphous SiO2 Nanomaterials.” Mutation Research. Genetic Toxicology and Environmental Mutagenesis 794: 57–74. doi:https://doi.org/10.1016/j.mrgentox.2015.10.005.
- Mech, A., H. Rauscher, K. Rasmussen, F. Babick, V.-D. Hodoroaba, A. Ghanem, W. Wohlleben, H. Marvin, R. Brüngel, and C. M. Friedrich. 2020. The NanoDefine Methods Manual – Part 2: Evaluation of Methods. The NanoDefine Methods Manual. Luxembourg: Publications Office of the European Union. JRC117501:1–133.
- NanoCare Final Scientific Report 2009. Health Related Aspects of Nanomaterials. Editors: TAJ Kuhlbusch. HF Krug, K Nau.
- Oomen, Agnes G., Eric A. J. Bleeker, Peter M. J. Bos, Fleur van Broekhuizen, Stefania Gottardo, Monique Groenewold, Danail Hristozov, et al. 2015. “Grouping and Read-Across Approaches for Risk Assessment of Nanomaterials.” International Journal of Environmental Research and Public Health 12 (10): 13415–13434. doi:https://doi.org/10.3390/ijerph121013415.
- Osier, M., and G. Oberdörster. 1997. “Intratracheal Inhalation vs Intratracheal Instillation: Differences in Particle Effects.” Fundamental and Applied Toxicology: Official Journal of the Society of Toxicology 40 (2): 220–227. doi:https://doi.org/10.1006/faat.1997.2390.
- Pritchard, J. N., A. Holmes, J. C. Evans, N. Evans, R. J. Evans, and A. Morgan. 1985. “The Distribution of Dust in the Rat Lung following Administration by Inhalation and by Single Intratracheal Instillation.” Environmental Research 36 (2): 268–297. doi:https://doi.org/10.1016/0013-9351(85)90025-8.
- Schaefer, Jens, Christine Schulze, Elena Eva Julianne Marxer, Ulrich Friedrich Schaefer, Wendel Wohlleben, Udo Bakowsky, Claus-Michael Lehr, et al. 2012. “Atomic Force Microscopy and Analytical Ultracentrifugation for Probing Nanomaterial Protein Interactions.” ACS Nano 6 (6): 4603–4614. doi:https://doi.org/10.1021/nn202657q.
- Schwirn, K., and D. Völker. 2019. “Hazard Grouping of Nanomaterials for Daphnia and Algae Toxicity: Lessons Learned from Scientific Projects for Regulatory Applicability.” Environmental Sciences Europe 31 (1): 1–10. doi:https://doi.org/10.1186/s12302-019-0226-9.
- Schwotzer, D., H. Ernst, D. Schaudien, H. Kock, G. Pohlmann, C. Dasenbrock, O. Creutzenberg, et al. 2017. “Effects from a 90-Day Inhalation Toxicity Study with Cerium Oxide and Barium Sulfate Nanoparticles in Rats.” Particle and Fibre Toxicology 14 (1): 1–20 (Technical Report 122 Poorly Soluble Particles/Lung Overload, ECETOC, 2013, ISNN-2079-1526-122). doi:https://doi.org/10.1186/s12989-017-0204-6.
- Singh, C. S., G. Ceccone, N. Gibson, K. A. Jensen, M. Levin, H. Goenaga Infante, C. Carlander, K. Rasmussen, JRC Science and Policy Report. Cerium Dioxide, NM-211, NM-212, NM-213. Characterisation and Test Item Preparation. 2014. JRC Repository: NM-Series of Representative Manufactured Nanomaterials.
- Singh, C., S. Friedrichs, M. Levin, R. Birkedal, K. A. Jensen, G. Pojana, W. Wohlleben, JRC Science and Policy Report. Zinc Oxide, NM-110, NM-111, NM-112, NM-113. Characterisation and Test Item Preparation, et al. 2011. JRC Repository: NM-Series of Representative Manufactured Nanomaterials.
- Slob, W. 2002. “Dose-Response Modeling of Continuous Endpoints.” Toxicological Sciences: An Official Journal of the Society of Toxicology 66 (2): 298–312. doi:https://doi.org/10.1093/toxsci/66.2.298.
- Stone, Vicki, Stefania Gottardo, Eric A. J. Bleeker, Hedwig Braakhuis, Susan Dekkers, Teresa Fernandes, Andrea Haase, et al. 2020. “A Framework for Grouping and Read-Across of Nanomaterials-Supporting Innovation and Risk Assessment.” Nano Today. 35: 100941. doi:https://doi.org/10.1016/j.nantod.2020.100941.
- Stueckle, T. A., D. C. Davidson, R. Derk, T. G. Kornberg, D. Schwegler-Berry, S. V. Pirela, G. Deloid, et al. 2017. “Evaluation of Tumorigenic Potential of CeO2 and Fe2O3 Engineered Nanoparticles by a Human Cell In Vitro Screening Model.” NanoImpact 6: 39–54. doi:https://doi.org/10.1016/j.impact.2016.11.001.
- Tentschert, J., P. Laux, H. Jungnickel, J. Brunner, I. Estrela-Lopis, C. Merker, J. Meijer, et al. 2020 “Organ Burden of Inhaled Nanoceria in a 2-Year Low-Dose Exposure Study: Dump or Depot?” Nanotoxicology 14 (4): 554–576. doi:https://doi.org/10.1080/17435390.2020.1736355.
- Wiemann, Martin, Ursula Sauer, Antje Vennemann, Sandra Bäcker, Johannes-Georg Keller, Lan Ma-Hock, Wendel Wohlleben, et al. 2018. “In Vitro and In Vivo Short-Term Pulmonary Toxicity of Differently Sized Colloidal Amorphous SiO2.” Nanomaterials 8 (3): 129–160. doi:https://doi.org/10.3390/nano8030160.
- Wohlleben, Wendel, Bryan Hellack, Carmen Nickel, Monika Herrchen, Kerstin Hund-Rinke, Katja Kettler, Christian Riebeling, et al. 2019. “The NanoGRAVUR Framework to Group (Nano) Materials for Their Occupational, Consumer, Environmental Risks Based on a Harmonized Set of Material Properties, Applied to 34 Case Studies.” Nanoscale 11 (38): 17637–17654. doi:https://doi.org/10.1039/C9NR03306H.