
Abstract
This study collects toxicity data from animal inhalation studies of some nanomaterials and their bulk and ionic counterparts. To allow potential grouping and interpretations, we retrieved the primary physicochemical and exposure data to the extent possible for each of the materials. Reviewed materials are compounds (mainly elements, oxides and salts) of carbon (carbon black, carbon nanotubes, and graphene), silver, cerium, cobalt, copper, iron, nickel, silicium (amorphous silica and quartz), titanium (titanium dioxide), and zinc (chemical symbols: Ag, C, Ce, Co, Cu, Fe, Ni, Si, Ti, TiO2, and Zn). Collected endpoints are: a) pulmonary inflammation, measured as neutrophils in bronchoalveolar lavage (BAL) fluid at 0-24 hours after last exposure; and b) genotoxicity/carcinogenicity. We present the dose descriptors no-observed-adverse-effect concentrations (NOAECs) and lowest-observed-adverse-effect concentrations (LOAECs) for 88 nanomaterial investigations in data-library and graph formats. We also calculate ‘the value where 25% of exposed animals develop tumors’ (T25) for carcinogenicity studies. We describe how the data may be used for hazard assessment of the materials using carbon black as an example. The collected data also enable hazard comparison between different materials. An important observation for poorly soluble particles is that the NOAEC for neutrophil numbers in general lies around 1 to 2 mg/m3. We further discuss why some materials’ dose descriptors deviate from this level, likely reflecting the effects of the ionic form and effects of the fiber-shape. Finally, we discuss that long-term studies, in general, provide the lowest dose descriptors, and dose descriptors are positively correlated with particle size for near-spherical materials.
1. Introduction
Inhalation of nanomaterials may constitute a risk in the occupational setting as well as in society in general. To protect against the adverse effects of nanomaterials, it is critical to determine safe levels of exposure. In the lack of sufficient human data, studies in experimental animals are the second choice in chemical hazard assessment. To determine the toxic potency in animal studies, dose descriptors such as the no-observed-adverse-effect concentration (NOAEC) or ‘the value where 25% of exposed animals develop tumors’ (T25), are determined (Dybing et al. Citation1997, ECHA Citation2012, Dourson et al. Citation2013). Identification of data to establish such values often requires review of a large body of literature, unless new toxicological data are produced for this specific purpose. Thus, the compilation of existing data with key information on the tested substances can aid the process of hazard assessment.
We gathered data from animal inhalation studies available in the scientific literature for 13 groups of nanomaterials sorted by primary element (Ag, C, Ce, Co, Cu, Fe, Ni, Si, Ti, and Zn). We also collected data on their bulk and ionic counterparts. We selected the following endpoints of toxicity: (1) pulmonary inflammation in terms of neutrophil numbers in bronchoalveolar lavage (BAL) fluid at the end of the experiment (or up to 24 hours later); and (2) genotoxicity and carcinogenicity at any time point after exposure. We selected inhalation as an important route of exposure because we consider the airways the most critical organ of exposure in particle toxicology, especially in the occupational setting. The specific endpoints of inflammation and genotoxicity/carcinogenicity were selected because they are important toxicological endpoints for setting occupational exposure limits (OELs). An example of the importance of these endpoints is from Sweden where Effects on the respiratory system (other than irritation of upper passages) was the second-most assigned critical effect in the period from 1979 to 1994. Irritation of eyes and mucous membranes was the most assigned critical effect, while cancer was the third most assigned critical effect (Hansson Citation1997). These assessments were made by scientists that evaluated the available scientific and medical information on substances for setting national OEL’s.
We here present the NOAECs and lowest-observed-adverse-effect concentrations (LOAECs) for inflammation and genotoxicity/carcinogenicity, and for chronic carcinogenicity studies, furthermore T25 values. In addition to data on toxicity, we compiled data on product names and key physicochemical characteristics to allow cross-linking with other data libraries and databases for potential similarity assessment, grouping and read-across. In addition, we discuss the patterns of toxicity observed for the materials relative to solubility and shape (spheres vs. fibers considering an aspect ratio of 3, when provided, as the threshold between the two shape classes). The data are available as an attached data library (Supplementary Materials File 1), and will also be made available online, at the NanoSafer.org website (NFA Citation2022) where episodic updates are foreseen.
2. Methods
2.1. Selection of compounds to be included
We selected the nanomaterials based on four criteria: (1) We aimed at obtaining a high dynamic range in levels of hazard, based on the variation in the existing occupational exposure limits and water solubility for bulk materials; (2) We wanted to include materials of industrial relevance, based on known use and reported annual production rates published in the French registry R-Nano (ANSES Citation2019); and (3) We also wanted the materials to be important for inhalation pre-risk assessment at the workplace before large-scale use (4) We included only pristine materials, i.e. materials with no surface-chemical modifications or elemental mixtures. The data can be used to guide hazard regulators and risk assessors in their risk assessment and management of occupational exposure to nanomaterials.
Based on the four inclusion criteria, we included nanomaterials of silver, carbon (carbon nanotubes, carbon black, and graphene), cerium, cobalt, copper, iron, nickel, silicium (amorphous silica and quartz), titanium (TiO2), and zinc, as well as their bulk and ionic (dissolved) counterparts, when available. Morphologically, the materials covered particles, fibers/tubes, and flakes. The inclusion of ions and bulk material along with the nanomaterials can aid the risk characterization of nanomaterials by providing toxicological knowledge of the constituents and of the coarser-size materials.
2.2. Selection of toxicological endpoints
We selected lung inflammation and genotoxicity/carcinogenicity as end-points for the reasons outlined in the introduction. Concerning details: We included cell counts of both neutrophil granulocytes and polymorphonuclear leukocytes (PMNs) as markers of inflammation. We are aware that PNMs cover neutrophils, basophils and eosinophils; yet as the two latter cell types normally constitute a minor fraction of the total number of PMNs, we included studies reporting PMNs along with studies reporting only neutrophils. For neutrophils and PMNs, only studies evaluating the absolute number of neutrophils in BAL fluid at the end of or 24 hours post-exposure (in a few cases 16 hours post-exposure) were included.
Concerning genotoxicity assays, we included data generated by the comet assay, micronucleus assay, assessments of other chromosomal aberrations, mutation frequency measurements, 8-Oxo-2′-deoxyguanosine formation, γ-H2AX positive labeling as well as the carcinogenic endpoint of tumor/neoplasm formation. Both benign and malignant tumors were included as described in the section of T25 calculations. The tumor type for each study is described in the Data Library (Supplemental Materials Excel file)
2.3. Selection of animal species and exposure routes and exclusion criteria
Data from all mammalian species, except humans, were considered. We identified data from studies with mice, rats, guinea pigs, rabbits and hamsters. We included one study with the rasH2 mouse model, which detects carcinogenicity (Yamano et al. Citation2022b). We included both whole-body inhalation and nose-only inhalation studies. We excluded data from pulmonary exposure studies using intratracheal inhalation, intratracheal instillation or oropharyngeal aspiration. This was done to prioritize inhalation studies as the first choice for pulmonary hazard assessment, and as they represent the exposure route that humans experience. We excluded studies for which we could not extract the dose levels.
2.4. Literature search
We conducted literature searches in the PubMed database (PubMed Citation2022) using the search terms: ‘[material name] AND inhalation’ covering the period up to November 15, 2022. We identified additional relevant references from the retrieved articles’ reference lists. We entered data from 88 relevant research articles into the data library.
2.5. Selection of dose descriptors to be reported
For the endpoints of inflammation and genotoxicity/carcinogenicity, both threshold and non-threshold effects have to be considered. In accordance with the concept of thresholds, we reported no-observed-adverse-effect concentrations (NOAECs) and lowest-observed-adverse-effect concentrations LOAECs. For non-threshold genotoxicants/carcinogens, other dose descriptors are used. According to REACH, this is the benchmark dose representing a 10% response (BMD10), its lower confidence limit (BMDL10), or the T25, i.e. the daily dose which gives 25% of the animal's tumors at a specific tissue site (ECHA Citation2012). For practical reasons, we chose to report NOAECs and LOAECs for all materials, supplemented with T25s, when relevant. Notably, when there is not sufficient evidence that a carcinogenic effect has a threshold, the LOAEC more correctly can be considered the ‘Lowest dose with a significantly increased (tumor) incidence.’ This designation was used by Dybing et al. who recommended it for the calculation of T25 values (Dybing et al. Citation1997). Correspondingly, we collected the dose below the ‘Lowest dose with a significantly increased (tumor) incidence’ value (analogous to the NOAEC).
2.6. Selection of physical-chemical characteristics
We extracted physical-chemical data for the (nano)-materials and the exposure characteristics as detailed in . These parameters provide insight into the physical and chemical properties of each of the included materials enabling linkage of physical-chemical properties to their toxicological effects, and further use of the data for read-across and grouping.
Table 1. Explanation of the columns in the Excel data library.
Regarding size and crystal structure, the reported techniques for determination of diameter, length and visual structure identification were transmission or scanning electron microscopy (TEM; SEM). Phases of crystalline materials were determined using powder X-ray diffraction. Dynamic light scattering (DLS) results describe the hydrodynamic size of the materials in solution and cover the primary material objects and their aggregates and agglomerates.
Regarding specific surface area (m2/g), we used the Brunauer-Emmett-Teller (BET) data provided in scientific publications cited. Information on porosity is rarely available and not included in this work. The mass-specific surface area is important, as surface-related modes of action constitute a central driver of e.g. acute lung toxicity (Schmid and Stoeger Citation2016).
The exposure particle size, if reported, was obtained by in-line measurements during exposure using either real-time (e.g. optical and/or electrical mobility) monitors providing particle size-distributions or integrated sampling (e.g. cascade impactors) for mass-based size-distribution analysis by or substrates for analysis by electron microscopy. Real-time and mass-based size-resolved measurements provide information on the air-borne size distribution, which likely consists of a mixture of agglomerates and individual primary and aggregated particles. Consequently, the exposure particle sizes are coarser than the reported primary particle sizes usually analyzed by electron microscopy methods.
Here, we report exposure particle size in the state reported in the specific research article from which the toxicological data were retrieved.
Regarding surface chemical modification, this study only included materials that had not been subjected to surface chemical modification. However, the entry is included to capture if the report was made on surface chemical analysis of e.g. surface chemical species and process impurities.
2.7. Reporting format of tables and graphs
From each study, we extracted the descriptors described in and tabulated them in the data library (Supplemental Materials Excel file).
2.8. Reporting format of the graphs
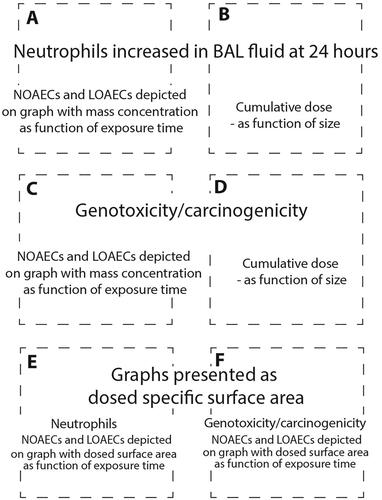
presents a graphical overview of graphs of the included materials. In panels A and C, we depict NOAECs and LOAECs of inhalation studies. To accommodate the importance of inhalation studies of long duration, chronic (1 year, ≥1560 h), subchronic (90 days, ≥390 h), and subacute (28 days, ≥120 h) studies are indicated on the graphs as vertical dotted lines. In addition, we present graphs of cumulative inhalation dose in mg/kg body weight (bw) as a function of particle size in panels B and D. This enables the identification of studies using specific particle sizes. Panel E and F present NOAECs and LOAECs as neutrophil numbers in BAL fluid at 24 hours and genotoxicity/carcinogenicity, respectively, depicted as a function of particle surface area per cubic meter of the exposure atmosphere.
Figure 1. Overview of content and placement of graphs for each material in the data library.
2.9. Conversion of exposure for graphical presentation
For most graphs, we reported the mass concentration in air (mg/m3). Yet to provide an overview of the dose descriptor levels as a function of the size of the nanomaterials, we also calculated the cumulative inhaled dose in mg/kg bw and depicted this value as a function of particle size (diameter). For carbon nanotubes, we present graphs on length, diameter, and aspect ratio (length divided by diameter). For graphene, we have plotted dose descriptors as a function of lateral size.
For the calculation of the cumulative inhaled dose in mg/kg bw, we multiplied the number of exposure-hours by the mass concentration (hours × mg/m3) and further multiplied this value by a ‘combined conversion factor cumulative mg/m3 to cumulative mg/kg bw in inhalation studies’ tabulated in . We based this value on the inhaled volume/hour and body weight (bw) of each animal species (Supplemental Materials Table S1).
Table 2. Literature references used in the Excel data library and for graphs.
For studies using the administration of particle constituents in ionic form, we subtracted the molecular mass of accompanying salts from the administered mass. For particles and bulk materials consisting of oxides, we did not subtract the mass of oxygen.
2.10. Dose descriptors expressed as particle surface area
To present the dose descriptors as particle surface area we multiplied the mg/m3 values by the specific surface area in m2/g and adjusted to cm2/m3 (using a factor of 10). We did not calculate the deposited surface area as this would encompass elaborate modeling for the many materials, but we note that Cosnier and coworkers have shown that retained particle surface area drives inflammation in rat lungs following inhalation of nanomaterials (Cosnier et al. Citation2021).
2.11. Calculation of T25s
We calculated T25s according to Dybing et al., using their default values for inhalation, lifespan, and body weight of different animal species (Dybing et al. Citation1997). For the selection of dose levels and the number of animals with tumors, we considered both malignant and benign neoplasms. This is in accordance with the REACH guideline which states that: ‘malignant tumors as well as benign tumors that are suspected of possibly progressing to malignant tumors are taken into account in obtaining the dose-descriptor values’ (ECHA Citation2012). We calculated T25s as mg/kg bw/day from mass concentrations in mg/m3 as outlined in Dybing (Dybing et al. Citation1997). This value is useful when extrapolating to other exposure routes. We also calculated the T25 directly based on the air concentration (in mg/m3) as described in (ECHA Citation2012), using a conversion of the number of hours of exposure to the animal per day into an 8-hour work day and retaining exposure for 5 days per week. Notably, we did not correct for light activity during work as can be done according to (ECHA Citation2012).
2.12. Statistics
Statistical analyses were performed using the GraphPad Prism 8.02 software package (GraphPad Software Inc., San Diego, CA). To test whether the size of dose descriptors depended on the study duration, we transformed the dose descriptors and the study duration to the logarithm base 10. This was done because the transformation made the data approach normal distribution – evaluated by the Shapiro-Wilk test and normal quantile-quantile plots. We then calculated linear regression and the F-test to test if the slope was significantly non-zero. We expressed the goodness of fit as R squared (R2). The same procedure was used to test whether the size of dose descriptors expressed as the dosed surface area was affected by study duration, and to test if the size of dose descriptors expressed as cumulative inhaled dose were dependent on particle size. The mass median aerodynamic diameter values were already normally distributed and thus not transformed. Concerning whether the surface area of the materials was dependent on size, the data were transformed to approach normality, with the exceptions of the specific surface area and diameter of carbon nanotubes, and the specific surface area and lateral size of the graphene materials.
3. Results
3.1. Obtained data
We reviewed more than 100 peer-reviewed research articles and included 88 in the data library (Supplemental Materials Excel file). We did not identify relevant studies on zirconium and manganese nanomaterials, which were intended to be included as inert and reactive benchmark materials, respectively. Data were only available for mice, rats, hamsters, guinea pigs and rabbits. Literature references are listed in .
3.2. Physicochemical parameters
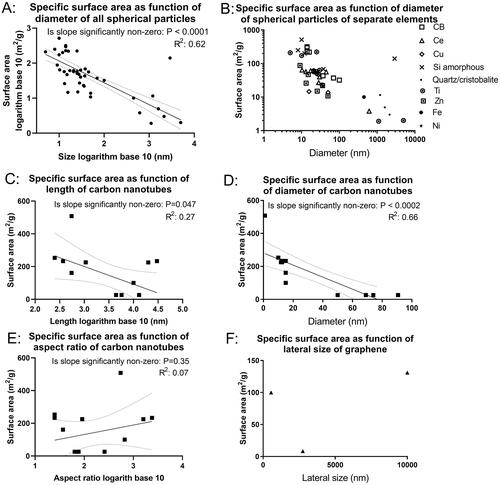
Available physicochemical parameters were extracted and reported in the data library. Overall, substantial information from producers/suppliers was available on the size and surface area, while less comprehensive data were available on other characteristics. Correlations between surface area and size are shown in . Specific surface area and diameter are moderately correlated (R2=0.62 for the spherical particles and R2=0.66 for the carbon nanotube diameter), while length and aspect ratio of carbon nanotubes were less correlated to specific surface area (R2=0.27 and 0.07, respectively). For graphene, there were too little data to determine an R2 ().
Figure 2. Specific surface area as function of primary particle size. Specific surface area was plotted as function of size for nanomaterials included in the data library for which the information was available. For spherical nanomaterials, the size is presented as diameter (A and B). For carbon nanotubes, the size is presented as either length (C), diameter (D), or aspect ratio (E). For graphene, the size is presented as the length of the edge (lateral size) (F). P values are from the linear regression F-test to test if the slope was significantly non-zero.
3.3. Toxicological findings
depict the obtained NOAECs and LOAECs reported in the data library. presents the obtained T25s. Linear regressions on all materials taken together are illustrated in . The results from statistical analyses of the linear regressions are provided in Supplemental Materials Tables S2-5. The figures are described in context with a discussion of the main findings in the next section.
Figure 3. Silver (Ag) dose descriptors.
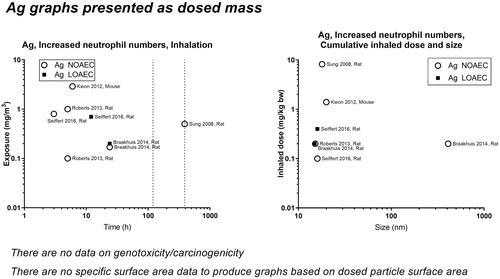
Figure 4. Carbon black (CB) dose descriptors.
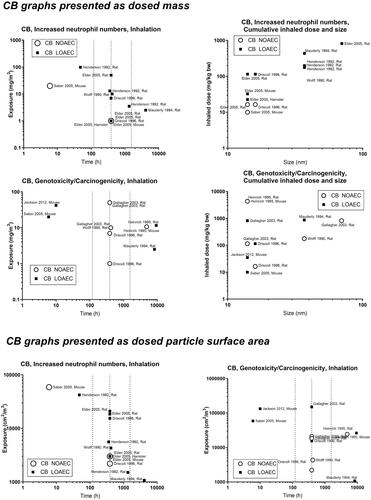
Figure 5. Carbon nanotubes (CNT) dose descriptors and length of the tubes.
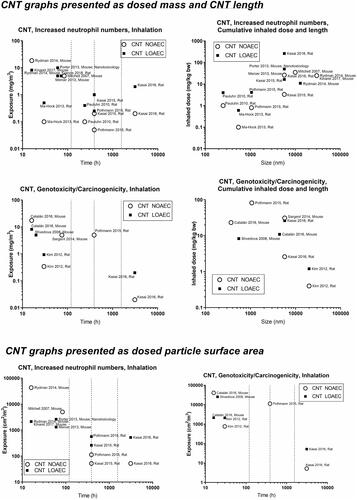
Figure 6. Carbon nanotubes (CNT) dose descriptors and diameter of the tubes.
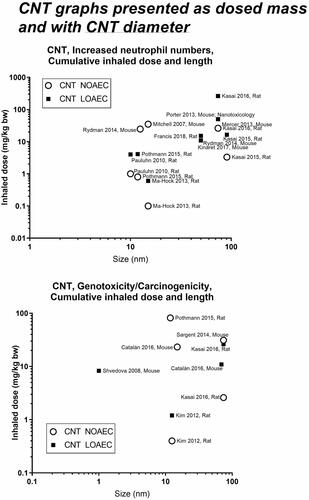
Figure 7. Graphene dose descriptors.
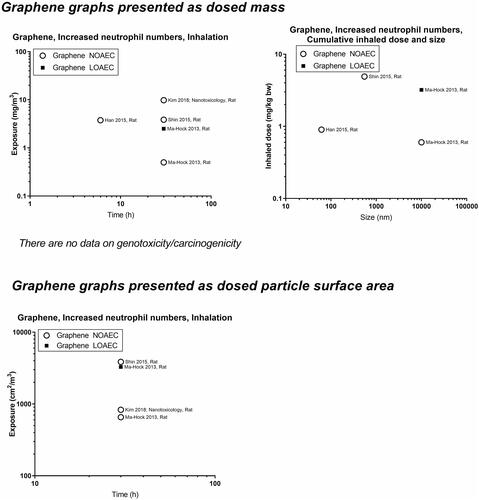
Figure 8. Cerium (CeO2) dose descriptors.
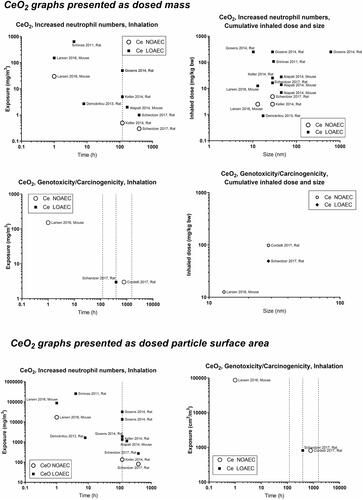
Figure 9. Cobalt (Co) dose descriptors. The data are on CoO compounds, unless otherwise indicated on the graphs with italics.
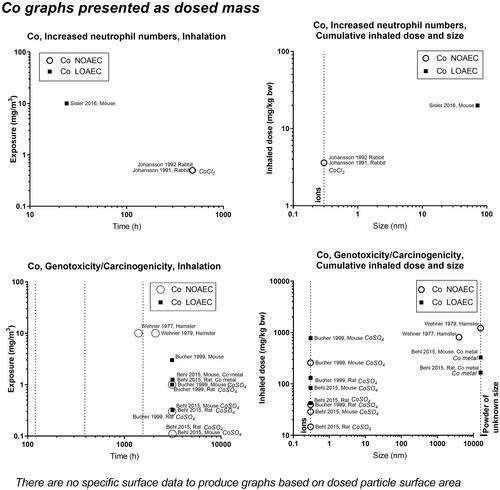
Figure 10. Copper (Cu) dose descriptors.
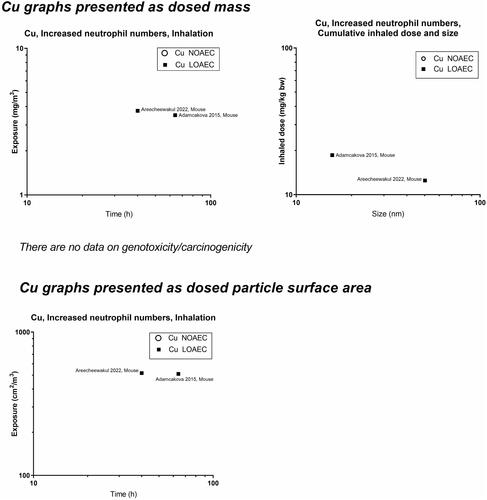
Figure 11. Iron (Fe) dose descriptors. The data are on iron oxides, unless otherwise indicated on the graphs with italics.
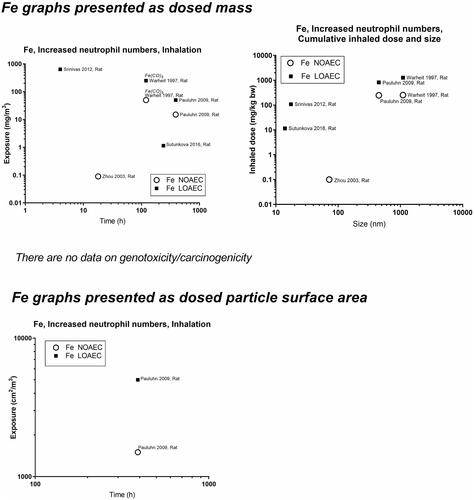
Figure 12. Nickel (Ni) dose descriptors. The data are on NiO compounds, unless otherwise indicated on the graphs with italics.
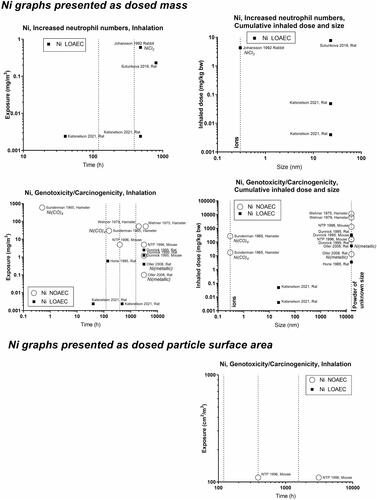
Figure 13. Silica amorphous (Si amorphous) dose descriptors.
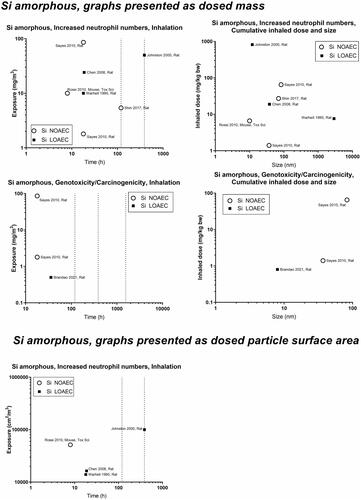
Figure 14. Quartz dose descriptors.
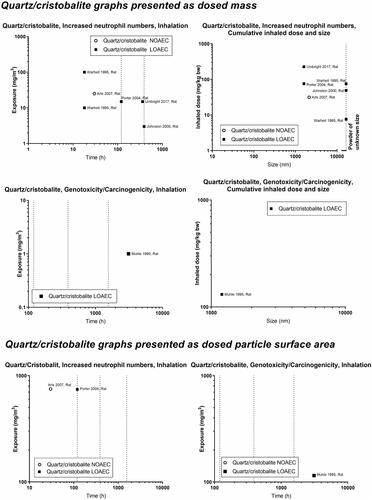
Figure 15. Titanium dioxide (TiO2) dose descriptors.
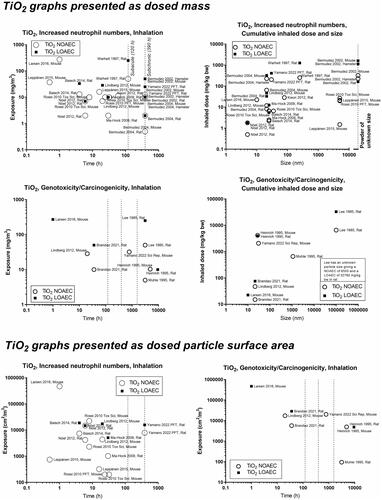
Figure 16. Zinc (Zn) dose descriptors.
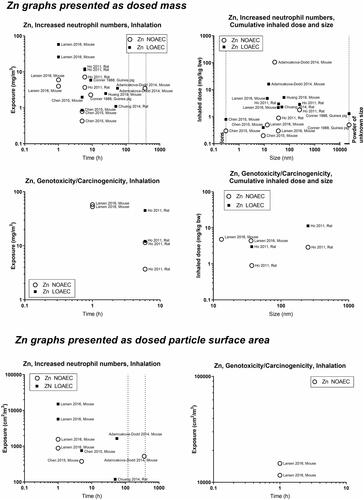
Figure 17. Graphical presentation of T25s calculated based on chronic inhalation studies included in the data library. CNT size for Kasai et al. Citation2016 depicted as length (diameter 74 nm). The upper panel shows T25s as mg/kg bw/day and the lower panel shows T25s as exposure air concentrations (mg/m3).
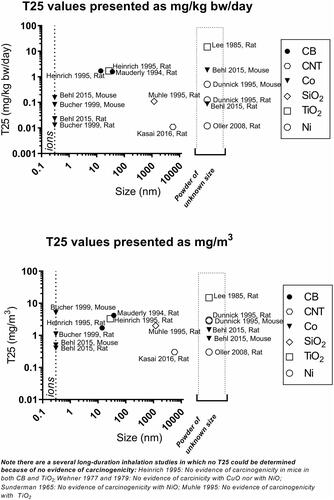
Figure 18. Linear regression of dose descriptors (NOAEC and LOAEC) expressed as mass concentration as function of study duration for all materials taken together. The P values for the F-test testing of whether the slope is significantly non-zero are inserted next to the legends.
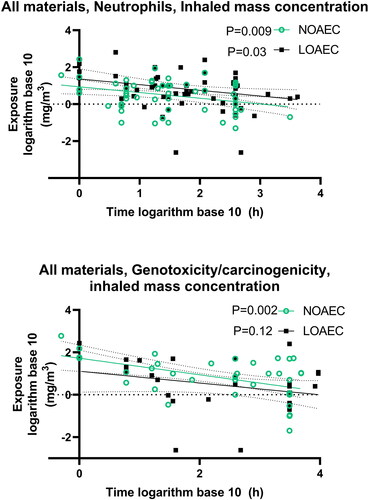
Figure 19. Linear regression showing dose descriptors expressed as surface area exposure as function of study duration for all materials taken together. The unit on the X-axis is logarithm base 10 (hours). P values for the F-test testing if the slope is significantly non-zero are inserted next to the legends.
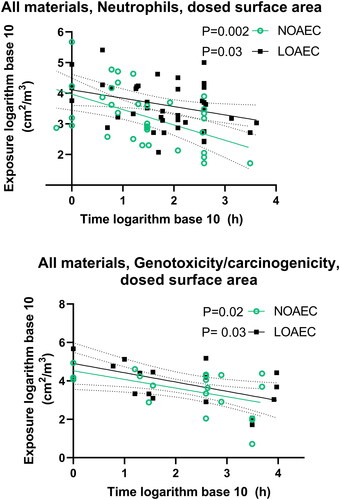
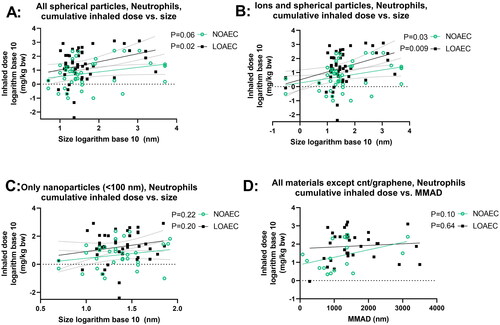
Figure 20. Linear regression of NOAEC and LOAEC for all materials taken together with dose descriptors expressed as cumulative inhaled dose as function of material size or mass median aerodynamic diameter. A shows all spherical particles, B ions and all spherical particles, C only nanoparticles with a diameter of less than 100 nm, D all materials except carbon nanotubes and graphene with mass median aerodynamic diameter (MMAD) on the x-axis. The P values for the F-test testing if the slope is significantly non-zero are inserted next to the legends. For studies where administration was in ionic form, we subtracted the molecular mass of accompanying salts from the administered mass. For particles and bulk materials consisting of oxides, we did not subtract the mass of oxygen.
4. Discussion
We identified dose descriptors for 13 nanomaterials according to inflammation and genotoxicity/carcinogenicity. The collected data can assist risk characterization of nanomaterials. In the following sections, we provide a description of how the data can be used using carbon black as an example, but with a comparison to the other materials. First, we provide information on threshold effects (both inflammation and for some materials: genotoxicity/carcinogenicity), and then we provide a section on T25s for potential non-threshold effects (carcinogenic effects).
4.1. Use of the data library for hazard assessment, using carbon black as an example
For hazard assessment of substances with a critical effect with threshold, the NOAEC value is of particular interest. This is because this dose descriptor can feed directly into the setting of e.g. Derived No-Effect-Levels (DNEL). In theory, a low NOAEC can be obtained, if the included dose levels are low and the intervals between the dose levels are large. Thus, we are most interested in the highest NOAECs, or in other words, how much the gap between NOAECs and LOAECs can be narrowed down. Thus, we should determine the upper bounds of the NOAECs of the separate studies. This will identify a NOAEC level for hazard assessment.
In the figure to the upper left in the panels (designated A in the generic description of ), we present the NOAECs as a function of exposure duration (the concept is further illustrated in Supplemental Materials Figure S2). With carbon black as an example, we focus on the long-term studies as the hazard assessor’s first choice, i.e. the studies furthest to the right. For carbon black, there is both a NOAEC and a LOAEC at around 1 mg/m3, and other LOAECs at around 2–3 mg/m3 (). The next step is to consult the specific publications to obtain further details of the studies as the basis for the selection of a specific NOAEC.
It may be of special interest to determine NOAECs for specific particle sizes. Thus, it is of interest to have the dose plotted as a function of particle size. For that purpose, the panels in the upper right of the figures can be used to identify relevant studies – as here, the cumulative dose is depicted as a function of size. After selecting key studies based on size, the same studies can be identified in the panel in the upper left, based on author name and year, and information on exposure duration and mass concentration can be extracted from the graph and used in hazard assessment. For carbon black, there is a cluster of studies performed using particles of about 14 nm in size (Printex 90) and another cluster of particles at 30–40 nm, and one study on an even larger particle (). Thus, we can now identify studies that are performed using the particular size that we are most interested in – e.g. for hazard assessment of a new carbon black material.
Concerning carbon black and genotoxicity/carcinogenicity, the graph on the middle left of can be used to identify a key study with the LOAEC of around 2–3 mg/m3 (Mauderly et al. Citation1994); and another long-term study with a greater NOAEC and LOAEC (Heinrich et al. Citation1995). Once again, we can subsequently look at the graph on the middle right side, to observe the sizes of the materials and decide whether to use the larger or the smaller carbon black as a point of departure. Finally, we can consult the T25 graph (), and identify the two studies (Mauderly et al. Citation1994, Heinrich et al. Citation1995) to obtain their T25 values for hazard assessment (ECHA Citation2012).
Finally, we have the option in the two lower-placed graphs (C and D in the generic description ) to get the dose descriptors expressed as particle surface area (cm2/m3). We did not calculate the deposited dose due to limited information on the full particle size distribution in the data set, and we prioritized dose descriptors given as air mass concentrations as this is the unit that DNELs and OELs are reported in (ECHA Citation2012). We note that Cosnier et al. has shown that inflammation correlates with retained particle surface area for carbon black, multi-walled carbon nanotubes and titanium dioxide (Cosnier et al. Citation2021).
Finally, the data library can be consulted for information on specific physical-chemical characteristics that may be present for the material that the hazard assessor is evaluating, potentially aiding read-across-based assessment, or for further research purposes (Supplementary Materials File S1).
4.2. Carcinogenic effects and the calculation of T25s
A threshold situation is when a toxicological effect only occurs if the organism is exposed to a certain (substantial) level of the material. If a threshold cannot be demonstrated for a carcinogenic compound, one should, according to ECHA (ECHA Citation2012), use a non-threshold approach. We have not evaluated whether the 13 materials in the current article are carcinogenic via a non-threshold effect. However, we do offer some calculations of T25s that the hazard assessor can use if they settle for a non-threshold approach. These are included in the data library and graphically presented in .
Concerning T25s, especially cobalt ions have low T25 values (0.01, 0.02 and 0.08 mg/kg bw/day). One study with nickel powder also presents a very low T25 value (0.01 mg/kg bw/day). The one study with carbon nanotubes (Kasai et al. Citation2016) also results in a very low T25 value (0.01 mg/kg bw/day), perhaps reflecting that the rigid fiber type in Mitsui-7 and bio-durability increase carcinogenicity. A long pulmonary half-life (up to years) can lead to translocation occurring for years. Thus, pulmonary or extra-pulmonary effects may increase or arise long after exposures have ended (Jacobsen et al. Citation2016).
4.3. The longer the study, the lower the dose descriptors (NOAECs/LOAECs)
When hazard assessors prioritize studies for an assessment, they will normally select the studies of the longest duration, and use a safety factor if a study of shorter duration is used (ECHA Citation2012). This is because studies of long duration more precisely mimics human exposure over an entire work life. This is especially relevant for risk assessment of nanomaterials, since poorly soluble nanoparticles may accumulate in the lung over time following repeated exposure, and an increasing lung burden will likely modify both inflammatory and genotoxic responses.
In theory, the longer the study, the lower dose descriptors (NOAECs or LOAECs) will be. This likely reflects that inhaled substances accumulate in the lung over time if the pulmonary deposition exceeds pulmonary clearance. Another possibility is that long-term exposure exhausts the organism’s defenses. Accordingly, we found lower dose descriptors in longer-term studies. By linear regression of NOAEC and LOAEC values for the neutrophil influx, and taking all materials into account, we found that the slopes were negative, with P values (slopes non-zero) of NOAEC P = 0.009 and LOAEC P = 0.03; while for genotoxicity/carcinogenicity the corresponding values were: NOAEC P = 0.002 and LOAEC P = 0.12 (). Concerning the individual materials, for carbon black, the slope (non-zero) for the LOAEC for neutrophils had a P value of 0.07 (NOAEC has too little data). Cerium oxide in terms of neutrophil influx had a NOAEC P = 0.05; and a LOAEC P = 0.10. Titanium oxide had for neutrophil influx a NOAEC P = 0.05 (LOAEC P = 0.98). Concerning genotoxicity/carcinogenicity, for nickel substances, the slope (non-zero) of the NOAEC had a P value of 0.07 (LOAEC P = 0.14), while for the other materials, there are either too little data or there was no statistically significant effect (Table S2).
The next question is, whether using the dose descriptors expressed as dosed particle surface area (cm2/m3) will give a stronger correlation with animal study duration, as compared to when the dose descriptor is presented as air mass concentration (mg/m3). This appears not to be the case, possibly reflecting that mass and particle surface areas correlate in the available studies. In the correlation analysis of the NOAEC and LOAEC for the neutrophil influx of all the studied materials, using dose expressed as dosed surface area as a function of study duration, the P values were for NOAEC P = 0.002 and for LOAEC P = 0.03 (i.e. both slopes were non-zero) (). For genotoxicity/carcinogenicity, the corresponding P values were for NOAEC P = 0.02 and LOAEC P = 0.03 (). Turning to specific materials, for carbon black, the correlation analysis for neutrophil influx for NOAEC had a P value of 0.05 and for LOAEC a P value of 0.005. For carbon nanotubes, the slopes of the correlation analysis for neutrophil influx for the NOAEC and LOAEC had P values of 0.03 and 0.03, respectively. Cerium oxide had a NOAEC P value of 0.07 for neutrophil influx, while the P-value for the LOAEC was 0.04. For the remaining materials, there are either too little data, or they do not point toward lower dose descriptors as a function of study duration (Table S3).
4.4. Material size and dose descriptor levels
We did linear regression on dose descriptors (NOAEC and LOAEC) expressed as cumulative inhaled (exposure) dose as a function of particle size. We tested if the slope of the linear regression was non-zero. When looking at all spherical materials together (i.e. excluding carbon nanotubes and graphene), neutrophil influx gave a NOAEC P value of 0.06 and a LOAEC P value of 0.02–indicating that the bigger the primary particle size, the higher the dose descriptor (). When ions were included too, the P values were more statistically significant: 0.03 and 0.009 for the NOAEC and LOAEC, respectively (neutrophil influx). If we only include particles <100 nm in diameter, the P values were 0.22 and 0.20 for NOAEC and LOAEC, respectively, indicating when ions and larger particles are excluded from the analysis, there is no size effect within the nanoparticle range (). For carbon black and titanium dioxide, the slopes of the LOAECs were significantly non-zero (Table S4). For carbon nanotube length, the P-values for the linear regression (slope non-zero) for inflammation were 0.04 and 0.53 for NOAEC and LOAEC, respectively, while there was no effect of diameter (Table S4). Concerning genotoxicity/carcinogenicity, the NOAECs of all materials taken together had a P value of 0.4 while for LOAEC it was 0.08, and none of the materials were significant on their own (Table S4).
Concerning mass median aerodynamic diameter, there is a tendency that the larger the size, the higher the dose descriptor on neutrophils (NOAEC P = 0.10) (Table S5 and ). There was no significant relationship between NOAEC and LOAEC (expressed as mg/kg bw) versus the specific surface area of the materials (Supplemental Materials Figure S3).
4.5. Comparison of soluble and poorly soluble materials and high aspect ratio nanomaterials
We placed the reviewed materials into four classes (graphene was exempted from this analysis due to limited data): (1) poorly soluble particles (carbon black, quartz, titanium dioxide) based on information from manufacturers, regulatory bodies or research articles reporting they are virtually insoluble (Brunner et al. Citation2006, Cho et al. Citation2012, ATSDR Citation2019, Orion_Engineered_Carbons Citation2019) and CeO, Fe2O3, NiO and CoO as argued below; (2) highly or moderately soluble particles (silver, copper, amorphous silica, zinc) based on a solubility limit of >0.1% (100 mg/L) (OECD Citation2019) in either water or media mimicking bodily fluids (Cho et al. Citation2012, Loza et al. Citation2014, Avramescu et al. Citation2020, Keller et al. Citation2021, Mbanga, Cukrowska, and Gulumian Citation2022); 3) high aspect ratio nanomaterials (carbon nanotubes); and 4) elements in ionic form (substances readily soluble in water). Cerium oxide has been argued to be partly soluble (Graham et al. Citation2014, Modrzynska et al. Citation2018). However, for the purpose of this work, we placed it into group 1 in agreement with (Brunner et al. Citation2006, Avramescu et al. Citation2020, Keller et al. Citation2021). Fe2O3 nanoparticles have been shown to have a solubility of 2.3 and 0.4% in pulmonary and sweat fluids (Godymchuk et al. Citation2022), but for the purpose of this work we place iron oxide particles in the group of the poorly soluble particles based on (Avramescu et al. Citation2020) who found that Fe2O3 displayed negligible solubility across all tested aqueous media; and Zhong et al. who found very low dissolution of this material (Zhong et al. Citation2017). Likewise, we placed NiO into the poorly soluble materials based on (Avramescu et al. Citation2020), as we did for CoO (Van Der Meeren et al. Citation2020). We discuss patterns of toxic potency for these material groups in the following sections.
Poorly soluble materials
Concerning inflammation: For poorly soluble particles, we suggest that the neutrophil influx is caused by a particle effect. Inflammation can be predicted by deposited surface area (Cosnier et al. Citation2021), and deposited surface area depends on particle size and deposition, which in turn depend on aerosolized particle size (the level of agglomeration). We observed some of the poorly soluble particles, carbon black and cerium oxide, to have a NOAEC level of around 1 to 2 mg/m3 ( and ). For quartz, the studies’ dose descriptors lie above the 1-2 mg/m3 level, perhaps reflecting the absence of studies using lower dose levels (). For titanium dioxide, the NOAEC is also observed to place somewhat above the 1-2 mg/m3 level (). One question is whether the inflammatory effects of the poorly soluble pair, quartz and titanium oxide, actually would be placed above the 1–2 mg/m3 level if more data were available. Another aspect is whether carbon there is a contributes to its inflammation potential by its elemental composition, surface-related effects, or by contaminations.
Concerning genotoxicity/carcinogenicity, NOAEC and LOAEC values start at 2.5 mg/m3 for carbon black in the study by Mauderly et al. (Mauderly et al. Citation1994), and at 11.6 mg/m3 for Heinrich et al. (only tested exposure level) (Heinrich et al. Citation1995) (). For quartz, Muhle et al. observed carcinogenic effects at 1 mg/m3 (Muhle et al. Citation1995) (), while effects of titanium dioxide are seen at higher levels ().
Concerning oxides of iron, nickel and cobalt, the dose descriptors for iron generally lie above the 1-2 mg/m3 level – perhaps reflecting that released iron ions are less toxic than if the iron had retained the particulate form (). Effects of nickel (NiO) start at around 1 mg/m3, except in one study reporting genotoxic effects at very low levels − 0.002 mg/m3 (Katsnelson et al. Citation2021) (). In contrast to the other nickel studies, which are on ions or powder of unknown size, the Katsnelson-study is on nanoparticles. There are too little data on CoO to draw a conclusion on at what level its effect begins ().
Highly and moderately soluble materials and ions
For highly soluble particles such as those of silver, zinc and copper, lung accumulation is less likely during repeated exposure, and an inflammatory response will likely reflect short-term rather than accumulated exposure. Accordingly, NOAECs/LOAECs for inflammation of the soluble materials appear less dependent on exposure duration and particle size (). Silver has NOAECs/LOAECs based on inflammation at somewhat low mass concentrations (0.2 to 0.8 mg/m3) – suggesting released ions contribute to the effect (). For nickel substances, two available studies provide very low LOAECs on BAL neutrophil numbers at as low as 0.03 mg/m3 (Sutunkova et al. Citation2019, Katsnelson et al. Citation2021) (). For copper substances, there are too little data to feed into this evaluation. Zinc substances actually place at the 1-–2 mg/m3 level (). In support of this, controlled exposure of humans with zinc oxide particles has shown dose-dependent inflammatory and acute phase responses in blood 24 hours post-exposure. In these controlled human studies, the NOAEC was 0.5 mg/m3 and the LOAEC was 1 mg/m3 for 4 hours of exposure (Monsé et al. Citation2018, Citation2021).
Potentially toxic ions
Concerning nickel, one study on NiCl2 has a LOAEC at 0.6 mg/m3 for the neutrophil influx, while a study on Ni(Cl)4 showed no effect on carcinogenicity at 30 and 600 mg/m3 (). For cobalt substances, data are predominantly from studies on the ionic form and mostly concern genotoxicity/carcinogenicity, and the effect of cobalt starts at very low levels (∼0.3 mg/m3) ().
High aspect ratio nanomaterials
Concerning inflammation, the carbon nanotube studies gave dose descriptors lower than the 1-2 mg/m3 level observed for spherical particles. This phenomenon could reflect the low clearance rates and thus very long biological half-life of carbon nanotubes (Pauluhn Citation2010). Thick carbon nanotubes studied are generally longer than thin ones, so the use of length on the graphs might produce some bias. Another probable bias relates to the characteristics of carbon nanotube exposure. Thin carbon nanotubes often appear entangled, whereas thick carbon nanotubes appear more straight and needlelike (Jackson et al. Citation2015, Poulsen et al. Citation2015, Knudsen et al. Citation2019).
describes the specific surface area as a function of size and shows that the diameter of the carbon nanotubes is more strongly associated with the specific surface area, than its length. There is evidence that fibre length is an important determinant of carbon nanotube carcinogenicity (Poland et al. Citation2008). It has been suggested that this is because fibres longer than 5 µm are difficult for lung macrophages to internalize and remove. Carbon nanotubes likely cause genotoxicity/carcinogenicity in other ways than soluble materials in that the fibers can penetrate tissues and cells and thereby interfere with normal chromosomal organization, as has previously been described for asbestos fibers (Ault et al. Citation1995). Multiwalled carbon nanotubes with an average length of 8 µm had similar carcinogenic potency as asbestos in rats (Rittinghausen et al. Citation2014). On the other hand, studies using pulmonary deposition of carbon nanotubes have shown that short, thin and entangled carbon nanotubes have similar carcinogenic potency as thick and long ones (Saleh et al. Citation2020, Citation2022).
Graphene has some NOAECs higher than the 1–2 mg/m3 level, perhaps reflecting that graphene is less inflammogenic than spherical particles.
Comparison of poorly, moderately and highly soluble and high aspect ratio nanomaterials in terms of dosed particle surface area
Above, we discussed that there might be a general particle effect at around 1–2 mg/m3. The graphs at the bottom of the panels can be used to determine whether a similar phenomenon exists when the dose descriptors are expressed as particle surface area in the exposure atmosphere (cm2/m3). Using carbon black as benchmark particle, such a level is seen around 1000–2000 cm2/m3. Cerium oxide has LOAECs around 1000 cm2/m3 (except for one study with a substantially lower LOAEC). NOAECs and LOAECs of amorphous silica are around this level – although the studies with the lowest dose descriptors are the ones from which LOAECs rather than NOAECs can be retrieved. Thus, studies of lower exposure levels would have been informative here. LOAECs for quartz lie around 700–800 cm2/m3. As is the case for the mass-based values discussed above, titanium dioxide is placed above the level of carbon black, suggesting that titanium oxide is less toxic regarding inflammation as compared with carbon black.
Concerning soluble particles, one study with copper has a LOAEC around 500 cm2/m3 suggesting higher toxicity than would be expected from the dosed surface area as compared to the poorly soluble materials. Zinc materials are placed within the 1000–2000 cm2/m3 level except in one study with a LOAEC around 100 cm2/m3, thus the conclusion on this material is equivocal.
Based on the specific surface area, NOAEC and LOAEC values for carbon nanotubes are generally below the ‘general’ level seen for spherical particles suggesting a fiber-effect that is more potent than the particle effect. Graphene once again is observed to be less toxic than the insoluble spherical particles.
4.6. Implications for grouping of materials
Grouping of nanomaterials may facilitate risk assessment of materials for which data are scarce because the hazard assessment can be read across from one material to another. One observation in the data that can inform grouping is that for several of the particles, the NOAECs and LOAECs for neutrophil influx are around 1–2 mg/m3. Consequently, this level could be a starting point for where effects can be expected for low-toxicity materials. Looking at the global data set, there appears to be lower toxicity of the tested larger-size (>100 nm) materials while a large scatter is observed for all the different nanomaterials tested (<100 nm) (). This observation indicates that, within the nano-size range, composition seems to play an important role in the exerted NOAC and LOAEC.
One question is if the current study supports the notion that all carbon nanotube materials can be grouped together? Concerning carbon nanotube length, our data indicate that the longer the tube, the higher the NOAEC, thus that shorter carbon nanotubes may be more inflammogenic. The data showed no significant relationships between inflammation and diameter, or between any carbon nanotube size parameters and carcinogenicity. This is likely due to the fact that is mostly relatively short (<5µm) carbon nanotubes that were tested in these studies.
Another question is if ions can be grouped? Since there is no particle effect the ions exert their inherent toxicity. At least the presence of ions, also those released from partially and highly soluble nanomaterials, should raise a flag that it is important to know the toxicity of the specific element (e.g. as seen for nickel compounds). The data indicate that exposure to ions (already dissolved or highly soluble) gives lower dose descriptors and thus more toxicity as seen in the linear regression results in . Finally, we note that an in-depth grouping assessment requires more comprehensive data on each of the materials including the parameters proposed in e.g, (ECHA Citation2016).
4.7. Limitations of the data library
We did not assess whether carcinogenic effects of the materials occur via threshold or non-threshold effects. We also acknowledge that although notably inflammation and mutagenicity/carcinogenicity are placed high on the list of endpoints that constitute the critical effect in an investigation by (Hansson Citation1997), other toxicological endpoints could represent the critical effect of the materials. Inflammation and mutagenicity/carcinogenicity are identified as key events in nanomaterial-relevant adverse outcome pathways (Halappanavar et al. Citation2020, Nymark et al. Citation2021).
We note that combination materials would pose an additional challenge in terms of the potential for synergy of the materials (Olmstead and LeBlanc Citation2005, Kortenkamp Citation2007, Hadrup Citation2014, Hadrup, Pedersen, et al. Citation2016, Hadrup, Svingen, et al. Citation2016); and modifications such as the introduction of porosity may also call for additional considerations (Hadrup et al. Citation2021).
This dataset of NOAECs and LOAECs is suitable for determining dose descriptors for the hazard assessment of particles. The dataset may furthermore serve as a basis for discussion of the influence of particle solubility and physical form relative to observed effect levels. Nonetheless, we emphasize that the concept of NOAECs and LOAECs entails some uncertainties. First, NOAECs/LOAECs are restricted to the test concentrations that have been included in the experimental design. If other concentrations were included, the NOAECs/LOAECs would have been different. Second, when the highest dose does not show an effect, it is often considered a NOAEC. However, had higher doses been tested, the NOAEC might have been even higher. Similarly, if the lowest dose is a LOAEC, it might have been lower had lower doses been included. Third, different analysts may appoint different endpoints as critical effects. Fourth, whether a significant effect is seen at a specific exposure level depends on statistical power based on the number of animals in the group. We acknowledge that when presenting NOAECs and LOACs, we only present two data points, even from studies that may include more dose levels. Nevertheless, this approach enables direct comparison between different studies and is highly useful for hazard assessment.
4.8. Data gaps and future directions
For most of the 13 materials, inflammation measured as neutrophils in BAL fluid (within 24 hours after termination of exposure) was covered well, albeit only a few studies were available for some materials (graphene, cobalt, copper, iron, nickel). For genotoxicity, and in particular carcinogenicity, there were clear data gaps. Particularly, we found gaps for silver, copper, iron and graphene (no data), cerium oxide, and cobalt (no data on nanosized particles).
Especially concerning carcinogenicity studies, it may be important to prioritize a few long-term studies with more endpoints rather than additional short-term studies. In addition, there were in general more data on inflammation than on genotoxicity suggesting that genotoxicity should be prioritized as an endpoint in more studies. The current graphs and data library can be used to set test concentrations in future studies to determine how high can the NOAEC be pushed, and how low the LOAEC be pushed.
5. Conclusion
We established a data library of inhalation toxicity of 13 nanomaterials relative to lung inflammation and genotoxicity/carcinogenicity. This data library can aid the selection of relevant studies for hazard characterization during risk characterization of inhalation exposure to nanoparticles. The data library also enables comparison of the hazard potential of different materials. Overall, we find that the longer-term studies provide the lowest dose descriptors. Another important observation was that the NOAEC for neutrophil influx as a biomarker of inflammation, in general, lies around 1 to 2 mg/m3 for insoluble particles, and we discuss why dose descriptors for other materials deviate from this level based on ionic effects and effects of the fiber shape. Furthermore, for all spherical particles taken together, the NOAEC and LOAEC were positively correlated with particle size.
Supplemental materials
The data library of the nanomaterials is included as a Supplemental Materials Excel file. The data library will also be made available in the NanoSafer tool (NFA Citation2022). A Supplemental Materials Word File 2 includes supplemental tables and graphs.
Supplemental Material
Download MS Word (205.7 KB)Supplemental Material
Download MS Excel (116 KB)Disclosure statement
No potential conflict of interest was reported by the author(s).
Data availability statement
The data that support the findings of this study are openly available are available in the Supplemental materials and on the Nanosafer website at www.nanosafer.org
Additional information
Funding
References
- Aalapati, S., S. Ganapathy, S. Manapuram, G. Anumolu, and B. M. Prakya. 2014. “Toxicity and Bio-Accumulation of Inhaled Cerium Oxide Nanoparticles in CD1 Mice.” Nanotoxicology 8 (7): 786–798. doi:10.3109/17435390.2013.829877.
- Adamcakova-Dodd, A., M. M. Monick, L. S. Powers, K. N. Gibson-Corley, and P. S. Thorne. 2015. “Effects of Prenatal Inhalation Exposure to Copper Nanoparticles on Murine Dams and Offspring.” Particle and Fibre Toxicology 12: 30. doi:10.1186/s12989-015-0105-5.
- Adamcakova-Dodd, A., L. V. Stebounova, J. S. Kim, S. U. Vorrink, A. P. Ault, P. T. O’Shaughnessy, V. H. Grassian, and P. S. Thorne. 2014. “Toxicity Assessment of Zinc Oxide Nanoparticles Using Sub-Acute and Sub-Chronic Murine Inhalation Models.” Part Fibre.Toxicol 11(1743-8977 (Electronic): 15.
- ANSES 2019. R-Nano [online]. https://www.r-nano.fr/?locale=en
- Areecheewakul, S., A. Adamcakova-Dodd, E. Haque, X. Jing, D. K. Meyerholz, P. T. O’Shaughnessy, P. S. Thorne, and A. K. Salem. 2022. “Time Course of Pulmonary Inflammation and Trace Element Biodistribution during and after Sub-Acute Inhalation Exposure to Copper Oxide Nanoparticles in a Murine Model.” Particle and Fibre Toxicology 19 (1): 40. doi:10.1186/s12989-022-00480-z.
- Arts, J. H. E., H. Muijser, E. Duistermaat, K. Junker, and C. F. Kuper. 2007. “Five-Day Inhalation Toxicity Study of Three Types of Synthetic Amorphous Silicas in Wistar Rats and Post-Exposure Evaluations for up to 3 Months.” Food and Chemical Toxicology : An International Journal Published for the British Industrial Biological Research Association 45 (10): 1856–1867. doi:10.1016/j.fct.2007.04.001.
- ATSDR 2019. Toxicological profile for silica.
- Ault, J. G., R. W. Cole, C. G. Jensen, L. C. Jensen, L. A. Bachert, and C. L. Rieder. 1995. “Behavior of Crocidolite Asbestos during Mitosis in Living Vertebrate Lung Epithelial Cells.” Cancer Research 55 (4): 792–798.
- Avramescu, M.-L., M. Chénier, S. Palaniyandi, and P. E. Rasmussen. 2020. “Dissolution Behavior of Metal Oxide Nanomaterials in Cell Culture Medium versus Distilled Water.” Journal of Nanoparticle Research 22 (8): 222. doi:10.1007/s11051-020-04949-w.
- Baisch, B. L., N. M. Corson, P. Wade-Mercer, R. Gelein, A. J. Kennell, G. Oberdorster, and A. Elder. 2014. “Equivalent Titanium Dioxide Nanoparticle Deposition by Intratracheal Instillation and Whole Body Inhalation: The Effect of Dose Rate on Acute Respiratory Tract Inflammation.” Particle and Fibre Toxicology 11 (Electronic): 5.
- Behl, M., M. D. Stout, R. A. Herbert, J. A. Dill, G. L. Baker, B. K. Hayden, J. H. Roycroft, J. R. Bucher, and M. J. Hooth. 2015. “Comparative Toxicity and Carcinogenicity of Soluble and Insoluble Cobalt Compounds.” Toxicology 333 (Electronic): 195–205. doi:10.1016/j.tox.2015.04.008.
- Bermudez, E., J. B. Mangum, B. Asgharian, B. A. Wong, E. E. Reverdy, D. B. Janszen, P. M. Hext, D. B. Warheit, and J. I. Everitt. 2002. “Long-Term Pulmonary Responses of Three Laboratory Rodent Species to Subchronic Inhalation of Pigmentary Titanium Dioxide Particles.” Toxicological Sciences : An Official Journal of the Society of Toxicology 70 (1): 86–97. doi:10.1093/toxsci/70.1.86.
- Bermudez, E., J. B. Mangum, B. A. Wong, B. Asgharian, P. M. Hext, D. B. Warheit, and J. I. Everitt. 2004. “Pulmonary Responses of Mice, Rats, and Hamsters to Subchronic Inhalation of Ultrafine Titanium Dioxide Particles.” Toxicological Sciences : An Official Journal of the Society of Toxicology 77 (2): 347–357. doi:10.1093/toxsci/kfh019.
- Braakhuis, H. M., F. R. Cassee, P. H. Fokkens, L. J. de la Fonteyne, A. G. Oomen, P. Krystek, W. H. de Jong, L. H. van, and M. V. Park. 2016. “Identification of the Appropriate Dose Metric for Pulmonary Inflammation of Silver Nanoparticles in an Inhalation Toxicity Study.” Nanotoxicology 10 (Electronic): 63–73.
- Braakhuis, H. M., I. Gosens, P. Krystek, J. A. Boere, F. R. Cassee, P. H. Fokkens, J. A. Post, L. H. van, and M. V. Park. 2014. “Particle Size Dependent Deposition and Pulmonary Inflammation after Short-Term Inhalation of Silver Nanoparticles.” Particle and Fibre Toxicology 11 (Electronic): 49.
- Brandão, F., C. Costa, M. J. Bessa, E. Dumortier, F. Debacq-Chainiaux, R. Hubaux, M. Salmon, et al. 2021. “Genotoxicity and Gene Expression in the Rat Lung Tissue following Instillation and Inhalation of Different Variants of Amorphous Silica Nanomaterials (aSiO2 NM).” Nanomaterials 11 (6): 1502. doi:10.3390/nano11061502.
- Brunner, T. J., P. Wick, P. Manser, P. Spohn, R. N. Grass, L. K. Limbach, A. Bruinink, and W. J. Stark. 2006. “In Vitro Cytotoxicity of Oxide Nanoparticles: Comparison to Asbestos, Silica, and the Effect of Particle Solubility.” Environmental Science & Technology 40 (14): 4374–4381. doi:10.1021/es052069i.
- Bucher, J. R., J. R. Hailey, J. R. Roycroft, J. K. Haseman, R. C. Sills, S. L. Grumbein, P. W. Mellick, and B. J. Chou. 1999. “Inhalation Toxicity and Carcinogenicity Studies of Cobalt Sulfate.” Toxicological Sciences : An Official Journal of the Society of Toxicology 49 (1): 56–67. doi:10.1093/toxsci/49.1.56.
- Carter, J. M., N. Corson, K. E. Driscoll, A. Elder, J. N. Finkelstein, J. N. Harkema, R. Gelein, P. Wade-Mercer, K. Nguyen, and G. Oberdorster. 2006. “A Comparative Dose-Related Response of Several Key Pro- and Antiinflammatory Mediators in the Lungs of Rats, Mice, and Hamsters after Subchronic Inhalation of Carbon Black.” Journal of Occupational and Environmental Medicine 48 (12): 1265–1278. doi:10.1097/01.jom.0000230489.06025.14.
- Catalan, J., K. M. Siivola, P. Nymark, H. Lindberg, S. Suhonen, H. Jarventaus, A. J. Koivisto, et al. 2016. “In Vitro and in Vivo Genotoxic Effects of Straight versus Tangled Multi-Walled Carbon Nanotubes.” Nanotoxicology 10 (6): 794–806. 17435404doi:10.3109/17435390.2015.1132345.
- Chen, J. K., C. C. Ho, H. Chang, J. F. Lin, C. S. Yang, M. H. Tsai, H. T. Tsai, and P. Lin. 2015. “Particulate Nature of Inhaled Zinc Oxide Nanoparticles Determines Systemic Effects and Mechanisms of Pulmonary Inflammation in Mice.” Nanotoxicology 9 (1): 43–53. doi:10.3109/17435390.2014.886740.
- Chen, Z., H. Meng, G. Xing, H. Yuan, F. Zhao, R. Liu, X. Chang, et al. 2008. “Age-Related Differences in Pulmonary and Cardiovascular Responses to SiO2 Nanoparticle Inhalation: nanotoxicity Has Susceptible Population.” Environmental Science & Technology 42 (23): 8985–8992. doi:10.1021/es800975u.
- Cho, W.-S., R. Duffin, F. Thielbeer, M. Bradley, I. L. Megson, W. Macnee, C. A. Poland, C. L. Tran, and K. Donaldson. 2012. “Zeta Potential and Solubility to Toxic Ions as Mechanisms of Lung Inflammation Caused by Metal/Metal Oxide Nanoparticles.” Toxicological Sciences : An Official Journal of the Society of Toxicology 126 (2): 469–477. doi:10.1093/toxsci/kfs006.
- Chuang, H. C., H. T. Juan, C. N. Chang, Y. H. Yan, T. H. Yuan, J. S. Wang, H. C. Chen, Y. H. Hwang, C. H. Lee, and T. J. Cheng. 2014. “Cardiopulmonary Toxicity of Pulmonary Exposure to Occupationally Relevant Zinc Oxide Nanoparticles.” Nanotoxicology 8 (6): 593–604. 17435404doi:10.3109/17435390.2013.809809.
- Conner, M. W., W. H. Flood, A. E. Rogers, and M. O. Amdur. 1988. “Lung Injury in Guinea Pigs Caused by Multiple Exposures to Ultrafine Zinc Oxide: changes in Pulmonary Lavage Fluid.” Journal of Toxicology and Environmental Health 25 (1): 57–69. 00984108doi:10.1080/15287398809531188.
- Cordelli, E., J. Keller, P. Eleuteri, P. Villani, L. Ma-Hock, M. Schulz, R. Landsiedel, and F. Pacchierotti. 2017. “No Genotoxicity in Rat Blood Cells upon 3- or 6-Month Inhalation Exposure to CeO 2 or BaSO 4 Nanomaterials.” Mutagenesis 32 (1): 13–22. doi:10.1093/mutage/gew005.
- Cosnier, F., C. Seidel, S. Valentino, O. Schmid, S. Bau, U. Vogel, J. Devoy, and L. Gaté. 2021. “Retained Particle Surface Area Dose Drives Inflammation in Rat Lungs following Acute, Subacute, and Subchronic Inhalation of Nanomaterials.” Particle and Fibre Toxicology 18 (1): 29. doi:10.1186/s12989-021-00419-w.
- Demokritou, P., S. Gass, G. Pyrgiotakis, J. M. Cohen, W. Goldsmith, W. McKinney, D. Frazer, et al. 2013. “An in Vivo and in Vitro Toxicological Characterisation of Realistic Nanoscale CeO(2) Inhalation Exposures.” Nanotoxicology 7 (8): 1338–1350. 17435404doi:10.3109/17435390.2012.739665.
- Dourson, M., R. A. Becker, L. T. Haber, L. H. Pottenger, T. Bredfeldt, and P. A. Fenner-Crisp. 2013. “Advancing Human Health Risk Assessment: integrating Recent Advisory Committee Recommendations.” Critical Reviews in Toxicology 43 (6): 467–492. doi:10.3109/10408444.2013.807223.
- Driscoll, K. E., J. M. Carter, B. W. Howard, D. G. Hassenbein, W. Pepelko, R. B. Baggs, and G. Oberdorster. 1996. “Pulmonary Inflammatory, Chemokine, and Mutagenic Responses in Rats after Subchronic Inhalation of Carbon Black.” Toxicology and Applied Pharmacology 136 (2): 372–380. 0041–008Xdoi:10.1006/taap.1996.0045.
- Dunnick, J. K., M. R. Elwell, A. E. Radovsky, J. M. Benson, F. F. Hahn, K. J. Nikula, E. B. Barr, and C. H. Hobbs. 1995. “Comparative Carcinogenic Effects of Nickel Subsulfide, Nickel Oxide, or Nickel Sulfate Hexahydrate Chronic Exposures in the Lung.” Cancer Research 55 (22): 5251–5256. 00085472
- Dybing, E., T. Sanner, H. Roelfzema, D. Kroese, and R. W. Tennant. 1997. “T25: A Simplified Carcinogenic Potency Index: description of the System and Study of Correlations between Carcinogenic Potency and Species/Site Specificity and Mutagenicity.” Pharmacology & Toxicology 80 (6): 272–279. doi:10.1111/j.1600-0773.1997.tb01973.x.
- ECHA 2012. Guidance on information requirements and chemical safety assessment. Chapter R.8: Characterisation of dose. [concentration]-response for human health.
- ECHA 2016. Appendix R.6-1: Recommendations for nanomaterials applicable to the Guidance on QSARs and Grouping of Chemicals.
- Elder, A., R. Gelein, J. N. Finkelstein, K. E. Driscoll, J. Harkema, and G. Oberdörster. 2005. “Effects of Subchronically Inhaled Carbon Black in Three Species. I. Retention Kinetics, Lung Inflammation, and Histopathology.” Toxicological Sciences : An Official Journal of the Society of Toxicology 88 (2): 614–629. doi:10.1093/toxsci/kfi327.
- Francis, A. P., T. Devasena, S. Ganapathy, V. R. Palla, P. B. Murthy, and S. Ramaprabhu. 2018. “Multi-Walled Carbon Nanotube-Induced Inhalation Toxicity: Recognizing Nano Bis-Demethoxy Curcumin Analog as an Ameliorating Candidate.” Nanomedicine : nanotechnology, Biology, and Medicine 14 (6): 1809–1822. doi:10.1016/j.nano.2018.05.003.
- Gallagher, J., R. Sams, J. Inmon, R. Gelein, A. Elder, G. Oberdorster, and A. K. Prahalad. 2003. “Formation of 8-Oxo-7,8-Dihydro-2’-Deoxyguanosine in Rat Lung DNA following Subchronic Inhalation of Carbon Black.” Toxicology and Applied Pharmacology 190 (3): 224–231. doi:10.1016/s0041-008x(03)00187-x.
- Godymchuk, A., A. Ilyashenko, Y. Konyukhov, P. O. Offor, and G. Baisalova. 2022. “Agglomeration and Dissolution of Iron Oxide Nanoparticles in Simplest Biological Media.” AIMS Materials Science 9 (4): 642–652. doi:10.3934/matersci.2022039.
- Gosens, I., L. E. Mathijssen, B. G. Bokkers, H. Muijser, and F. R. Cassee. 2014. “Comparative Hazard Identification of Nano- and Micro-Sized Cerium Oxide Particles Based on 28-Day Inhalation Studies in Rats.” Nanotoxicology 8 (6): 643–653. 17435404doi:10.3109/17435390.2013.815814.
- Graham, U. M., M. T. Tseng, J. B. Jasinski, R. A. Yokel, J. M. Unrine, B. H. Davis, A. K. Dozier, et al. 2014. “In Vivo Processing of Ceria Nanoparticles inside Liver: Impact on Free-Radical Scavenging Activity and Oxidative Stress.” ChemPlusChem 79 (8): 1083–1088. doi:10.1002/cplu.201402080.
- Hadrup, N. 2014. “Evidence from Pharmacology and Pathophysiology Suggests That Chemicals with Dissimilar Mechanisms of Action Could Be of Bigger Concern in the Toxicological Risk Assessment of Chemical Mixtures than Chemicals with a Similar Mechanism of Action.” Regulatory Toxicology and Pharmacology : RTP 69 (3): 281–283. doi:10.1016/j.yrtph.2014.05.007.
- Hadrup, N., K. Aimonen, M. Ilves, H. Lindberg, R. Atluri, N. M. Sahlgren, N. R. Jacobsen, et al. 2021. “Pulmonary Toxicity of Synthetic Amorphous Silica - Effects of Porosity and Copper Oxide Doping.” Nanotoxicology 15 (1): 96–113. doi:10.1080/17435390.2020.1842932.
- Hadrup, N., M. Pedersen, K. Skov, N. L. Hansen, L. O. Berthelsen, K. Kongsbak, J. Boberg, et al. 2016. “Perfluorononanoic Acid in Combination with 14 Chemicals Exerts Low-Dose Mixture Effects in Rats.” Archives of Toxicology 90 (3): 661–675. doi:10.1007/s00204-015-1452-6.
- Hadrup, N., T. Svingen, K. Mandrup, K. Skov, M. Pedersen, H. Frederiksen, H. L. Frandsen, and A. M. Vinggaard. 2016. “Juvenile Male Rats Exposed to a Low-Dose Mixture of Twenty-Seven Environmental Chemicals Display Adverse Health Effects.” PloS One 11 (9): e0162027. doi:10.1371/journal.pone.0162027.
- Halappanavar, S., S. van den Brule, P. Nymark, L. Gaté, C. Seidel, S. Valentino, V. Zhernovkov, et al. 2020. “Adverse Outcome Pathways as a Tool for the Design of Testing Strategies to Support the Safety Assessment of Emerging Advanced Materials at the Nanoscale.” Particle and Fibre Toxicology 17 (1): 16. doi:10.1186/s12989-020-00344-4.
- Han, S. G., J. K. Kim, J. H. Shin, J. H. Hwang, J. S. Lee, T. G. Kim, J. H. Lee, et al. 2015. “Pulmonary Responses of Sprague-Dawley Rats in Single Inhalation Exposure to Graphene Oxide Nanomaterials.” BioMed Research International 2015: 376756. doi:10.1155/2015/376756.
- Hansson, S. O. 1997. “Critical Effects and Exposure Limits.” Risk Analysis : An Official Publication of the Society for Risk Analysis 17 (2): 227–236. doi:10.1111/j.1539-6924.1997.tb00861.x.
- Heinrich, U., R. Fuhst, S. Rittinghausen, O. Creutzenberg, B. Bellmann, W. Koch, and K. Levsen. 1995. “Chronic Inhalation Exposure of Wistar Rats and Two Different Strains of Mice to Diesel Engine Exhaust, Carbon Black, and Titanium Dioxide.” Inhalation Toxicology 7 (4): 533–556. doi:10.3109/08958379509015211.
- Henderson, R. F., E. B. Barr, Y. S. Cheng, W. C. Griffith, and F. F. Hahn. 1992. “The Effect of Exposure Pattern on the Accumulation of Particles and the Response of the Lung to Inhaled Particles.” Fundamental and Applied Toxicology : official Journal of the Society of Toxicology 19 (3): 367–374. doi:10.1016/0272-0590(92)90175-h.
- Ho, M., K. Y. Wu, H. M. Chein, L. C. Chen, and T. J. Cheng. 2011. “Pulmonary Toxicity of Inhaled Nanoscale and Fine Zinc Oxide Particles: mass and Surface Area as an Exposure Metric.” Inhalation Toxicology 23 (14): 947–956. doi:10.3109/08958378.2011.629235.
- Horie, A., J. Haratake, I. Tanaka, Y. Kodama, and K. Tsuchiya. 1985. “Electron Microscopical Findings with Special Reference to Cancer in Rats Caused by Inhalation of Nickel Oxide.” Biological Trace Element Research 7 (4): 223–239. doi:10.1007/BF02989248.
- Huang, K.-L., H.-L. Chang, F.-M. Tsai, Y.-H. Lee, C.-H. Wang, and T.-J. Cheng. 2019. “The Effect of the Inhalation of and Topical Exposure to Zinc Oxide Nanoparticles on Airway Inflammation in Mice.” Toxicology and Applied Pharmacology 384: 114787. doi:10.1016/j.taap.2019.114787.
- Jackson, P., K. S. Hougaard, A. M. Boisen, N. R. Jacobsen, K. A. Jensen, P. Moller, G. Brunborg, et al. 2012. “Pulmonary Exposure to Carbon Black by Inhalation or Instillation in Pregnant Mice: effects on Liver DNA Strand Breaks in Dams and Offspring.” Nanotoxicology 6 (5): 486–500. 17435404doi:10.3109/17435390.2011.587902.
- Jackson, P., K. Kling, K. A. Jensen, P. A. Clausen, A. M. Madsen, H. Wallin, and U. Vogel. 2015. “Characterization of Genotoxic Response to 15 Multiwalled Carbon Nanotubes with Variable Physicochemical Properties Including Surface Functionalizations in the FE1-Muta(TM) Mouse Lung Epithelial Cell Line.” Environmental and Molecular Mutagenesis 56 (2): 183–203. doi:10.1002/em.21922.
- Jacobsen, N. R., P. Moller, P. A. Clausen, A. T. Saber, C. Micheletti, K. A. Jensen, H. Wallin, and U. Vogel. 2016. “Biodistribution of Carbon Nanotubes in Animal Models.” Basic & Clinical Pharmacology & Toxicology 121 (Suppl 3): 30–43.
- Johansson, A., T. Curstedt, and P. Camner. 1991. “Lung Lesions after Combined Inhalation of Cobalt and Nickel.” Environmental Research 54 (1): 24–38. 00139351doi:10.1016/s0013-9351(05)80192-6.
- Johansson, A., T. Curstedt, C. Jarstrand, and P. Camner. 1992. “Alveolar Macrophages and Lung Lesions after Combined Exposure to Nickel, Cobalt, and Trivalent Chromium.” Environmental Health Perspectives 97 (Print): 215–219. doi:10.1289/ehp.9297215.
- Johnston, C. J., K. E. Driscoll, J. N. Finkelstein, R. Baggs, M. A. O'Reilly, J. Carter, R. Gelein, and G. Oberdörster. 2000. “Pulmonary Chemokine and Mutagenic Responses in Rats after Subchronic Inhalation of Amorphous and Crystalline Silica.” Toxicological Sciences : An Official Journal of the Society of Toxicology 56 (2): 405–413. doi:10.1093/toxsci/56.2.405.
- Kasai, T., Y. Umeda, M. Ohnishi, H. Kondo, T. Takeuchi, S. Aiso, T. Nishizawa, M. Matsumoto, and S. Fukushima. 2015. “Thirteen-Week Study of Toxicity of Fiber-like Multi-Walled Carbon Nanotubes with Whole-Body Inhalation Exposure in Rats.” Nanotoxicology 9 (4): 413–422. doi:10.3109/17435390.2014.933903.
- Kasai, T., Y. Umeda, M. Ohnishi, T. Mine, H. Kondo, T. Takeuchi, M. Matsumoto, and S. Fukushima. 2016. “Lung Carcinogenicity of Inhaled Multi-Walled Carbon Nanotube in Rats.” Part Fibre.Toxicol 13 (Electronic): 53. 17438977
- Katsnelson, B. A., IN. Chernyshov, S. N. Solovyeva, I. A. Minigalieva, V. B. Gurvich, I. E. Valamina, O. H. Makeyev, et al. 2021. “Looking for the LOAEL or NOAEL Concentration of Nickel-Oxide Nanoparticles in a Long-Term Inhalation Exposure of Rats.” International Journal of Molecular Sciences 22 (1): 416. doi:10.3390/ijms22010416.
- Keller, J. G., M. Persson, P. Müller, L. Ma-Hock, K. Werle, J. Arts, R. Landsiedel, and W. Wohlleben. 2021. “Variation in Dissolution Behavior among Different Nanoforms and Its Implication for Grouping Approaches in Inhalation Toxicity.” NanoImpact 23: 100341. doi:10.1016/j.impact.2021.100341.
- Keller, J., W. Wohlleben, L. Ma-Hock, V. Strauss, S. Groters, K. Kuttler, K. Wiench, et al. 2014. “Time Course of Lung Retention and Toxicity of Inhaled Particles: short-Term Exposure to nano-Ceria.” Archives of Toxicology 88 (11): 2033–2059. 1432–0738doi:10.1007/s00204-014-1349-9.
- Kim, Y. H., M. S. Jo, J. K. Kim, J. H. Shin, J. E. Baek, H. S. Park, H. J. An, et al. 2018. “Short-Term Inhalation Study of Graphene Oxide Nanoplates.” Nanotoxicology 12 (3): 224–238. doi:10.1080/17435390.2018.1431318.
- Kim, J. S., J. H. Sung, K. S. Song, J. H. Lee, S. M. Kim, G. H. Lee, K. H. Ahn, et al. 2012. “Persistent DNA Damage Measured by Comet Assay of Sprague Dawley Rat Lung Cells after Five Days of Inhalation Exposure and 1 Month Post-Exposure to Dispersed Multi-Wall Carbon Nanotubes (MWCNTs) Generated by New MWCNT Aerosol Generation System.” Toxicological Sciences : An Official Journal of the Society of Toxicology 128 (2): 439–448. doi:10.1093/toxsci/kfs161.
- Kinaret, P., M. Ilves, V. Fortino, E. Rydman, P. Karisola, A. Lahde, J. Koivisto, et al. 2017. “Inhalation and Oropharyngeal Aspiration Exposure to Rod-Like Carbon Nanotubes Induce Similar Airway Inflammation and Biological Responses in Mouse Lungs.” ACS Nano 11 (1): 291–303. 1936–086Xdoi:10.1021/acsnano.6b05652.
- Knudsen, K. B., T. Berthing, P. Jackson, S. S. Poulsen, A. Mortensen, N. R. Jacobsen, V. Skaug, et al. 2019. “Physicochemical Predictors of Multi-Walled Carbon Nanotube-Induced Pulmonary Histopathology and Toxicity One Year after Pulmonary Deposition of 11 Different Multi-Walled Carbon Nanotubes in Mice.” Basic & Clinical Pharmacology & Toxicology 124 (2): 211–227. doi:10.1111/bcpt.13119.
- Kortenkamp, A. 2007. “Ten Years of Mixing Cocktails: A Review of Combination Effects of Endocrine-Disrupting Chemicals.” Environmental Health Perspectives 115 (Suppl 1): 98–105. doi:10.1289/ehp.9357.
- Kwon, J. T., A. Minai-Tehrani, S. K. Hwang, J. E. Kim, J. Y. Shin, K. N. Yu, S. H. Chang, et al. 2012a. “Acute Pulmonary Toxicity and Body Distribution of Inhaled Metallic Silver Nanoparticles.” Toxicological Research 28 (1): 25–31. 19768257doi:10.5487/TR.2012.28.1.025.
- Kwon, S., Y. S. Yang, H. S. Yang, J. Lee, M. S. Kang, B. S. Lee, K. Lee, and C. W. Song. 2012b. “Nasal and Pulmonary Toxicity of Titanium Dioxide Nanoparticles in Rats.” Toxicological Research 28 (4): 217–224. 19768257doi:10.5487/TR.2012.28.4.217.
- Larsen, S. T., P. Jackson, S. S. Poulsen, M. Levin, K. A. Jensen, H. Wallin, G. D. Nielsen, and I. K. Koponen. 2016. “Airway Irritation, Inflammation, and Toxicity in Mice following Inhalation of Metal Oxide Nanoparticles.” Nanotoxicology 10 (9): 1254–1262. 17435404doi:10.1080/17435390.2016.1202350.
- Lee, K. P., H. J. Trochimowicz, and C. F. Reinhardt. 1985. “Pulmonary Response of Rats Exposed to Titanium Dioxide (TiO2) by Inhalation for Two Years.” Toxicology and Applied Pharmacology 79 (2): 179–192. doi:10.1016/0041-008x(85)90339-4.
- Leppänen, M., A. Korpi, P. Yli-Pirilä, M. Lehto, H. Wolff, V.-M. Kosma, H. Alenius, and P. Pasanen. 2015. “Negligible Respiratory Irritation and Inflammation Potency of Pigmentary TiO2 in Mice.” Inhalation Toxicology 27 (8): 378–386. doi:10.3109/08958378.2015.1056890.
- Lindberg, H. K., G. C.-M. Falck, J. Catalán, A. J. Koivisto, S. Suhonen, H. Järventaus, E. M. Rossi, et al. 2012. “Genotoxicity of Inhaled Nanosized TiO(2) in Mice.” Mutation Research 745 (1-2): 58–64. doi:10.1016/j.mrgentox.2011.10.011.
- Loza, K., J. Diendorf, C. Sengstock, L. Ruiz-Gonzalez, J. M. Gonzalez-Calbet, M. Vallet-Regi, M. Köller, and M. Epple. 2014. “The Dissolution and Biological Effects of Silver Nanoparticles in Biological Media.” Journal of Materials Chemistry. B 2 (12): 1634–1643. doi:10.1039/c3tb21569e.
- Ma-Hock, L., S. Burkhardt, V. Strauss, A. O. Gamer, K. Wiench, R. B. van, and R. Landsiedel. 2009. “Development of a Short-Term Inhalation Test in the Rat Using Nano-Titanium Dioxide as a Model Substance.” Inhalation Toxicology 21 (2): 102–118. 10917691doi:10.1080/08958370802361057.
- Ma-Hock, L., V. Strauss, S. Treumann, K. Kuttler, W. Wohlleben, T. Hofmann, S. Groters, K. Wiench, R. B. van, and R. Landsiedel. 2013. “Comparative Inhalation Toxicity of Multi-Wall Carbon Nanotubes, Graphene, Graphite Nanoplatelets and Low Surface Carbon Black.” Particle and Fibre Toxicology 10: 23.
- Mauderly, J. L., M. B. Snipes, E. B. Barr, S. A. Belinsky, J. A. Bond, A. L. Brooks, I. Y. Chang, Y. S. Cheng, N. A. Gillett, and W. C. Griffith. 1994. “Pulmonary Toxicity of Inhaled Diesel Exhaust and Carbon Black in Chronically Exposed Rats. Part I: Neoplastic and Nonneoplastic Lung Lesions.” Archive of "Research Reports: Health Effects Institute (68 Pt 1): 1–75.
- Mbanga, O., E. Cukrowska, and M. Gulumian. 2022. “Dissolution Kinetics of Silver Nanoparticles: Behaviour in Simulated Biological Fluids and Synthetic Environmental Media.” Toxicology Reports 9: 788–796. doi:10.1016/j.toxrep.2022.03.044.
- Mercer, R. R., J. F. Scabilloni, A. F. Hubbs, L. A. Battelli, W. McKinney, S. Friend, M. G. Wolfarth, M. Andrew, V. Castranova, and D. W. Porter. 2013. “Distribution and Fibrotic Response following Inhalation Exposure to Multi-Walled Carbon Nanotubes.” Particle and Fibre Toxicology 10: 33. doi:10.1186/1743-8977-10-33.
- Mitchell, L. A., J. Gao, R. V. Wal, A. Gigliotti, S. W. Burchiel, and J. D. McDonald. 2007. “Pulmonary and Systemic Immune Response to Inhaled Multiwalled Carbon Nanotubes.” Toxicological Sciences : An Official Journal of the Society of Toxicology 100 (1): 203–214. doi:10.1093/toxsci/kfm196.
- Modrzynska, J., T. Berthing, G. Ravn-Haren, K. Kling, A. Mortensen, R. R. Rasmussen, E. H. Larsen, A. T. Saber, U. Vogel, and K. Loeschner. 2018. “In Vivo-Induced Size Transformation of Cerium Oxide Nanoparticles in Both Lung and Liver Does Not Affect Long-Term Hepatic Accumulation following Pulmonary Exposure.” PloS One 13 (8): e0202477. doi:10.1371/journal.pone.0202477.
- Monsé, C., O. Hagemeyer, M. Raulf, B. Jettkant, V. van Kampen, B. Kendzia, V. Gering, et al. 2018. “Concentration-Dependent Systemic Response after Inhalation of Nano-Sized Zinc Oxide Particles in Human Volunteers.” Particle and Fibre Toxicology 15 (1): 8. doi:10.1186/s12989-018-0246-4.
- Monsé, C., M. Raulf, B. Jettkant, V. van Kampen, B. Kendzia, L. Schürmeyer, C. E. Seifert, et al. 2021. “Health Effects after Inhalation of Micro- and Nano-Sized Zinc Oxide Particles in Human Volunteers.” Archives of Toxicology 95 (1): 53–65. doi:10.1007/s00204-020-02923-y.
- Muhle, H., B. Kittel, H. Ernst, U. Mohr, and R. Mermelstein. 1995. “Neoplastic Lung Lesions in Rat after Chronic Exposure to Crystalline Silica.” Scandinavian Journal of Work, Environment & Health 21 (Suppl 2): 27–29.
- NFA 2022. Nanosafer. http://www.nanosafer.org/
- Noel, A., K. Maghni, Y. Cloutier, C. Dion, K. J. Wilkinson, S. Halle, R. Tardif, and G. Truchon. 2012. “Effects of Inhaled nano-TiO2 Aerosols Showing Two Distinct Agglomeration States on Rat Lungs.” Toxicology Letters 214 (2): 109–119. 18793169doi:10.1016/j.toxlet.2012.08.019.
- NTP, 1996. “NTP Toxicology and Carcinogenesis Studies of Nickel Oxide (CAS No. 1313-99-1) in F344 Rats and B6C3F1 Mice (Inhalation Studies).” National Toxicology Program technical Report Series 451 (Print): 1–381.
- Nymark, P., H. L. Karlsson, S. Halappanavar, and U. Vogel. 2021. “Adverse Outcome Pathway Development for Assessment of Lung Carcinogenicity by Nanoparticles.” Frontiers in Toxicology 3: 653386. doi:10.3389/ftox.2021.653386.
- OECD 2019. Guidance Document On Aqueous-Phase Aquatic Toxicity Testing Of Difficult Test Chemicals.
- Oller, A. R., D. T. Kirkpatrick, A. Radovsky, and H. K. Bates. 2008. “Inhalation Carcinogenicity Study with Nickel Metal Powder in Wistar Rats.” Toxicology and Applied Pharmacology 233 (2): 262–275. doi:10.1016/j.taap.2008.08.017.
- Olmstead, A. W., and G. A. LeBlanc. 2005. “Toxicity Assessment of Environmentally Relevant Pollutant Mixtures Using a Heuristic Model.” Integrated Environmental Assessment and Management 1 (2): 114–122. doi:10.1897/ieam_2004-005r.1.
- Orion_Engineered_Carbons 2019. Safety data sheet on carbon black.
- Osier, M., R. B. Baggs, and G. Oberdorster. 1997. “Intratracheal Instillation versus Intratracheal Inhalation: influence of Cytokines on Inflammatory Response.” Environmental Health Perspectives 105 (suppl 5): 1265–1271. doi:10.1289/ehp.97105s51265.
- Pauluhn, J. 2009. “Retrospective Analysis of 4-Week Inhalation Studies in Rats with Focus on Fate and Pulmonary Toxicity of Two Nanosized Aluminum Oxyhydroxides (Boehmite) and Pigment-Grade Iron Oxide (Magnetite): the Key Metric of Dose is Particle Mass and Not Particle Sur.” Toxicology 259 (3): 140–148. doi:10.1016/j.tox.2009.02.012.
- Pauluhn, J. 2010. “Subchronic 13-Week Inhalation Exposure of Rats to Multiwalled Carbon Nanotubes: toxic Effects Are Determined by Density of Agglomerate Structures, Not Fibrillar Structures.” Toxicological Sciences : An Official Journal of the Society of Toxicology 113 (1): 226–242. doi:10.1093/toxsci/kfp247.
- Poland, C. A., F. Byrne, W.-S. Cho, A. Prina-Mello, F. A. Murphy, G. L. Davies, J. M. D. Coey, et al. 2012. “Length-Dependent Pathogenic Effects of Nickel Nanowires in the Lungs and the Peritoneal Cavity.” Nanotoxicology 6 (8): 899–911. doi:10.3109/17435390.2011.626535.
- Poland, C. A., R. Duffin, I. Kinloch, A. Maynard, W. A. H. Wallace, A. Seaton, V. Stone, S. Brown, W. Macnee, and K. Donaldson. 2008. “Carbon Nanotubes Introduced into the Abdominal Cavity of Mice Show Asbestos-like Pathogenicity in a Pilot Study.” Nature Nanotechnology 3 (7): 423–428. doi:10.1038/nnano.2008.111.
- Porter, D. W., A. F. Hubbs, B. T. Chen, W. McKinney, R. R. Mercer, M. G. Wolfarth, L. Battelli, et al. 2013. “Acute Pulmonary Dose–Responses to Inhaled Multi-Walled Carbon Nanotubes.” Nanotoxicology 7 (7): 1179–1194. doi:10.3109/17435390.2012.719649.
- Porter, D. W., A. F. Hubbs, R. Mercer, V. A. Robinson, D. Ramsey, J. McLaurin, A. Khan, et al. 2004. “Progression of Lung Inflammation and Damage in Rats after Cessation of Silica Inhalation.” Toxicological Sciences : An Official Journal of the Society of Toxicology 79 (2): 370–380. doi:10.1093/toxsci/kfh110.
- Porter, D. W., L. Millecchia, V. A. Robinson, A. Hubbs, P. Willard, D. Pack, D. Ramsey, et al. 2002. “Enhanced Nitric Oxide and Reactive Oxygen Species Production and Damage after Inhalation of Silica.” American Journal of Physiology. Lung Cellular and Molecular Physiology 283 (2): L485–93. doi:10.1152/ajplung.00427.2001.
- Pothmann, D., S. Simar, D. Schuler, E. Dony, S. Gaering, J. L. Le Net, Y. Okazaki, et al. 2015. “Lung Inflammation and Lack of Genotoxicity in the Comet and Micronucleus Assays of Industrial Multiwalled Carbon Nanotubes Graphistrength((c)) C100 after a 90-Day Nose-Only Inhalation Exposure of Rats.” Part Fibre.Toxicol 12 (Electronic): 21.
- Poulsen, S. S., A. T. Saber, A. Williams, O. Andersen, C. Kobler, R. Atluri, M. E. Pozzebon, et al. 2015. “MWCNTs of Different Physicochemical Properties Cause Similar Inflammatory Responses, but Differences in Transcriptional and Histological Markers of Fibrosis in Mouse Lungs.” Toxicology and Applied Pharmacology 284 (1): 16–32. doi:10.1016/j.taap.2014.12.011.
- PubMed Pubmed 2022., [online]. Available from: https://pubmed.ncbi.nlm.nih.gov/.
- Rittinghausen, S., A. Hackbarth, O. Creutzenberg, H. Ernst, U. Heinrich, A. Leonhardt, and D. Schaudien. 2014. “The Carcinogenic Effect of Various Multi-Walled Carbon Nanotubes (MWCNTs) after Intraperitoneal Injection in Rats.” Particle and Fibre Toxicology 11: 59. doi:10.1186/s12989-014-0059-z.
- Roberts, J. R., W. McKinney, H. Kan, K. Krajnak, D. G. Frazer, T. A. Thomas, S. Waugh, et al. 2013. “Pulmonary and Cardiovascular Responses of Rats to Inhalation of Silver Nanoparticles.” Journal of Toxicology and Environmental Health. Part A 76 (11): 651–668. 15287394doi:10.1080/15287394.2013.792024.
- Rossi, E. M., L. Pylkkanen, A. J. Koivisto, H. Nykasenoja, H. Wolff, K. Savolainen, and H. Alenius. 2010. “Inhalation Exposure to Nanosized and Fine TiO2 Particles Inhibits Features of Allergic Asthma in a Murine Model.” Part Fibre.Toxicol 7 (Electronic): 35.
- Rossi, E. M., L. Pylkkanen, A. J. Koivisto, M. Vippola, K. A. Jensen, M. Miettinen, K. Sirola, et al. 2010. “Airway Exposure to Silica-Coated TiO2 Nanoparticles Induces Pulmonary Neutrophilia in Mice.” Toxicological Sciences : An Official Journal of the Society of Toxicology 113 (2): 422–433. doi:10.1093/toxsci/kfp254.
- Rydman, E. M., M. Ilves, A. J. Koivisto, P. A. Kinaret, V. Fortino, T. S. Savinko, M. T. Lehto, et al. 2014. “Inhalation of Rod-like Carbon Nanotubes Causes Unconventional Allergic Airway Inflammation.” Part Fibre.Toxicol 11 (Electronic): 48
- Saber, A. T., J. Bornholdt, M. Dybdahl, A. K. Sharma, S. Loft, U. Vogel, and H. Wallin. 2005. “Tumor Necrosis Factor is Not Required for Particle-Induced Genotoxicity and Pulmonary Inflammation.” Archives of Toxicology 79 (3): 177–182. doi:10.1007/s00204-004-0613-9.
- Saleh, D. M., W. T. Alexander, T. Numano, O. H. M. Ahmed, S. Gunasekaran, D. B. Alexander, M. Abdelgied, et al. 2020. “Comparative Carcinogenicity Study of a Thick, Straight-Type and a Thin, Tangled-Type Multi-Walled Carbon Nanotube Administered by Intra-Tracheal Instillation in the Rat.” Particle and Fibre Toxicology 17 (1): 48. doi:10.1186/s12989-020-00382-y.
- Saleh, D. M., S. Luo, O. H. M. Ahmed, D. B. Alexander, W. T. Alexander, S. Gunasekaran, A. M. El-Gazzar, et al. 2022. “Assessment of the Toxicity and Carcinogenicity of Double-Walled Carbon Nanotubes in the Rat Lung after Intratracheal Instillation: A Two-Year Study.” Particle and Fibre Toxicology 19 (1): 30. doi:10.1186/s12989-022-00469-8.
- Sargent, L. M., D. W. Porter, L. M. Staska, A. F. Hubbs, D. T. Lowry, L. Battelli, K. J. Siegrist, et al. 2014. “Promotion of Lung Adenocarcinoma following Inhalation Exposure to Multi-Walled Carbon Nanotubes.” Particle and Fibre Toxicology 11 (Electronic): 3. doi:10.1186/1743-8977-11-3.
- Sayes, C. M., K. L. Reed, K. P. Glover, K. A. Swain, M. L. Ostraat, E. M. Donner, and D. B. Warheit. 2010. “Changing the Dose Metric for Inhalation Toxicity Studies: short-Term Study in Rats with Engineered Aerosolized Amorphous Silica Nanoparticles.” Inhalation Toxicology 22 (4): 348–354. doi:10.3109/08958370903359992.
- Schmid, O., and T. Stoeger. 2016. “Surface Area is the Biologically Most Effective Dose Metric for Acute Nanoparticle Toxicity in the Lung.” Journal of Aerosol Science 99: 133–143. doi:10.1016/j.jaerosci.2015.12.006.
- Schwotzer, D., H. Ernst, D. Schaudien, H. Kock, G. Pohlmann, C. Dasenbrock, and O. Creutzenberg. 2017. “Effects from a 90-Day Inhalation Toxicity Study with Cerium Oxide and Barium Sulfate Nanoparticles in Rats.” Particle and Fibre Toxicology 14 (1): 23. doi:10.1186/s12989-017-0204-6.
- Seiffert, J., A. Buckley, B. Leo, N. G. Martin, J. Zhu, R. Dai, F. Hussain, et al. 2016. “Pulmonary Effects of Inhalation of Spark-Generated Silver Nanoparticles in Brown-Norway and Sprague-Dawley Rats.” Respir.Res 17 (Electronic): 85.
- Shin, J. H., S. G. Han, J. K. Kim, B. W. Kim, J. H. Hwang, J. S. Lee, J. H. Lee, et al. 2015. “5-Day Repeated Inhalation and 28-Day Post-Exposure Study of Graphene.” Nanotoxicology 9 (8): 1023–1031. doi:10.3109/17435390.2014.998306.
- Shin, J. H., K. Jeon, J. K. Kim, Y. Kim, M. S. Jo, J. S. Lee, J. E. Baek, et al. 2017. “Subacute Inhalation Toxicity Study of Synthetic Amorphous Silica Nanoparticles in Sprague-Dawley Rats.” Inhalation Toxicology 29 (12-14): 567–576. doi:10.1080/08958378.2018.1426661.
- Shvedova, A. A., E. Kisin, A. R. Murray, V. J. Johnson, O. Gorelik, S. Arepalli, A. F. Hubbs, et al. 2008. “Inhalation vs. aspiration of Single-Walled Carbon Nanotubes in C57BL/6 Mice: inflammation, Fibrosis, Oxidative Stress, and Mutagenesis.” American Journal of Physiology. Lung Cellular and Molecular Physiology 295 (4): L552–L565. doi:10.1152/ajplung.90287.2008.
- Sisler, J. D., R. Li, W. McKinney, R. R. Mercer, Z. Ji, T. Xia, X. Wang, et al. 2016. “Differential Pulmonary Effects of CoO and La2O3 Metal Oxide Nanoparticle Responses during Aerosolized Inhalation in Mice.” Particle and Fibre Toxicology 13 (1): 42. doi:10.1186/s12989-016-0155-3.
- Srinivas, A., P. J. Rao, G. Selvam, A. Goparaju, P. B. Murthy, and P. N. Reddy. 2012. “Oxidative Stress and Inflammatory Responses of Rat following Acute Inhalation Exposure to Iron Oxide Nanoparticles.” Human & Experimental Toxicology 31 (11): 1113–1131. doi:10.1177/0960327112446515.
- Srinivas, A., P. J. Rao, G. Selvam, P. B. Murthy, and P. N. Reddy. 2011. “Acute Inhalation Toxicity of Cerium Oxide Nanoparticles in Rats.” Toxicology Letters 205 (2): 105–115. 18793169doi:10.1016/j.toxlet.2011.05.1027.
- Sunderman, F. W., and A. J. Donnelly. 1965. “Studies of Nickel Carcinogenesis Metastasizing Pulmonary Tumors in Rats Induced by the Inhalation of Nickel Carbonyl.” The American Journal of Pathology 46 (6): 1027–1041.
- Sung, J. H., J. H. Ji, J. U. Yoon, D. S. Kim, M. Y. Song, J. Jeong, B. S. Han, et al. 2008. “Lung Function Changes in Sprague-Dawley Rats after Prolonged Inhalation Exposure to Silver Nanoparticles.” Inhalation Toxicology 20 (6): 567–574. 10917691doi:10.1080/08958370701874671.
- Sutunkova, M. P., B. A. Katsnelson, L. I. Privalova, V. B. Gurvich, L. K. Konysheva, V. Y. Shur, E. V. Shishkina, et al. 2016. “On the Contribution of the Phagocytosis and the Solubilization to the Iron Oxide Nanoparticles Retention in and Elimination from Lungs under Long-Term Inhalation Exposure.” Toxicology 363–364 (Electronic): 19–28. doi:10.1016/j.tox.2016.07.006.
- Sutunkova, M. P., S. N. Solovyeva, I. A. Minigalieva, V. B. Gurvich, I. E. Valamina, O. H. Makeyev, V. Y. Shur, et al. 2019. “Toxic Effects of Low-Level Long-Term Inhalation Exposures of Rats to Nickel Oxide Nanoparticles.” International Journal of Molecular Sciences 20 (7): 1778. doi:10.3390/ijms20071778.
- Umbright, C., R. Sellamuthu, J. R. Roberts, S.-H. Young, D. Richardson, D. Schwegler-Berry, W. McKinney, et al. 2017. “Pulmonary Toxicity and Global Gene Expression Changes in Response to Sub-Chronic Inhalation Exposure to Crystalline Silica in Rats.” Journal of Toxicology and Environmental Health. Part A 80 (23-24): 1349–1368. doi:10.1080/15287394.2017.1384773.
- Van Der Meeren, A., D. Lemaire, S. Coudert, G. Drouet, M. Benameur, C. Gouzerh, C. Y. Hee, et al. 2020. “In Vitro Assessment of Cobalt Oxide Particle Dissolution in Simulated Lung Fluids for Identification of New Decorporating Agents.” Toxicology in Vitro : An International Journal Published in Association with BIBRA 66: 104863. doi:10.1016/j.tiv.2020.104863.
- Warheit, D. B., J. F. Hansen, I. S. Yuen, D. P. Kelly, S. I. Snajdr, and M. A. Hartsky. 1997. “Inhalation of High Concentrations of Low Toxicity Dusts in Rats Results in Impaired Pulmonary Clearance Mechanisms and Persistent Inflammation.” Toxicology and Applied Pharmacology 145 (1): 10–22. doi:10.1006/taap.1997.8102.
- Warheit, D. B., T. A. McHugh, and M. A. Hartsky. 1995. “Differential Pulmonary Responses in Rats Inhaling Crystalline, Colloidal or Amorphous Silica Dusts.” Scandinavian Journal of Work, Environment & Health 21 (Suppl 2): 19–21.
- Wehner, A. P., R. H. Busch, R. J. Olson, and D. K. Craig. 1975. “Chronic Inhalation of Nickel Oxide and Cigarette Smoke by Hamsters.” American Industrial Hygiene Association Journal 36 (11): 801–810. doi:10.1080/0002889758507346.
- Wehner, A. P., R. H. Busch, R. J. Olson, and D. K. Craig. 1977. “Chronic Inhalation of Cobalt Oxide and Cigarette Smoke by Hamsters.” American Industrial Hygiene Association Journal 38 (7): 338–346. doi:10.1080/0002889778507627.
- Wehner, A. P., O. R. Moss, E. M. Milliman, G. E. Dagle, and R. E. Schirmer. 1979. “Acute and Subchronic Inhalation Exposures of Hamsters to Nickel-Enriched Fly Ash.” Environmental Research 19(0013-9351 (2): 355–370. doi:10.1016/0013-9351(79)90061-6.
- Wehner, A. P., B. O. Stuart, and C. L. Sanders. 1979. “Inhalation Studies with Syrian Golden Hamsters.” Progress in Experimental Tumor Research 24: 177–198. doi:10.1159/000402095.
- Wolff, R. K., J. A. Bond, R. F. Henderson, J. R. Harkema, and J. L. Mauderly. 1990. “Pulmonary Inflammation and DNA Adducts in Rats Inhaling Diesel Exhaust or Carbon Black.” Inhalation Toxicology 2 (3): 241–254. doi:10.3109/08958379009145257.
- Yamano, S., Y. Goto, T. Takeda, S. Hirai, Y. Furukawa, Y. Kikuchi, T. Kasai, et al. 2022a. “Pulmonary Dust Foci as Rat Pneumoconiosis Lesion Induced by Titanium Dioxide Nanoparticles in 13-Week Inhalation Study.” Particle and Fibre Toxicology 19 (1): 58. doi:10.1186/s12989-022-00498-3.
- Yamano, S., T. Takeda, Y. Goto, S. Hirai, Y. Furukawa, Y. Kikuchi, T. Kasai, et al. 2022b. “No Evidence for Carcinogenicity of Titanium Dioxide Nanoparticles in 26-Week Inhalation Study in rasH2 Mouse Model.” Scientific Reports 12 (1): 14969. doi:10.1038/s41598-022-19139-y.
- Zhong, L., Y. Yu, H. Lian, X. Hu, H. Fu, and Y. Chen. 2017. “Solubility of Nano-Sized Metal Oxides Evaluated by Using in Vitro Simulated Lung and Gastrointestinal Fluids: implication for Health Risks.” Journal of Nanoparticle Research 19 (11): 375. doi:10.1007/s11051-017-4064-7.
- Zhou, Y. M., C. Y. Zhong, I. M. Kennedy, and K. E. Pinkerton. 2003. “Pulmonary Responses of Acute Exposure to Ultrafine Iron Particles in Healthy Adult Rats.” Environmental Toxicology 18 (4): 227–235. doi:10.1002/tox.10119.