
ABSTRACT
This study aims to contribute to future-proofing the supply of cement powders for the UK’s nuclear waste cementation program, by enabling rapid and reliable assessment of heat evolution from candidate grout formulations. Isothermal conduction calorimetry and semi-adiabatic calorimetry experiments were carried out at room temperature, to monitor the heat of hydration of blended blast furnace slag (BFS)-Portland cement formulations of relevance for wasteform grout applications. By changing the particle size distribution of the BFS, the physical and chemical properties of the cement grout are altered, and this can be monitored and understood through comparison between the two calorimetry methods.
Introduction
The area of nuclear waste management and decommissioning is highly topical in the UK, with a current inventory of radioactive waste totalling 4.9 million tonnes [Citation1]. Currently, the favoured method for the disposal of low and intermediate level waste (LLW/ILW) is encapsulation in a cementitious grout matrix [Citation2]. The material used during encapsulation is a mix of Portland cement (PC) with a high proportion of blast furnace slag (BFS). The nuclear industry have previously used a unique powder specification for the BFS material to produce grouts, but unfortunately this powder supply has become unavailable due to various economic demands on the cement industry. The alternative material now being used is a blend of construction industry grade ground granulated blast furnace slag (GGBS) and a coarser fraction glassy slag of a similar chemical composition called Calumite [Citation3]. By blending the finer GGBS with the coarser Calumite fraction it is possible to produce a material with an optimum particle size distribution (PSD) which meets the desired performance specifications when used in a grout.
One of the key performance parameters required by the nuclear industry is the capability to control the heat evolution of cement wasteforms. An important type of waste package in the UK is a 500 L drum, which is filled with ILW waste and a BFS/OPC cement grout. The planned route for disposal of these packages will be into a deep geological disposal facility (GDF) [Citation4], after a period of some decades of interim storage. The packages are required to be durable and safe, therefore a need for low heat evolution from the cement is essential to prevent cracking and reduce problems with the waste packages during storage and emplacement, as well as in situ in the GDF. The semi-adiabatic temperature rise during cement hydration is thus a key performance parameter, and must be monitored and predicted accurately.
This requirement to be able to measure the heat release during hydration of blended cementitious materials straightforwardly and with consistent, reliable results was one of the main drivers of this study. Currently, there are two methods standardised in the UK for measuring the heat of hydration of cement: solution calorimetry at 7 days (BS EN 196-8), and semi-adiabatic calorimetry measured at 41 h (BS EN 196-9), which are claimed to give equivalent results [Citation5,Citation6]. In solution calorimetry, the cement is hydrated at a constant temperature and this is therefore essentially an isothermal test. However, the measurement involves dissolving the hydrated cement into a highly corrosive and hazardous mixture of nitric and hydrofluoric acids, making it an unattractive method to use routinely in a laboratory or field setting. semi-adiabatic calorimetry consists of preparing a freshly made sample and measuring the heat emitted [Citation7]. This method requires insulated flasks in order to have the lowest heat loss possible, calibrated against a reference flask and with known rates of heat loss to the environment to enable calculation of heat evolution rates from the temperature history in the sample flask, and uses quite a large sample (1575 g of fresh mortar in BS EN 196-9). The British and European Standards (BS EN 197-1) classify a low heat cement as a cement that ‘shall not exceed the characteristic value of 270 J/g’ determined using either of the above methods [Citation8].
However, isothermal conduction calorimetry can also be used to measure the heat production rate of small cement samples and would be a useful method to classify ‘low heat cements’. This method has been extensively used and reported, and is being considered at pre-standardisation levels across Europe [Citation9] but is still not a standardised technique for the measurement of heat of hydration in Europe. Wadsö and Arndt [Citation10] reported a study carried out in 2003 to evalute the use of isothermal conduction as an appropriate method for the determination of the heat of hydration of cement at 3 days. They concluded that it is more precise than traditional methods for Portland cement, but did not perform as well for slag-based cement.
In this study, the isothermal and semi-adiabatic calorimetric methods for measuring the heat evolution from cement grouts that contain a high slag content were analysed and compared. The semi-adiabatic method was used to determine the maximum temperature rise during hydration rather than as a method of directly quantifying The formulations were varied by changing the PSD of the slag component of the blended cement powder, and mixing at different water to solids (w/s) ratios.
Experimental design
Materials
All of the powders used were supplied by Hanson Cement. The GGBS was sourced from the Scunthorpe GGBS works which is supplied with granulate from the Scunthorpe steelworks’ blast furnaces. The Calumite was produced by Calumite Ltd, also from the Scunthorpe works. The Portland cement (PC) used was a Sellafield Ltd. grade supplied by Hanson Cement from their Ribblesdale works. The chemical compositions of the three powders were determined by X-ray fluorescence (XRF) and the main components are shown in .
Table 1. Composition of raw materials as determined by XRF, blaine fineness and PSD analysis.
The fineness of the raw materials was measured by Blaine air-permeability apparatus (). There is no measurement for the Calumite because it was not possible to form a compacted bed of powder which is needed to carry out the test. This is due to large particles and therefore a low surface area within the material. The PSD of the material was measured using laser diffraction and is also shown in .
Mix design
A blend of 3:1 BFS:PC by mass was used (where the BFS is comprised of different ratios of GGBS to Calumite), at a 0.35 water/solids (w/s) ratio [Citation11]. Additional w/s ratios (0.33, 0.37) were used to monitor the effect of water content. To analyse the effect of changing the PSD, 10 different ratios of GGBS:Calumite were used to represent the BFS fraction within the blend: 100:0, 80:20, 72.5:27.5, 65:35, 58.5:41.5, 52:48, 42.25:57.75, 32.6:67.5, 22.75:77.25 and 0:100. shows the formulations used based on a 200 g batch.
Table 2. Blend ratios of GGBS:Calumite:OPC at three different w/s ratios.
Calorimetry methods
Isothermal calorimetry
Isothermal calorimetry analysis was carried out using a TAM air calorimeter set at 25°C. The blends described in were analysed using 10 g samples of each cement. The dry components were combined before the addition of water, and the paste was externally mixed by hand for 2 min to achieve a homogeneous paste before pouring into small HDPE ampoules.
Semi-adiabatic calorimetry
Semi-adiabatic calorimetry was carried out on the blends described in , using a 500 g batch. The dry components were combined before the addition of water and then mixed by hand for 2 min. The cement pastes were then mixed with a high shear Silverson mixer for 10 min (3500 rev min−1) to achieve a homogeneous paste before pouring each mix into one of a set of ten identical 500 mL vacuum flasks (Thermos Thermocafe). T-type thermocouples inserted in the centre of each flask were used to monitor the temperature change via a Pico Technology USB TC-08 data logger. The logger was set up to record the temperature at 1-min intervals.
Results and discussion
Isothermal calorimetry analysis
The isothermal data for the ten blends of GGBS:Calumite:PC, , show that as the GGBS content increases, the total heat evolution increases. Within the Sellafield Ltd specification, a low total heat evolution is one of the key performance criteria when considering different grout formulations. All of the blends considered here can be described as very low heat cements under the European standard classification [Citation12].
Figure 1. Isothermal calorimetry (left) and total heat evolution (right) curves measured at 25°C for 120 h for the 10 GGBS:Calumite blend ratios (). w/s = 0.33 (top), 0.35 (middle) and 0.37 (bottom).
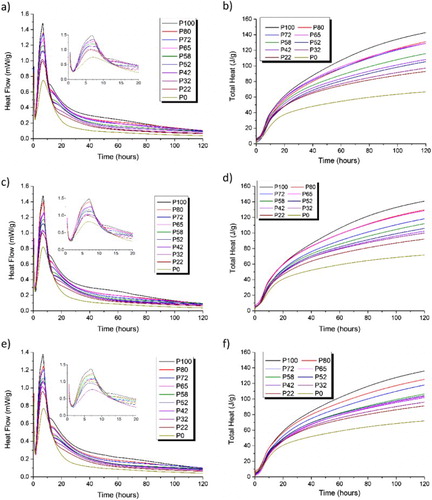
From the data, it is clear that the peak heat of reaction decreases as the Calumite fraction increases, likely due to the reduced reactivity of the larger particles present in this fraction. An initial heat release peak was observed in all five blends between 3 and 9 h (), which was assigned mainly to alite hydration [Citation13]. The time at which the alite peak occurs shifts as the GGBS content increases. The formation of a secondary ettringite peak between 7 and 8 h and an AFm peak at 16 h were identified with increasing intensity as the GGBS content rises. It is important to notice that when the BFS component was made up purely of the coarse-ground Calumite, these additional peaks are not observable, indicating that the PSD of the slag component is influencing both the physical and chemical properties of the cement produced, even when the early-age hydration is dominated by the PC fraction.
Semi-adiabatic calorimetry analysis
The semi-adiabatic calorimetry data () illustrate a more representative temperature profile of the cement grouts compared to small samples held under strictly isothermal conditions in . The flasks used in these experiments are well-insulated and although the exact temperature rise for a larger sample is not captured, it does provide a closer representation of how the material would perform within a full-scale wasteform. These results show a different trend to the data obtained through isothermal calorimetry; there was more variation in the maximum heat of reaction peak obtained for the combination mixes. Therefore, there was not a fully consistent trend in maximum peak temperature observed with respect to the GGBS content. A similar result was observed at all three w/s ratios (0.33, 0.35 and 0.37).
Figure 2. Semi-adiabatic calorimetry curves for the 10 GGBS:Calumite blend ratios measured at room temperature for 80 h at w/s = 0.35.
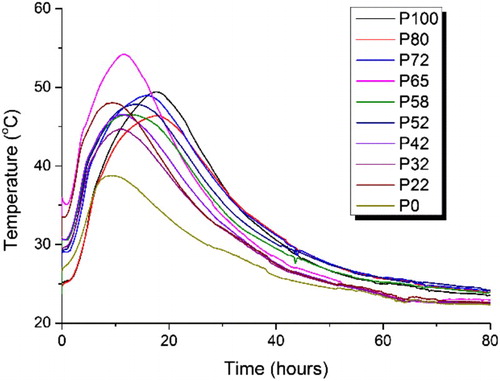
The initial temperature rise observed in the semi-adiabatic calorimetry for each of the 10 blends was recorded, as shown in . Some of the blends fall out of trend at all three w/s ratios, with a peak temperature higher than would be expected. This suggests that at each of those blends, the mix ratio has a more optimum PSD for reaction. The wider PSD introduced by blending the different slag fractions has created more space for hydrates of the clinker phase to form, which has enhanced the reaction causing a higher temperature, comparable to the ‘filler effect’ [Citation14]. Having said this, a certain amount of the finer GGBS is still required in order to maintain reactivity, maybe through inducing nucleation on the fine particle surfaces, which is why the 0:100 blend does not have a higher peak heat. These results highlight the importance of reaching the optimum blend of GGBS:Calumite, but also ensuring that the correct w/s ratio is used in order to achieve the required heat output specifications.
Table 3. Initial temperature rise observed in semi-adiabatic calorimetry for the 10 GGBS:Calumite blends at three w/s ratios.
If the three w/s ratios are compared against one another, the results show that the highest w/s ratio (0.37) generally has a lower peak temperature compared to the lower two w/s ratios. However, the 0:100 blend does not follow this observation; in this case, the 0.37 w/s has a higher peak temperature. It has been well reported and discussed that the rate determining step in the acceleration period is the growth of C–S–H as reviewed by Scrivener et al. [Citation14]. Due to the low surface area of the Calumite, it results in faster hydration of PC, enhancing the growth of C-S-H which potentially means that more portlandite is produced to react with the BFS, causing a higher peak heat temperature in the 0:100 blend at a 0.37 w/s ratio.
Effect of water content
During the isothermal calorimetry tests, changing the w/s ratio did not affect the results significantly and produced very similar data across the three ratios. Throughout the semi-adiabatic experiments there is less consistency, suggesting that the w/s ratio has more influence on the heat evolution of the cement grouts. As previously mentioned, the semi-adiabatic method is more representative of plant conditions where a significant temperature rise is expected in the 500 L waste drums, and therefore, may be a more indicative method of testing the cement grouts, as there are differences in the activation energies of the cement and slag which change their relative reactivities as a function of reaction temperature [Citation7]. Having said this, both calorimetry methods do show similar results across the different w/s ratios which suggest that for this system that water content can be considered an insignificant contributing factor.
Comparison of the calorimetric methods
The results of the two calorimetric methods were analysed in order to compare a series of characteristics of the techniques and determine the relationship between them. The relationships compared were the semi-adiabatic temperature rise against different parameters from the isothermal calorimetry tests: the isothermal total heat evolution at 24 h, the isothermal peak heat flow, and the slope of the isothermal peak (i.e. the rate). The isothermal rate was also compared to the slope of the semi-adiabatic peak.
The comparison between the rates of both calorimetry methods produced rather a poor correlation, as shown in .
Figure 3. Relationship between the rate of the semi-adiabatic temperature curve and the rate of the isothermal heat flow curve measured for all of the formulations in .
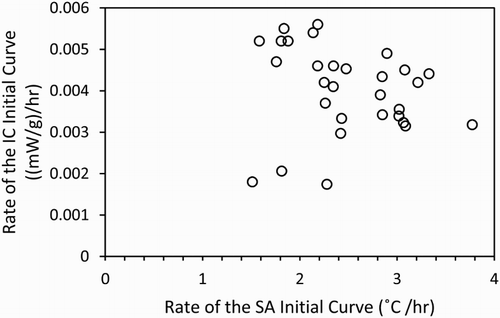
It is clear from the wide scatter of data points the rates of the two techniques do not correlate well. It may be expected, due to the similarities between the chemical processes which drive both the temperature and heat flow profiles that these two measures of the rate of reaction would form a close correlation, but this does not seem to be the case here.
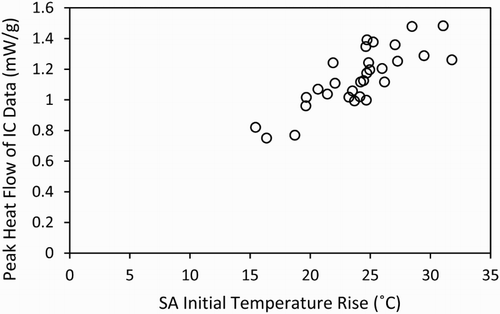
However, the peak heat flow values for these blends measured using isothermal calorimetry do show a very good correlation to the initial semi-adiabatic temperature rise, shown in . Here the maximum values obtained through both test methods are compared, and show a clear link to one another. This is a positive outcome for the reliability of the isothermal test method, regarding its use as a potential standard technique for measuring the heat evolution of cementitious material, and which requires significantly smaller volumes of material (and much less labour-intensive calibration protocols) than the semi-adiabatic tests.
Figure 4. Correlation of the initial temperature rise in the semi-adiabatic calorimetry tests and the peak heat flow from the isothermal calorimetry tests of all of the mixes from .
Both sets of calorimetry results show that the main hydration peak of the reaction occurs within the first 24 h of the test, consistent with widely reported data for Portland cement [Citation13], and indicating that the early stages of reaction are dominated by cement hydration, with the slag only beginning to react during this timeframe once sufficient portlandite has been generated. The Sellafield Ltd specification requires that the grout should not have a cumulative heat output greater than 180 kJ per kg of blended cement powder after 24 h at 35°C [Citation15]. Therefore, the final correlation discussed in this paper is shown in , and describes the relationship between the total heat evolution of the isothermal calorimetry curve at 24 h, and the initial temperature rise in the semi-adiabatic calorimetry data.
Figure 5. Relationship between the initial temperature rise in the semi-adiabatic calorimetry tests and the total heat evolution of the isothermal calorimetry data at 24 h, for all of the mixes in .
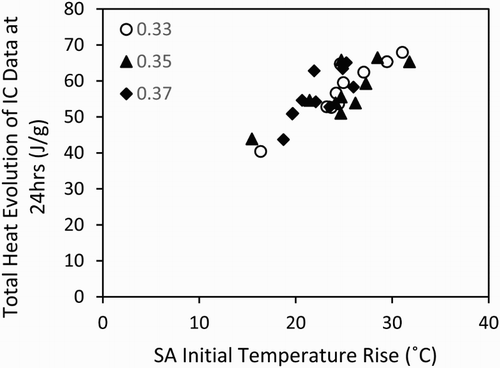
From , it may be noted that although the isothermal calorimetry testing was not carried out at 35°C, all of the cement grouts produced in this study should conform appropriately to this aspect of the Sellafield Ltd specification. The correlation within this plot is quite close to linear, without any systematic error due to differences in the w/s ratios.
By comparing a series of characteristics of the two methods it was possible to determine how comparable the results of the two calorimetric techniques. Overall, there is a positive correlation between the two techniques, which confirms the ability to use isothermal calorimetry as a standard method to measure the heat of hydration of cementitious materials, with significant potential practical advantages over semi-adiabatic calorimetry regarding the sample size and instrument stability during measurement.
Conclusions
The hydration rate of the BFS:PC system is affected by a change in the GGBS:Calumite blend ratio, due to changes in the particle size distribution, which has a chemical effect on the cement grout. Further development is required to understand exactly what the reaction pathway is in these systems, to interpret the influence of the changes in the PSD of the slag component on the properties of the grout in both fresh and hardened states.
By comparing a series of characteristics of the semi-adiabatic and isothermal calorimetry methods, it was possible to determine comparisons between the results of the two calorimetric techniques. Overall, there is a positive correlation between the two techniques, which supports confidence in the use of isothermal calorimetry as a future standardised method to measure the heat of hydration of cementitious materials for the nuclear industry.
Although the semi-adiabatic calorimetry results provide good temperature profiles, some of the results are inconsistent, and the required sample volumes are large. The isothermal calorimetry provides a much more apparently reliable set of results using a method that is sensible and much more straightforward to standardise once a suitable instrument is purchased.
Acknowledgements
RAS is also grateful to Engineering Doctorate Centre at The University of Manchester and NNL for their support and supervision, and to Hanson Cement for supplying materials.
Disclosure statement
No potential conflict of interest was reported by the authors.
ORCID
John L. Provis http://orcid.org/0000-0003-3372-8922
Additional information
Funding
References
- Nuclear Decommissioning Authority and Department of Energy & Climate Change. 2013 UK radioactive waste inventory: waste quantities from all sources. Prepared by Amec and Pöyry Energy. 2013.
- Sharp JH, Hill J, Milestone NB, et al. Cementitious systems for encapsulation of intermediate level waste. The 9th International Conference on Radioactive Waste Management and Environmental Remediation; 21–25 September 2003; Oxford, England.
- Cann GM, Carruthers K, McLuckie BH, et al. Scunthorpe GGBS/calumite blend assessment for use in ILW encapsulation processes. NNL. 2011;11306(11):9–10.
- Nuclear Decommissioning Authority and Department of Energy & Climate Change. Radioactive wastes in the UK: a summary of the 2013 inventory. Prepared by Amec and Pöyry Energy. 2013.
- The British Standards Institution. BS EN 196-8:2010, Method of testing cement, part 8: heat of hydration - solution method. London: BSI Standards Limited; 2010.
- The British Standards Institution. BS EN 196-9:2010, Methods of testing cement, part 9: heat of hydration - semi-adiabatic method. London: BSI Standards Limited; 2010.
- Poole TS. Revision of test methods and specifications for controlling heat of hydration in hydraulic cement. PCA R&D Serial No.3007. Illinois: Portland Cement Association; 2007.
- The British Standards Institution. BS EN 197-1:2011, Cement, part 1: composition, specifications and conformity criteria for common cements. London: BSI Standards Limited; 2011.
- European Committee for Standardization. PD CEN/TR 16632:2014, Isothermal conduction calorimetry (ICC) for the determination of heat of hydration of cement: state of art report and recommendations. London: BSI Standards Publication; 2014.
- Wadsö L, Arndt M. An international round robin test on isothermal (conduction) calorimetry for measurement of three-day heat of hydration of cement. Cement Concrete Res. 2016;79:316–322. doi: 10.1016/j.cemconres.2015.10.004
- Farris S, Miller E, Wright E, et al. Alternative BFS suppliers. RAT. 2004;4134:14–16.
- The British Standards Institution. BS EN 14216:2015, Cement-Composition, specifications and conformity criteria for very low heat special cements. London: BSI Standards Publication; 2015.
- Bullard JW, Jennings HM, Livingston RA, et al. Mechanisms of cement hydration. Cement Concrete Res. 2011;41(12):1208–1223. doi: 10.1016/j.cemconres.2010.09.011
- Scrivener KL, Juilland P, Monteiro PJM. Advances in understanding hydration of Portland cement. Cement Concrete Res. 2015;78:38–56. doi: 10.1016/j.cemconres.2015.05.025
- Jowsey J. Blast furnace slag for Sellafield encapsulation plants: technical specification. 2012.