
 ?Mathematical formulae have been encoded as MathML and are displayed in this HTML version using MathJax in order to improve their display. Uncheck the box to turn MathJax off. This feature requires Javascript. Click on a formula to zoom.
ABSTRACT
In this paper, we approach modelling mathematics dispositions from a different methodological perspective in order to shed more light into the complex interplay between teaching practices and students’ learning outcomes. We draw on survey data from around 5000 students from Year 7–11 (age 11–16) from 40 Secondary schools in England. Our methodological approach includes Rasch modelling to produce measures of attitudinal outcomes as well as students’ perceptions of pedagogic practices. We then employ fuzzy-set Qualitative Comparative Analysis (fs/QCA) to explore the relationships between students’ characteristics and the perceived type of teaching they receive in mathematics. We use two measures of ‘transmissionist teaching’ which aim to quantify the degree to which teaching practices are perceived as ‘teacher-centred’. One measure gives the students’ perceptions and the other gives the teacher’s perspective. We find that different configurations of student and teacher perceptions of transmissionist teaching are associated with high and low mathematical dispositions for different year groups and for boys and girls. We discuss the methodological merits of this approach along with the substantive educational implications of these findings.
Introduction: overview of literature and context of this study
Mathematics as a topic in the school curriculum is considered important, if not vital, for students’ potential access to further study in Science, Technology, Engineering and Mathematics (STEM) subjects, and also many fields in the Social Sciences (e.g. Business, Economics, etc) in Higher education, and consequently to their educational and socioeconomic life opportunities. The need to promote a mathematically engaged society is also well documented in literature and recent policy documents in the UK (OFSTED Citation2011; Smith Citation2017) and globally (see Mevarech and Kramarski Citation2014). The Advisory Committee on Mathematics Education (ACME) (ACME Citation2012, Citation2009) recognized this important issue and advocated ‘tackling the perceptions of mathematics’ as a particularly important issue placing emphasis on the importance of mathematics as a ‘powerful analytical tool’, with inherent ‘pervasiveness’ (Citation2009, 5) and a ‘key workforce skill’ (ibid, p. 6). Looking beyond attainment, research on attitudes towards mathematics (and dispositions) is very important and has gained considerable interest over the past 40 years because it may reveal key influences on students’ choices and decision-making and hence their future engagement with STEMFootnote1; this is our emphasis here.
The complex field of attitudes and dispositions towards mathematics
The field of ‘attitudes towards mathematics’ has seen numerous adaptations of instruments (e.g Hemmings and Kay Citation2010; Kleanthous and Williams Citation2013; Lim and Chapman Citation2013) mainly influenced by the well-known Fennema-Sherman scales (Fennema and Sherman Citation1977). Relevant studies and resulting research findings have focused on one or more from many ‘dimensions’, including beliefs, values, identities, engagement, affect, emotions, motivation, confidence, self-efficacy, and dispositions (Di Martino and Zan Citation2011; Hannula Citation2002; Ruffell, Mason, and Allen Citation1998). This complexity, as well as the lack of agreement on the definition of the construct has led researchers (e.g. Lim and Chapman Citation2013; Wilson Citation2011) to recently revisit the established instruments of the 1970s and 1980s looking for alternative universal definitions or more parsimonious instruments.
Previous studies had also identified a plethora of socio-cultural factors which are significant in shaping students’ dispositions and choice-making in education in general, and in STEM subjects and mathematics in particular: for example class, gender, nationality, ethnicity, parental and peer cultures as well as the intersectionality between these variables (e.g. Cao et al. Citation2006; Lei and Pampaka Citation2018; Mendick Citation2005; O’Brien, Martinez-Pons, and Kopala Citation1999). It is not our intention here to rehearse these discussions, nor to propose an alternative definition of ‘attitudes’ towards mathematics. Rather, we follow the paradigm introduced and validated in our earlier work with post-secondary students, where instruments were developed for measuring dispositions towards further study (Pampaka et al. Citation2013, Citation2011); adapting and revalidating these for secondary-school students (Lei and Pampaka Citation2019; Pampaka and Wo Citation2014).
The relationship between teaching practices and dispositions
The quality of mathematics teaching is an important factor in understanding students’ dispositions, Within this literature (Askew et al. Citation1997; Driessen and Sleegers Citation2000; McCaffrey et al. Citation2001; Schuh Citation2004; Swan Citation2006; Swanson and Stevenson Citation2002; Vermunt and Verloop Citation1999) it has been widely accepted that effective mathematics teaching should be ‘connectionist’ in two ways: (a) connecting teaching to students’ mathematical understanding, and (b) connecting teaching and learning across mathematics’ topics, and between mathematics and other knowledge. Many others have also argued that formative assessment and more dialogical pedagogies are required for the development of deeper mathematics understanding (e.g. Black and Wiliam Citation1998; Boaler Citation2002; Lapointe, Legault, and Batiste Citation2005; Meece, Herman, and McCombs Citation2003; Ryan and Williams Citation2007; Wilkins and Ma Citation2003). Such approaches are thought to be the opposite to more ‘transmissionist’ practices where mathematical knowledge is compartmentalized and treated as separate from other subjects and from students’ own context. In previous work we have shown how some institutional and pedagogic practices can encourage the reduction of the learning of mathematics to the procedural level only, thus limiting future educational opportunities. In this work, we have used and ‘quantified’ the terms ‘connectionist’ and ‘transmissionist’ teaching, employing Swan’s previously developed instrument (Swan Citation2006), which in turn built on the research findings of Askew et al. (Citation1997) and Ernest (Citation1991). Pampaka et al. (Citation2012) described in detail how the items of Swan’s (Citation2006) ‘practice scale’ could be amended to create a unidimensional measure of ‘teacher centricism’ (or transmissionism) in teaching mathematics which was successful in associating transmissionist practices with the decline of students’ dispositions over time.
But there is still an unresolved gap in knowledge in regards to the developing students’ mathematics dispositions and how these are shaped in relation to teaching at earlier educational stages. This was the ultimate aim of the project we draw from here.
Studying and modelling dispositions
Quantitative studies of attitudes and dispositions to mathematics tend to employ analytical techniques such as latent class analysis (Lazarides and Ittel Citation2012), and regression modelling (Mata, Monteiro, and Peixoto Citation2012) as in our previous work (Pampaka and Williams Citation2016). These approaches provide good summaries of whether a particular attitude is strongly associated with an outcome ‘in general’ by testing the strength of the association for all the respondents. This assumes that some general relationship may exist between attitudes, perceptions of processes/practices and outcomes and also that these variables used as explanatory variables or predictors in such models are independent from each other, an assumption hard to meet with social constructs and for social phenomena. In previous work, teaching was perceived as more transmissionist by female students and by older students but teacher perceived transmissionism was not always significantly associated with dispositions (Pampaka and Williams Citation2016). Despite finding some statistically significant associations between these variables, the predictive power of the models overall was not particularly high. One potential explanation of this could be that subgroups in the model (such as students in different years) had different associative relationships with the outcome and other variables in the model, which a model for the whole sample failed to capture well. Even though sub-group analysis could probably highlight some of these differing relationships, such partitioning of the whole sample is not always desirable. The same complexity has also been observed with other models and with other similar datasets, especially when it comes to identifying and interpreting interaction effects (Gabriel, Signolet, and Westwell Citation2018; Lei and Pampaka Citation2019, Citation2018; Pampaka et al. Citation2018).
We want thus to investigate further whether different attitudes and practices combine in particular ways to influence a student’s dispositions towards mathematics and whether the ways in which they combine may be different for different subgroups of the dataset. An approach that can help us to understand whether these different patterns exist for different subgroups is Qualitative Comparative Analysis (QCA) – a set-theoretic method of data analysis that does not assume linear relationships between explanatory and outcome variables. To our knowledge, there is no previous work reported in modelling (mathematics) dispositions using a QCA approach. In fact, there are only a limited number of papers in education in general which use QCA; see for example the work of Cooper and Glaesser (Cooper and Glaesser Citation2010; Glaesser Citation2008; Glaesser and Cooper Citation2012a, Citation2012b), Thomson (Citation2011a, Citation2011b), and the very recent and timely paper of Bingham, Dean, and Castillo (Citation2019). We aim to add to this literature base by demonstrating how QCA combined with interval measures can be used to explore complex relationships between attitudes and other outcomes and what this approach might reveal in addition to findings from other types of analyses. In this paper, we are mainly interested in modelling dispositions as the outcome whereas the majority of studies dealing with maths dispositions or other affective factors usually focus on modelling their effect on mathematics performance and attainment (e.g. Grootenboer and Hemmings Citation2007; Hemmings and Kay Citation2010).
The paper draws on data from a longitudinal (survey) study of teaching and learning secondary mathematics focusing on the impact of pedagogical practices on important learning outcomes in UK. The particular research questions that guide this paper are as follows:
RQ1: How can QCA be combined with interval scores from Rasch modelling to inform our understanding of complex educational relationships? (methodological)
RQ2: What conditions/combinations of students’ characteristics, attitudinal learning outcomes and perceptions of teaching practice can explain whether students will have high or low dispositions towards mathematics during their secondary education? (substantive)
Methodology
Instrumentation and sample
This longitudinal, school-level (for selection purposes) study employed a varied sampling frame to ensure maximum coverage of the schools of England. In total, we approached over 2200 schools and we were able to establish collaboration with 40 of them to participate at least on the first data point.Footnote2 We note here issues around self-selection bias in this type of studies, which could limit the representativeness of the achieved sample.Footnote3
Data collection in these schools involved a student questionnaire (at three data points) with questions about students’ attitudes to mathematics, future aspirations, and their perceptions of the teaching they encounter. Teacher perceptions of teaching were also captured through a separate survey administered to respondents’ mathematics teachers. Student questionnaires were based on different versions of the same instrument to reflect the age and level of students (i.e. 5 different Year Groups, years 7–11). Background variables and information on students’ attainment were also collected. The various sections of the questionnaire capturing teaching and learning perceptions were constructed based on a previous project framework, Transmaths (www.transmaths.org), where instruments for students aged 16 and older were validated and used (Pampaka et al. Citation2013, Citation2012, Citation2011).
This analysis draws on the first data point (DP1, out of three) of our longitudinal survey of students and their mathematics teachers. This data collection took place from October to December 2011. During this period we collected data from a sample of 13,643 students in 40 schools. As per our usual measurement practice the construction of the measures, and their consequent calibration for the purposes of this analysis, has been conducted with all available data. From this DP1 we then analyse the responses on a complete case analysis (i.e. those with responses in all relevant variables). The resulting sample consists of 5022 students: 2988 girls (59%) and 2034 boys (41%). This was a pragmatic decision to facilitate the demonstration of this novel methodological approach and also allows comparisons between previous work which was based on the same sub-sample. We acknowledge the potential limitations of this decision, but dealing with missing data as we would have done with traditional modelling approaches (Pampaka, Hutcheson, and Williams Citation2016) goes beyond the scope of this paper.
Measurement methodology
Before any substantial analysis takes place, the first step we follow in our methodological approach is the validation of our constructed measures. This measurement step is based on the assumption that there are various underlying constructs behind the groups of items in the questionnaires, which were brought together after studying previous research literature and looking at other researchers’ instruments.
Given the students’ responses to the relevant questions we then attempt to validate these aforementioned constructs: in other words to check whether they exist as ‘measures’ (or scales), and if not if there are other dimensions relevant and useful. Our validation process, thus, refers to the accumulation of evidence to support validity arguments regarding the students’ reported measures (Messick Citation1988). We employed a psychometric analysis for this purpose, conducted within the Rasch measurement framework, following relevant guidelines (Wolfe and Smith Jr. Citation2007a, Citation2007b) and with the Rasch rating scale model, in particular, which is the most appropriate model for Likert type items, as in this project. Our decisions about the validity of the measures are based on different statistical indices, such as item fit statistics, category statistics, differential item functioning and person-item maps (Bond and Fox Citation2015). More information about the validation of the ‘mathematics disposition’ construct is presented elsewhere (Pampaka and Wo Citation2014). As also indicated earlier we have validated measures for both teachers’ and students’ perceptions of (the same) teaching practice. In particular we use here a measure of students’ perception of how transmissionist teaching is (which we call ‘student perceived transmissionism’ throughout) and of teacher’s perception of how transmissionist teaching is (which we call ‘teacher perceived transmissionism’ throughout) (see Pampaka and Williams Citation2016).
In the next section we introduce the QCA approach using generic/artificial examples before we move on to discuss how we used it within the context of this study.
Analytical approach for this paper - QCA
Rationale
Fuzzy-set qualitative comparative analysis (fs/QCA) is a case-based (rather than variable-oriented), set-theoretic method of data analysis that can be used with any size of dataset but is less commonly used with large-size datasets (Rihoux and Ragin Citation2009). It is used here to sort student data into types, based on combinations (called configurations) of student characteristics and then to assess which of these configurations are typically associated with high/low dispositions and the strength of the relationship. In our fs/QCA, the student characteristics, constructed from variables/measures in the original dataset, are conceived of as sets. Each case (i.e. student) has a membership score for every set, to indicate the degree to which that case ‘belongs’ to that set.
Using fs/QCA allows us to assume a situation where the relationships between student characteristics and dispositions may be complex and asymmetric and where there may be more than one configuration of characteristics showing a strong relationship with high (or low) maths dispositions (Ragin Citation2008a, Citation2008b). As we discussed earlier, there is every reason to expect our data to display such asymmetry and complexity as we are considering the conjunction of several related, but not identical, aspects of mathematical attitudes (Lei and Pampaka Citation2019; Pampaka, Hutcheson, and Williams Citation2016). We predict that there may only be a small number of students for whom the various aspects of mathematical attitudes do not line up but we are just as interested in the relationship between the particular configuration of these measures of attitudes and practices as their impact on dispositions. Such detail can be lost when employing a linear modelling approach as the fitted model is trying to show the best estimate for the effect of any variable (or interaction of variables) for all cases – i.e. assuming that it is sensible to calculate such a thing. Where we expect, as we do here, that attitudes and practices may have a different degree (or direction) of influence depending on what they are in conjunction with, then fs/QCA is an appropriate choice of analytic method. We assume that the interplay of characteristics may be crucial for the formation of mathematical dispositions and not just the levels or presence of the individual characteristics themselves. Regression-based approaches to analysis of this kind, however sophisticated, assume each factor/variable can have a unique effect on an outcome but, actually, what is established by models of this kind is an average, or ‘net-effect’, of a variable for all cases or a group of cases with random effects multi-level models (Ragin Citation2006a, 13).
QCA, according to Byrne (Citation2013) allows us to ‘get a handle on what works where (in what context), when (in what temporal context), and in what order’ (217). Regression-based approaches, even those which include interaction terms in an attempt to account for complexity, assume that variables in a model are capable of ‘influencing the level or probability of an outcome’ on their own (Ragin Citation2006a, 14). Standard multiplicative interaction terms, e.g. between variables A and B, can hide complexity behind a single value. For example, if variable A has value 1 and variable B has value 0.5, A*B = 0.5; but A*B would also equal 0.5 if A had value 0.5 and B had value 1. In fs/QCA, these two situations are treated as qualitatively different (see Vaisey Citation2007). In addition, we want to consider 3- and 4-way interactions between characteristics and attempting this within a linear-regression framework leads to a great deal of interpretative difficultly. Of course, it is possible that some characteristics may dominate to the extent that other characteristics matter very little and a fs/QCA approach allows us to see when this is the case.
Terminology
We will talk, throughout, about our measures of attitudes and practices as ‘characteristics’ of the cases (students) rather than ‘variables’ or ‘factors’ (partially, to avoid confusion with other analytic methods). We avoid the use of ‘variables’ to emphasise that we are, as Ragin (Citation2000, 65) describes, ‘assessing scores in context’ rather than automatically treating cases with similar scores on one characteristic as similar. We avoid using ‘factors’ so as to make clearer that our approach is not a form of factor analysis. In explanatory factor analysis, researchers are concerned with reducing the number of explanatory factors believing that the values in some small set of factors may be reflective of those in a wider set and thus that those values in the extra factors are redundant. In fs/QCA, although a process of simplification does occur, if a characteristic is minimised out of a solution term, this is because it, empirically, makes no difference to the outcome, in the presence of the other model characteristics. We can use this approach to see which particular combinations of students characteristics are necessary and/or sufficient for high dispositions in mathematics.
Constructing sets and assigning set membership scores for cases
As mentioned, QCA relies on conceiving our characteristics as sets and assigning a set-membership score, to each case, for that set. Sets can be crisp to indicate the presence (score membership = 1) or absence (score membership = 0) of a characteristic. This is more appropriate for binary categorical variables. Most usefully for the study of dispositions (and other similar continuous measures) sets can also be fuzzy and then cases can take any score between 0 and 1. For fuzzy sets, the score can be anything between 0 and 1 where 0 indicates complete non-membership in the set, 1 indicates complete membership and a value of 0.5 indicates that the case is neither in nor out of the set in question. In other words, the degree of set-membership gets larger as scores approach 1 and smaller as scores approach 0. The 0.5 value marks a qualitative threshold between cases that are definitely in the set (those with scores above 0.5) and those that are definitely out of it (those with scores below 0.5). If a case has a 0.5 value, it has not been possible to determine whether it definitely sits within the set or outside of it.
It is important to note here that calibration is not a simple re-coding. The researcher must develop a method and rationale for assigning set-membership scores to cases and this should be driven by information about the cases themselves. For this, researchers must decide which values in the original dataset correspond to the boundaries of the set (the 0, 0.5 and 1 values). They may choose to use meaningful values or summaries of the original variables to do this, depending on what makes sense in the context of the data and research aims. For example, if we were creating a calibrated set from an original set of test scores, we may decide that the ‘pass mark’ constitutes a reasonable value to equate to a set-membership score of 0.5. In this case, the created set would constitute the set of passes and set-membership scores approaching 1 would be those where the original scores were almost full marks. Another approach would be to equate the 0.5 set-membership score to a particular percentile in the original distribution of test scores. Equating, for example, the 80th percentile score to the 0.5 value would create a slightly different set – the set of high scores. The purpose of the analysis and properties of the data should drive the decision about calibration.
In our particular example, we can take advantage of the properties of the Rasch model to help us make decisions about how to calibrate because we have measures of mathematics dispositions created by the Rasch model. The examples above show, however, that other calibration methods are possible and sensible, even for large-n datasets, depending on the particular context. We explain more about our calibration procedures in section 3 but first explain some other important concepts in QCA.
Necessary and sufficient conditions
The concepts of sufficiency and necessity are central in the QCA approach: the membership scores, described earlier, can be used to examine whether certain configurations of characteristics can be considered necessary and/or sufficient for a given outcome. A necessary conditionFootnote4 for an outcome must be present for the outcome to be achieved/observed but may not be enough on its own to produce the outcome (Ragin Citation2008b, Citation2000). Similarly, if every instance of a characteristic, or configuration of characteristics, is followed by the outcome, we can say that that characteristic/configuration of characteristics is a sufficient condition for the outcome. In some cases, a condition may be necessary and sufficient and, in others, it may be neither necessary nor sufficient. A configuration is perfectly sufficient for an outcome if the set membership scores in it are less than the scores of the outcome set, for all cases – or, in other words, when the condition is a subset of the outcome set. When this relationship holds, every case that is in the configuration set is, by default, also in the outcome set. Similarly, a condition is perfectly necessary for an outcome if the set membership scores in the condition are greater than the scores of the outcome set, for all cases – or when the outcome is a subset of the condition set. When examining the social world, particularly, though not exclusively, when using large datasets, it is unusual to encounter such examples of perfect necessity or sufficiency. Instead, we allow the relationships between configuration and outcome sets to be less than perfectly necessary/sufficient because they allow us to determine whether a characteristic is, for example, ‘almost always’ sufficient, or quasi-sufficient (Ragin Citation2008b, Citation2000). In this way, we are looking for empirical evidence of relationships that may be causal in reality. Evidence of strong necessary and/or sufficient relationships (i.e. those approaching perfect necessity or sufficiency) between outcome and configurations could be evidence of a wider causal pattern though this analysis alone cannot provide definitive evidence of causality and any claims of causality should also make appeals to theory, research design, and other sources of evidence, as appropriate. In this paper, we will focus on relationships of sufficiency as these fit well with our substantive questions about which combinations of characteristics may be leading to high or low dispositions.
Using truth tables to understand the data
The dataset, then, must be calibrated to translate original values into crisp or fuzzy-set scores before QCA analysis can begin.Footnote5 Once the data has been calibrated, it can be analysed to determine whether there are any patterns indicating a relationship of quasi-necessity or quasi-sufficiency between characteristics.
is an example of a truth table, with made-up data, where ‘Male’, ‘Maths ability’, and ‘Maths confidence’ are characteristics being drawn upon to explain an outcome, ‘high Maths disposition’.Footnote6 has 8 (or 23) rows and shows all the possible combinations of ‘Male’, ‘Maths ability’, and ‘Maths confidence’ and each row represents a configuration. In the case of the set ‘Male’, where the characteristic is a crisp set, the 1’s and 0’s in the table simply indicate the presence or absence of this characteristic. So, for example, rows 1, 3, 4, and 6 represent boys and rows 2, 5, 7, and 8 represent girls. In , ‘Maths ability’ and ‘Maths confidence’ are fuzzy – so each row includes cases with a range of membership scores in these sets.Footnote7 The 1’s in in the ‘Maths ability’ and ‘Maths confidence’ columns indicate cases where the fuzzy membership score is greater than 0.5 and the 0’s are cases with a score of less than 0.5. So, row 1 represents boys with scores of greater than 0.5 in ‘Maths ability’ and ‘Maths confidence’. The rows of then, are intersections of sets or configurations and we write row 1 as MALE*MATHS ABILITY*MATHS CONFIDENCE with the operator ‘*’ indicating set intersection and the capital letters indicating the presence of a characteristic.Footnote8 Similarly, we use small letters to indicate the absence of a characteristic; row 2 could, thus, be written as male*MATHS ABILITY*MATHS CONFIDENCE.
Table 1. Example of a Truth Table.
The rows of , representing particular, separate configurations of characteristics, can be thought of as new sets and a case’s membership score in them can be calculated as the minimum of its membership scores in the component sets.Footnote9 The score of a case in row 1, MALE*MATHS ABILITY*MATHS CONFIDENCE, for example, would be the minimum of its scores in the sets ‘Male’, ‘Maths ability’, and ‘Maths confidence’. The consistency measure for Maths disposition tells us the extent to which these new sets, formed from intersections of the original sets, coincide with the outcome: here, a measure of maths disposition. Remember that each case has set membership scores for ‘Male’, ‘Maths ability’, ‘Maths confidence’, and ‘Maths Disposition’. If all of these were crisp sets, then the consistency of row 1 for ‘Maths Disposition’ would simply be the proportion of all cases in row 1 that also have a score of ‘1’ for ‘Maths disposition’. When considering fuzzy sets, the consistency formula:
calculates, for each truth table row, the score of a case in that row and assesses this against the case’s score for the outcome set, for all cases in the dataset. A consistency score of 1 would indicate that, all cases of that configuration, have smaller membership scores for the configuration than those for the outcome. A consistency score of 0 indicates that no cases of a configuration are smaller than that of the outcome. A consistency score between 0 and 1 indicates that some cases of a configuration have smaller score than that of the outcome – where the closer the score to 1, the higher the number of cases fulfilling this criterion.
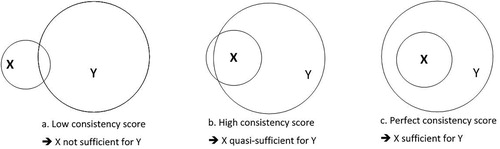
As analysts, we must make a judgement about what level of consistency threshold is acceptable to indicate quasi-sufficiency and this affects the results we produce.Footnote10 These ideas are summarized in where X can be any configuration of characteristics and Y is an outcome set., The situation in a cannot be thought of as quasi-sufficient as more of X is out of Y than in it (which would be indicated by a consistency score of less than 0.5). Choosing what score is acceptable to indicate quasi-sufficiency, is not always straightforward, however (Ragin Citation2000). We discuss the implications of this for our data in a later section.
Figure 1. Venn diagrams representing various degrees of sufficiency of X for Y.
Generating and interpreting solutions
As mentioned earlier, one of the benefits of using fs/QCA is that it can highlight asymmetric relationships between characteristics and outcomes. This, however, means that, when using fuzzy sets, the analysis for one outcome (e.g. high dispositions) cannot be used to derive a solution for the absence of the outcome (e.g. low dispositions). For example, is a truth table showing the degree to which configurations are sufficient for high maths dispositions. It would be wrong to immediately conclude from that row 8 is an example of a configuration leading to low dispositions. This is because, if we run an analysis for the absence of the outcome, i.e. low maths dispositions, we could find that the configuration in row 8 of does not have a consistency score high enough to warrant being described as sufficient for that outcome.Footnote11
If we select a consistency threshold of 0.85, we find that there are 2 rows which have consistency scores higher than this and therefore can be considered quasi-sufficient for Maths disposition. These are the rows representing the configurations MALE*MATHS ABILITY*MATHS CONFIDENCE and male*MATHS ABILITY*MATHS CONFIDENCE (rows 1 and 2 in ). To simplify, we can first produce a solution of the form
which shows that either boys or girls with high maths ability and high mathematical confidence consistently have high mathematical dispositions. It is possible to simplify this further by noticing that a case’s score in the set ‘MALE’ is not making a difference here – both ‘MALE’ and ‘male’ (i.e. female) are, in conjunction with high mathematical ability and high mathematical confidence (MATHS ABILITY*MATHS CONFIDENCE), is quasi-sufficient for high maths disposition.
So, our simplified solution is just MATHS ABILITY*MATHS CONFIDENCE → MATHS DISPOSITION. If we set the threshold at 0.8 instead, we would produce the simplified solution MALE*MATHS ABILITY + MATHS ABILITY*MATHS CONFIDENCE → MATHS DISPOSITION – a very different solution obtained by the decision to include only one more row than previously. Software packages for fs/QCA perform this act of Boolean simplification for more complicated truth tables by considering pairs of quasi-sufficient truth table rows together and eliminating redundant parts of terms until the simplest expression is found. This simple example reminds us, however, that it is our decisions about consistency thresholds that will determine which solution is generated.
How should we, then, evaluate which solution should be chosen as a good representation of the data? Each term (e.g each configuration) in a solution can be thought of as one route to the outcome. In situations such as the example above, it is helpful to know the ‘empirical importance’ of each of these routes as this can help us determine which of the solutions best explains the outcome (Ragin Citation2006b, 299). This can be found by calculating the ‘coverage’ of a configuration – a measure of how much of the outcome set coincides with the configuration in question. The coverage measure in QCA for the whole solution can be thought of as analogous to R2 measures in linear (regression) models as it gives a measure of how much of the outcome set is being explained by the configurations in the model. QCA solutions will also contain details of raw and unique coverage of each part of the solution or solution term. The unique coverage is the coverage specific to that term and so solution terms which have an element in common, such as MALE*MATHS ABILITY + MATHS ABILITY*MATHS CONFIDENCE from earlier, will have a unique coverage of 0. The raw coverage for solution terms is the amount of the outcome covered by that term. Solution terms which do not overlap with others will have equal raw and unique coverage scores.
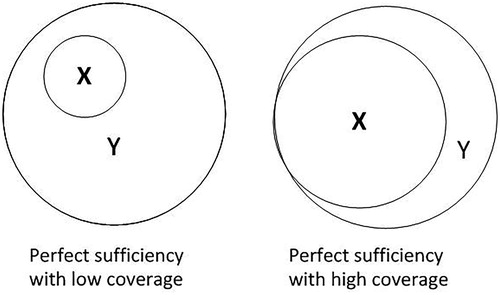
shows two instances of perfect sufficiency – one where coverage is low and another where it is high. Both these instances would have consistency scores of 1 but Y is being explained better by X in the right-hand diagram where the coverage score is higher and more of the set X is ‘covered’ by Y.
Figure 2. Venn diagrams showing low and high coverage.
Results
As already mentioned this analysis is focused on data from a complete case analysis of 5022 students in Years 7–11, with mathematics dispositions as the main outcome. In order to conduct QCA each case must have information in all of the possible characteristics – otherwise it is not possible to create a set-membership score in all sets and assign the case to its proper row in the truth table. Before the presentation of the main results we illustrate in more detail our calibration approach which was performed with the full DP1 dataset (N=13,643).
Calibration of variables/measures
The first step in QCA is to create sets (i.e. calibrate the measures). We outline our method and rationale below for each set in turn.
Gender is coded as a crisp set called ‘MALE’ where a score of 0 indicates girls and a score of 1 indicates boys. Our sample has a higher percentage of girls (59%) to boys (41%) but by creating this set we are able to see if relationships between transmissionist teaching practices and dispositions are different for girls and boys.
We use crisp sets as year dummies to investigate whether the results differ by year group and include four of these in the model (for years 7-10) since a score of zero in all of these will indicate that cases are in year 11.Footnote12 Ordinal variables cannot be translated into fuzzy sets in QCA as doing so would assign a distance between levels that does not necessarily exist in the original variable.
Fuzzy-sets are then created for each of the attitudinal measures of mathematics identity, mathematical self-efficacy and mathematics disposition using the QCA package in R (Dusa Citation2019). As noted earlier, for continuous measures the researcher must choose an approach to calibration that is meaningful in their context. In our dataset, these measures have been constructed using the Rasch model, which produces interval measures in logits, with scores ranging from negative values through to positive values centred around zero. If a student in our dataset, for example, scores 0 on the measure of mathematics disposition, this can be taken to be indicative that that student has neither high nor low mathematics dispositions.
As the starting point of our calibration process we argue that the concept of a zero score in a Rasch measure (i.e. the expected centre of its distribution) is analogous to the concept of a set membership score of 0.5 in fuzzy set theory and so, for all our measures, we translate scores of zero in the original measure to 0.5 in the resulting fuzzy-set. The next step in calibration is to decide the upper and lower thresholds in the original measures that will correspond to complete set-membership or non-membership of the sets. We set these boundaries at less than/more than the mean plus 1 standard deviation – indicating that these cases are far enough away from the actual centre value to indicate complete set non-membership or full set-membership respectively This calibration decision was the result of an iterative process where different calibration thresholds were tried and discussed by the authors using graphical methods to help understand their differences. It is this researcher control over calibration that provides an important qualitative dimension to QCA and is often the part that researchers find most challenging (Russo and Confente Citation2019).
Our aim, when choosing the final thresholds was 1) to minimise the effect of very high and low original measures on the calibration, 2) to use the information contained in the original Rasch scores to determine what Rasch scores equate to ‘very high’ or ‘very low’ set-membership scores and 3) to account for the Rasch scores in our complete cases sample dataset not being (perfectly) normally distributed (i.e. with scales where the mean was not the expected 0). Our decision to set the thresholds for full set-membership and non-membership to the mean + 1 standard deviation fulfils these criteria. It is well known that the calibration chosen can effect results (Glaesser and Cooper Citation2014; Skaaning Citation2011) and so we also checked the effect of changing this slightly on the results generated to ensure they were stable. This transformation of the Rasch scores into fuzzy sets is demonstrated in for the maths disposition measure.
Figure 3. Distribution of original Rasch score and calibrated fuzzy set for maths disposition.
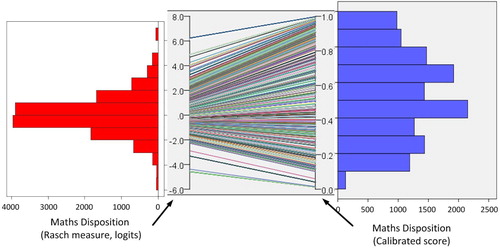
Practically, once the thresholds were chosen we used the QCA package in R (Dusa Citation2019) to calibrate our fuzzy sets. This function requires 4 inputs – the data to be calibrated and the values corresponding to 0, 0.5 and 1 in the new set. With these inputs, it uses the empirical cumulative distribution function to create the new set membership scores. It is important to note here that this function will not automatically assign a score of exactly 0 or 1 so some variation is still preserved at the extremes of the distribution of set membership scores. For our purposes, we were content to retain some distinction between the extreme values.
illustrates clearly that set calibration is not merely a straightforward translation of the data to the (0,1) interval. In our calibration, for example, several values at the extremes of the original distribution have been calibrated to have set membership scores very close to 0 or 1. We do this because we think, for example, that very small values on the original disposition measure indicate roughly the same thing and it would be unwise to exaggerate the differences between them in our calibrated measure. However, because we considered 0 as the expected centre of the scores and thus denoted values above or below zero as qualitatively different (i.e. high and low dispositions respectively), we want the differences between these to be reflected in our final calibration.
Solutions
Next, we organise the cases in the dataset into a truth table (not shown) according to their set-membership scores in each of our created sets and then solutions are generated from the truth tables using the approach outlined earlier. For both high dispositions and low dispositions, solutions were generated with a consistency threshold of 0.68. Choosing a consistency threshold is another qualitative decision by the researchers and we note here that ours is lower than is usual in the (predominantly small-n) QCA literature which is reflected in the strength of the relationships detected. As discussed earlier, there is a trade-off between consistency and coverage with high consistency often yielding very low coverage scores. This was the case in our analysis where higher consistency thresholds either yielded no solutions or solutions about one year group only.
Both these analytic processes were carried out using the QCA package in R (Dusa Citation2019). The results for both the outcome (high disposition) and the negated outcome (low dispositions) are presented in and , respectively.
Table 2. Results for high dispositions.
Table 3. Results for low dispositions.
shows that there are different solutions for different year groups – confirming our suspicion that the associations found in earlier work (see Pampaka and Williams Citation2016) provide better explanations for some year groups than others. For those in years 7 and 8, low scores in the ‘student perceived transmissionist’ measure are quasi-sufficient for high mathematical dispositions though the consistency score for year 7 is higher than that of year 8 – suggesting that the relationship between low student perceived transmissionist scores and high dispositions is weaker for the year 8 students. This also suggests that if girls perceive their mathematics teaching to be transmissionist at this age, they will not want to keep studying it (as reflected in lower dispositions).
Another similarity between the results of those in year 7 and 8 is that being male is quasi-sufficient for high dispositions – i.e. regardless of their scores in the transmissionist measures, boys generally have high mathematical dispositions at this educational stage. Again, as with the student perceived transmissionist measure, the strength of the relationship is weaker for those in year 8 than in year 7. This should not be taken to mean that there are not girls in these year groups with high mathematical dispositions – merely that there is no overall relationship between the terms in the model that holds in general for girls. In other words, the girls in the group show sufficiently different relationships between their perceptions of teaching practices and their dispositions that a good summary for the group of girls in these years overall is not possible.
Similarly, there are no quasi-sufficient relationships in the solution for students in years 9 and 11. Again, this should not be taken to mean that there are not students in years 9 and 11 with high dispositions but that the factors we have modelled have an inconclusive relationship with mathematical dispositions for these year groups.
For students in year 10, there is a more complex relationship between the measures of perceived transmissionism, gender and dispositions. For male students in this year, it is quasi-sufficient for high dispositions to have either low scores in the student transmissionist measure or the teacher one. This is the only year group where the teacher measure shows any sort of relationship with dispositions which could explain why it appeared to be not statistically significant in our earlier work using regression modelling (Pampaka and Williams Citation2016). Considering the sample as a whole in a regression model would show such a small association between this teacher perceived transmissionism and dispositions because there is no clear relationship except for students in year 10.
Considering the solution as a whole, the coverage score of 0.58 means that most of the individual cases have been explained using one (or more) of the individual solution terms in .Footnote13 However, many cases still have not and this will be largely due to there being no terms in the solution that explain high dispositions for students in years 9 and 11.
shows the results for an analysis of low dispositions. Again, we find results that differ by year group but that, unlike for high dispositions, there are some relationships for each year group in the sample.
For female students in year 7, having high scores in the teacher perceived transmissionist and the student perceived transmissionist measure is quasi-sufficient for low dispositions. This is interesting because it suggests that high scores in either is not quasi-sufficient for low dispositions but having high scores in both is. In earlier work, we found that the younger students in the sample generally had higher dispositions towards mathematics than those in years 10 and 11 (see Pampaka and Williams Citation2016). Therefore it makes sense that those with low dispositions are those with a particular set of circumstances – high teacher and student perceptions of transmissionist teaching. In this case, it is boys who have an inconclusive relationship between their transmissionist scores and their dispositions.
For female students in year 8, having a high score only in the student perceived transmissionist measure is quasi-sufficient for low dispositions. Considering the results for high dispositions for year 8 students along with these results we see that, for girls in year 8, there is an almost symmetrical relationship between their perception of whether teaching is transmissionist and their dispositions. In other words, girls in year 8 with perceptions that the teaching they receive is not very transmissionist have high dispositions but those who perceive their teaching to be transmissionist have low dispositions. For boys, the relationship between their perceptions of transmissionist teaching and dispositions is asymmetrical: when they perceive the teaching they encounter to have low levels of tranmissionism, they have high dispositions but perceived high level of transmissionism does not necessarily lead to low dispositions for them.
For female students in years 9 and 10, the transmissionist or otherwise nature of teaching has no relationship with their dispositions – these are low regardless. This is also the case for male students in year 11 though the strength of the consistency relationship is weaker than it is for the girls in years 9 and 10. Further work is needed to explore these results as they show a possible relationship between curriculum stage, gender and dispositions.
In , we see that students’ perceptions of high student transmissionism is quasi-sufficient for low dispositions for both boys and girls in years 9 and 11. For students in year 11, high levels of teacher transmissionism alone are quasi-sufficient for low dispositions. We suggest possible reasons for this in the discussion section.
Discussion
Methodologically, our contribution in this paper has thus been two-fold: (a) we demonstrated how a set-theoretic approach such as QCA can be used in education and in particular with dispositional measures to understand more about their configuration/formation in students’ secondary education, and (b) we have also showed for the first time how this approach can be combined with the results of measurement models (i.e. Rasch). One might ask regarding the former: what’s the extra benefit of using this approach? Our earlier work using only linear models (as well as the model presented in Appendix 1), did not alert us to the asymmetry shown here. In particular, relationships between, for example, gender and dispositions for different year groups were averaged out in the previous linear model – leading us to conclude that girls had lower dispositions in general. shows us that, for students in year 11, the opposite relationship holds.
In our QCA, the process of calibration has been aided by the use of measurement theory which was employed to construct the original measures used in the model. Thus, we can proceed to calibrate the measures into fuzzy sets using some external criteria knowing that this will be meaningful. Without this, we would have to consider a relative calibration of the measures – obtained by equating 0.5 in the fuzzy set with some centre-point in each measure (e.g. the mean). Any interpretation of the results would have to reflect this – for example, we would talk of ‘high mathematical disposition for this group’ rather than ‘high mathematical disposition’ in general. It would then be hard to say what the applicability of the results would be to other populations of students. The use of the Rasch scores addresses thus a key methodological issue that arises when QCA to large sample size datasets, which is how to replicate the kind of case-level familiarity that is possible with small sample size datasets and avoid error in the coding of cases (see Fiss, Sharapov, and Cronqvist Citation2013). As scores constructed through Rasch measurement have already undergone a process of validation, the conversion of item responses into a score makes this score robust quantitatively and also meaningful qualitatively.
Given the novelty of the approach and its implementation in educational research there are some further methodological issues to be noted.
The first point is the unavoidable comparison of the method with more straightforward approaches like regression models. For the interested reader we provide the results of two regression models with the same variables and with the same sample in Appendix 1 – one with interaction terms and one without - but opt out of direct comparisons as this cancels out our initial intention (i.e. to show the potential of combining Rasch measurement with QCA to explain complicated relationships between attitudes to mathematics) and because these models are not directly comparable with a QCA model. It is worth mentioning that interaction terms in regression models behave slightly differently to the configurations in QCA as interaction terms assume a symmetric relationship whereas conjunctions of characteristics do not (see Thiem, Baumgartner, and Bol Citation2016 for a very detailed and extended comparison of the two).
Debate is also ongoing between QCA users as to whether multilevel data, such as this, needs to be analysed differently or can be analysed using a standard QCA approach. Denk (Citation2010) was the first, to our knowledge, to propose an adapted QCA procedure for multilevel data but, as Rohlfing (Citation2012) argues persuasively, this can often lead to unnecessarily complex solutions which offer little added insight balanced against their more challenging interpretation. Rohlfing (Citation2012) also argues, as would we, that standard QCA shows if any configurations across systems (in this case, schools) typically have a relationship with the outcome in question.
Substantively, one could ask ‘what this novel analytical approach adds to our knowledge about students’ mathematics dispositions at secondary school?’ Our configurational analysis indicates interesting substantial findings regarding the formation of maths disposition at the different stages of formal secondary education. First, we see that transmissionist teaching does not necessarily lead to high or low dispositions in general – but that in conjunction with other characteristics and particular school stages, both transmissionist and non-transmissionist teaching practices are associated with both high and low dispositions.
As with previous results, student perceptions of whether teaching is transmissionist or not seems to be more strongly connected with dispositions (Pampaka and Williams Citation2016). However, the approach taken here allows us to understand the complexity of this relationship. In earlier work, we found that the year 7 students in the sample generally had higher dispositions towards mathematics than those in years 10 and 11 (Pampaka and Williams Citation2016). Our results here show that year 7 students with low dispositions are typically female students with high student and teacher perceptions of transmissionist teaching and whilst they may not make up the majority of the year 7 cohort, their experiences can be pinpointed using this approach.
Second, we can also identify that, for particular sub-groups of students, teacher perceptions of transmissionist practices may explain dispositions. The association of teaching related variables with students’ disposition has been recently explored in post-secondary maths (Pampaka et al. Citation2018) and in regards to its complex effect on mathematics self-efficacy (Lei and Pampaka Citation2018; Citation2019). Riconscente (Citation2014) also recently found that teacher-related variables contribute to students’ interest, self-efficacy and achievement after controlling for demographics and initial levels of interest and self-efficacy, with a sample of Latino students in USA.
Third, the relationship between the teacher measures and dispositions seems to be strongest for year 11 and may be related to the increased emphasis on formal assessment in the later stages of secondary school. In England, GCSEs are taken by most students in year 11 but students will study towards them from year 10. For students in year 11, high levels of teacher transmissionism alone are quasi-sufficient for low dispositions and this may be a result of the pressure on teachers to prepare students for high-stakes examinations in this year.
Conclusion
Our paper has shown that the relationship between student perceptions of teaching/learning experience, teaching practices and mathematical dispositions is complex. Such complexity is common in educational research and a challenge for researchers to explore; nevertheless, this complexity can be understood by employing QCA as an analytical technique especially when used in combination with other qualitative and quantitative methods. This paper is seminal in that it introduces the fs/QCA with a practical real example with a large dataset and also in combination with interval measures. As the measures themselves have been validated using the Rasch model, our use of them here allows us to say something in general about student dispositions and the relationships with perceptions of teaching/learning experience and perceived practices.
We have discussed in depth how this method works and drawn attention to a particular stage of analysis – the calibration stage – that usually requires the researcher to make a judgement about how the raw data should be transformed into a collection of set-membership scores. In our case, this decision is informed by measurement theory as the measures of attitudes and practices in our original dataset have a meaningful zero value and upper and lower bounds that produce sensible analogues for the set-membership scores of 0 and 1.
By exploring the solutions for both high and low dispositions, we find that these relationships are asymmetric and differ by year group and gender. Identifying these differences allows for interventions to be more precisely targeted and suggests that for some groups of students, transmissionist teaching may be more damaging to their dispositions than for others.
Disclosure statement
No potential conflict of interest was reported by the author(s).
Correction Statement
This article has been republished with minor changes. These changes do not impact the academic content of the article.
Additional information
Funding
Notes
1 There is not space here to detail the literature on students’ dispositions and why the study of them is important but see Allexsaht-Snider and Hart (Citation2001), Archer et al. (Citation2005), Brown, Brown, and Bibby (Citation2008) and Pustjens et al. (Citation2004) for more on this.
2 This was complemented by interview data collected from students and teachers in two case study schools. We focus here on the analysis of the survey data from the 40 schools that participated in the study from the start, and not this interview data.
3 A recent MSc dissertation had focused on the implications of missing data on national comparability and did not find evidence of bias (Brown Citation2017).
4 A condition may be one characteristic or a configuration of characteristics.
5 More details about the specific calibration process for this analysis are provided later in the paper, in the results section.
6 A corresponding analysis could be done for ‘low maths disposition’. A case’s score in the set ‘low maths disposition’ can be calculated from the formula: 1-(score in ‘high maths disposition’).
7 Note here that QCA will allocate cases to rows in the truth table (or to analytic types) based on their set membership scores in different sets. This will produce ‘clusters’ of cases of a similar type but the allocation of cases to types is not affected by the distribution of set-membership scores as it would be if conducting a cluster analysis. See Cooper and Glaesser (Citation2010) for a detailed exploration of the differences between fsQCA and fuzzy cluster analysis.
8 This is standard QCA notation and will be adopted throughout.
9 As explained earlier, this is not the same as a creating a multiplicative interaction term in a regression model.
10 Throughout, we will refer to all situations where the sufficiency relationships deduced are not perfect as quasi-sufficiency
11 To do this, fuzzy set scores in the ‘negated outcome’ are calculated from the formula: (1-score in outcome). Then analysis proceeds as above.
12 The alternative is to include all years as crisp sets but then have many redundant rows which contain non-possible scenarios e.g. being in years 7 and 8.
13 Note that this does not equate to 58% of cases.
References
- ACME. 2009. The Mathematics Education Landscape in 2009. London: Advisory Committe on Mathematics Education - Royal Society.
- ACME. 2012. Raising the bar: Developing Able Young Mathematicians. London: ACME.
- Allexsaht-Snider, M., and Laurie E. Hart. 2001. ““Mathematics for All”: How Do We Get There?” Theory Into Practice 40: 93–101.
- Archer, L., A. Halsall, S. Hollingworth, and H. Mendick. 2005. “Dropping out and Drifting Away”: an Investigation of Factors Affecting Inner-City Pupils’ Identifies, Aspirations and Post-16 Routes. London: Institute for Policy Studies in Education.
- Askew, M., M. Brown, V. Rhodes, D. Wiliam, and D. Johnson. 1997. Effective Teachers of Numeracy - Report of a Study Carried out for the Teacher Training Agency. London: King’s College London.
- Bingham, A. J., S. Dean, and J. Castillo. 2019. “Qualitative Comparative Analysis in Educational Policy Research: Procedures, Processes, and Possibilities.” Methodological Innovations 12: 2059799119840982. doi:https://doi.org/10.1177/2059799119840982.
- Black, P., and D. Wiliam. 1998. Inside the Black box: Raising Standards Through Classroom Assessment. London: King’s College.
- Boaler, J. 2002. Experiencing School Mathematics: Traditional and Reform Approaches to Teaching and Their Impact on Student Learning. New Jersey: Lawrence Erlbaum Associates.
- Bond, T. G., and C. M. Fox. 2015. Applying the Rasch Model: Fundamental Measurement in the Human Sciences. 3rd ed. NJ: Lawrence Erlbaum Associates Inc.
- Brown, D. 2017. An analysis of the effect of missing data on the results and sample composition of a longitudinal study into maths teaching and learning (MSc). University of Manchester.
- Brown, M., P. Brown, and T. Bibby. 2008. ““I Would Rather die”: Reasons Given by 16-Year-Olds for not Continuing Their Study of Mathematics:.” Research in Mathematics Education 10: 3–18. doi:https://doi.org/10.1080/14794800801915814.
- Byrne, D. 2013. “Evaluating Complex Social Interventions in a Complex World.” Evaluation 19: 217–228.
- Cooper, B., and J. Glaesser. 2010. “Contrasting Variable-Analytic and Case-Based Approaches to the Analysis of Survey Datasets: Exploring how Achievement Varies by Ability Across Configurations of Social Class and sex.” Methodological Innovations Online 5: 3–23.
- Denk, T. 2010. “Comparative Multilevel Analysis: Proposal for a Methodology.” International Journal of Social Research Methodology 13: 29–39. doi:https://doi.org/10.1080/13645570802583779.
- Di Martino, P., and R. Zan. 2011. “Attitude Towards Mathematics: A Bridge Between Beliefs and Emotions.” ZDM - International Journal on Mathematics Education 43: 471–482. doi:https://doi.org/10.1007/s11858-011-0309-6.
- Driessen, G., and P. Sleegers. 2000. “Consistency of Teaching Approach and Student Achievement: An Empirical Test. School Effectiveness and School Improvement.” An International Journal of Research, Policy and Practice 11: 57–79.
- Dusa, A. 2019. Package ‘QCA.
- Ernest, P. 1991. The Philosophy of Mathematics Education. Falmer: Basingstoke.
- Fennema, E., and J. A. Sherman. 1977. “Sex-related Differences in Mathematics Achievement, Spatial Visualisation and Affective Factors.” American Educational Research Journal 14: 51–71.
- Fiss, P. C., D. Sharapov, and L. Cronqvist. 2013. “Opposites Attract? Opportunities and Challenges for Integrating Large-N QCA and Econometric Analysis.” Political Research Quarterly 66: 191–198.
- Gabriel, F., J. Signolet, and M. Westwell. 2018. “A Machine Learning Approach to Investigating the Effects of Mathematics Dispositions on Mathematical Literacy.” International Journal of Research & Method in Education 41: 306–327. doi:https://doi.org/10.1080/1743727X.2017.1301916.
- Glaesser, J. 2008. “Just how Flexible is the German Selective Secondary School System? A Configurational Analysis.” International Journal of Research & Method in Education 31: 193–209.
- Glaesser, J., and B. Cooper. 2012a. “Educational Achievement in Selective and Comprehensive Local Education Authorities: a Configurational Analysis.” British Journal of Sociology of Education 33: 223–244.
- Glaesser, J., and B. Cooper. 2012b. “Gender, Parental Education and Ability: Their Interacting Roles in Predicting GCSE Success.” Cambridge Journal of Education 42: 463–480.
- Glaesser, J., and B. Cooper. 2014. “Exploring the Consequences of a Recalibration of Causal Conditions When Assessing Sufficiency with Fuzzy set QCA.” International Journal of Social Research Methodology 17: 387–401. doi:https://doi.org/10.1080/13645579.2013.769782.
- Grootenboer, P., and B. Hemmings. 2007. “Mathematics Performance and the Role Played by Affective and Background Factors Peter Grootenboer and Brian Hemmings.” Mathematics Education Research Journal 19: 3–20. doi:https://doi.org/10.1007/BF03217459.
- Hannula, M. S. 2002. “Attitude Towards Mathematics: Emotions, Expectations and Values.” Educational Studies in Mathematics 49: 25–46. doi:https://doi.org/10.1023/A:1016048823497.
- Hemmings, B., and R. Kay. 2010. “Prior Achievement, Effort, and Mathematics Attitude as Predictors of Current Achievement.” The Australian Educational Researcher 37: 41–58.
- Kleanthous, I., and J. Williams. 2013. “Perceived Parental Influence and Students’ Dispositions to Study Mathematically-Demanding Courses in Higher Education.” Research in Mathematics Education 15: 50–69. doi:https://doi.org/10.1080/14794802.2013.763608.
- Lapointe, J. M., F. Legault, and S. J. Batiste. 2005. “Teacher Interpersonal Behavior and Adolescents’ Motivation in Mathematics: A Comparison of Learning Disabled, Average, and Talented Students.” International Journal of Educational Research 43: 39–54.
- Lazarides, R., and A. Ittel. 2012. “Instructional Quality and Attitudes Toward Mathematics: Do Self-Concept and Interest Differ Across Students’ Patterns of Perceived Instructional Quality in Mathematics Classrooms?” Child Development Research 2012: 1–11.
- Lei, K. H., and M. Pampaka. 2018. “Mathematics Self-Efficacy and its Association with Parental Support and Teaching Practices in UK Secondary School Mathematics.” In Proceedings of the British Society for Research Into Learning Mathematics 38 (3) November 2018. Presented at the BSRLM, BSRLM, London, UK, edited by F. Curtis, 1–6.
- Lei, K. H., and M. Pampaka. 2019. “Mathematics Self-Efficacy of Secondary School Students in the UK: The Role of Parental Support and Perceived Teaching Practices.” In Proceedings of the PME & Yandex Russian Conference. Presented at the PME, PME, Moscow, Russia.
- Lim, S. Y., and E. Chapman. 2013. “Development of a Short Form of the Attitudes Toward Mathematics Inventory.” Educational Studies in Mathematics 82: 145–164. doi:https://doi.org/10.1007/s10649-012-9414-x.
- Mata, M. de L, V. Monteiro, and F. Peixoto. 2012. “Attitudes Towards Mathematics: Effects of Individual, Motivational, and Social Support Factors.” Child Development Research 2012: 1–10.
- McCaffrey, D. F., L. S. Hamilton, B. M. Stecher, S. P. Klein, D. Bugliari, and A. Robyn. 2001. “Interactions among Instructional Practices, Curriculum, and Student Achievement: The Case of Standards-Based High School Mathematics.” Journal for Research in Mathematics Education 32: 493–517.
- Meece, J. L., P. Herman, and B. L. McCombs. 2003. “Relations of Learner-Centered Teaching Practices to Adolescents’ Achievement Goals.” International Journal of Educational Research 39: 457–475.
- Mendick, H. 2005. “Mathematical Stories: why do More Boys Than Girls Choose to Study Mathematics at AS-Level in England?” British Journal of Sociology of Education 26: 235–251. doi:https://doi.org/10.1080/0142569042000294192.
- Messick, S. 1988. “The Once and Future Issues of Validity: Assessing the Meaning and Consequences of Measurement.” In Test Validity, edited by H. Wainer, and H. I. Braun, 33–45. London: Lawrence Erlbaum Associates, Publishers.
- Mevarech, Z., and B. Kramarski. 2014. Critical Maths for Innovative Societies.
- O’Brien, V., M. Martinez-Pons, and M. Kopala. 1999. “Mathematics Self-Efficacy, Ethnic Identity, Gender, and Career Interests Related to Mathematics and Science.” The Journal of Educational Research 92: 231–235.
- OFSTED. 2011. Tackling the Challenge of low Numeracy Skills in Young People and Adults. London: OFSTED.
- Pampaka, M., G. Hutcheson, and J. Williams. 2016. “Handling Missing Data: Analysis of a Challenging Data set Using Multiple Imputation.” International Journal of Research & Method in Education 39: 19–37. doi:https://doi.org/10.1080/1743727X.2014.979146.
- Pampaka, M., I. Kleanthous, G. D. Hutcheson, and G. Wake. 2011. “Measuring Mathematics Self-Efficacy as a Learning Outcome.” Research in Mathematics Education 13: 169–190. doi:https://doi.org/10.1080/14794802.2011.585828.
- Pampaka, M., D. Swain, S. Jones, J. Williams, M. Edwards, and L. Wo. 2018. “Validating Constructs of Learners’ Academic Self-Efficacy for Measuring Learning Gain.” Higher Education Pedagogies 3: 118–144. doi:https://doi.org/10.1080/23752696.2018.1454264.
- Pampaka, M., and J. Williams. 2016. “Mathematics Teachers’ and Students’ Perceptions of Transmissionist Teaching and its Association with Students’ Dispositions.” Teaching Mathematics and its Applications: An International Journal of the IMA 35: 118–130. doi:https://doi.org/10.1093/teamat/hrw007.
- Pampaka, M., J. Williams, G. Hutcheson, L. Black, P. Davis, P. Hernandez-Martinez, and G. Wake. 2013. “Measuring Alternative Learning Outcomes: Dispositions to Study in Higher Education.” Journal of Applied Measurement 14: 197–218.
- Pampaka, M., J. Williams, G. Hutcheson, G. Wake, L. Black, P. Davis, and P. Hernandez-Martinez. 2012. “The Association Between Mathematics Pedagogy and Learners’ Dispositions for University Study.” British Educational Research Journal 38: 473–496. doi:https://doi.org/10.1080/01411926.2011.555518.
- Pampaka, M., and L. Wo. 2014. “Revisiting Mathematical Attitudes of Students in Secondary Education.” In Proceedings of the 38th Conference of the International Group for the Psychology of Mathematics Education (PME38). Presented at the The Joint Meeting of PME 38 and PME-NA 36, Vancouver, Canada, edited by P. Liljedahl, S. Oesterle, C. Nicol, and D. Allan, 385–392. PME.
- Pustjens, H., E. Van de gaer, J. Van Damme, and P. Onghena. 2004. “Effect of Secondary Schools on Academic Choices and on Success in Higher Education.” School Effectiveness and School Improvement: An International Journal of Research, Policy and Practice 15: 281–311.
- Ragin, C. C. 2000. Fuzzy-set Social Science. Chicago: University of Chicago Press.
- Ragin, C. C. 2006a. “The Limitations of Net-Effects Thinking.” In Innovative Comparative Methods for Policy Analysis, edited by B. Rihoux, and H. Grimm, 13–41., New York: Springer.
- Ragin, C. C. 2006b. “Set Relations in Social Research: Evaluating Their Consistency and Coverage.” Political Analysis 14: 291–310. doi:https://doi.org/10.1093/pan/mpj019.
- Ragin, C. C. 2008a. “Fuzzy Sets: Calibration Versus Measurement.” In The Oxford Handbook of Political Methodology, edited by J. Box-Steffensmeier, H. Brady, and D. Collier, 174–198., Oxford: Oxford University Press.
- Ragin, C. C. 2008b. Redesigning Social Inquiry: Fuzzy Sets and Beyond. Chicago: University of Chicago Press.
- Riconscente, M. M. 2014. “Effects of Perceived Teacher Practices on Latino High School Students’ Interest, Self-Efficacy, and Achievement in Mathematics.” The Journal of Experimental Education 82: 51–73. doi:https://doi.org/10.1080/00220973.2013.813358.
- Rihoux, B., and C. C. Ragin. 2009. Configurational Comparative Methods, Applied Social Research Methods Series. London: Sage.
- Rohlfing, I. 2012. “Analyzing Multilevel Data with QCA: a Straightforward Procedure.” International Journal of Social Research Methodology 15: 497–506.
- Ruffell, M., J. Mason, and B. Allen. 1998. “Studying Attitude to Mathematics.” Educational Studies in Mathematics 35: 1–18. doi:https://doi.org/10.1023/A:1003019020131.
- Russo, I., and I. Confente. 2019. “From Dataset to Qualitative Comparative Analysis (QCA)—Challenges and Tricky Points: A Research Note on Contrarian Case Analysis and Data Calibration.” Australasian Marketing Journal (AMJ) 27: 129–135. doi:https://doi.org/10.1016/j.ausmj.2018.11.001.
- Ryan, J., and J. Williams, eds. 2007. Children’s Mathematics 4 - 15. Milton Keynes: Open University Press.
- Schuh, K. L. 2004. “Learner-centered Principles in Teacher-Centered Practices?” Teaching and Teacher Education 20: 833–846.
- Skaaning, S.-E. 2011. “Assessing the Robustness of Crisp-set and Fuzzy-set QCA Results.” Sociological Methods & Research 40: 391–408. doi:https://doi.org/10.1177/0049124111404818.
- Smith, A. 2017. Report of Professor Sir Adrian Smith’s review of post-16 mathematics. DfE, London.
- Swan, M. 2006. “Designing and Using Research Instruments to Describe the Beliefs and Practices of Mathematics Teachers.” Research in Education 75: 58–70.
- Swanson, C. B., and D. L. Stevenson. 2002. “Standards-based Reform in Practice: Evidence on State Policy and Classroom Instruction from the NAEP State Assessments.” Educational Evaluation and Policy Analysis 24: 1–27.
- Thiem, A., M. Baumgartner, and D. Bol. 2016. “Still Lost in Translation! A Correction of Three Misunderstandings Between Configurational Comparativists and Regressional Analysts.” Comparative Political Studies 49: 742–774. doi:https://doi.org/10.1177/0010414014565892.
- Thomson, S. 2011a. “The Problem of Limited Diversity in Qualitative Comparative Analysis: a Discussion of two Proposed Solutions.” International Journal of Multiple Research Approaches 5: 254–268.
- Thomson, S. 2011b. “Exploring When Maternal Interest is Sufficient for High Attainment in Mathematics: A Configurational Analysis Using Longitudinal Data.” Methodological Innovations Online 6: 148–160.
- Vaisey, S. 2007. “Structure, Culture, and Community: The Search for Belonging in 50 Urban Communes.” American Sociological Review 72: 851–873. doi:https://doi.org/10.1177/000312240707200601.
- Vermunt, J. D., and N. Verloop. 1999. “Congruence and Friction Between Learning and Teaching.” Learning and Instruction 9: 257–280.
- Wilkins, J. L. M., and X. Ma. 2003. “Modeling Change in Student Attitude Toward and Beliefs about Mathematics.” The Journal of Educational Research 97: 52–63.
- Wilson, P. 2011. “Disposition Towards Engagement in Mathematics.” In Proceedings of the British Society for Research into Learning Mathematics (BSRLM), Leeds, UK.
- Wolfe, E. W., and E. V. Smith Jr. 2007a. “Instrument Development Tools and Activities for Measure Validation Using Rasch Models: Part I - Instrument Development Tools.” Journal of Applied Measurement 8: 97–123.
- Wolfe, E. W., and E. V. Smith Jr. 2007b. “Instrument Development Tools and Activities for Measure Validation Using Rasch Models: Part II - Validation Activities.” Journal of Applied Measurement 8: 204–234.