
 ?Mathematical formulae have been encoded as MathML and are displayed in this HTML version using MathJax in order to improve their display. Uncheck the box to turn MathJax off. This feature requires Javascript. Click on a formula to zoom.
ABSTRACT
Educational researchers often need to construct precise and reliable measurement scales of complex and varied representations such as participants’ written work, videoed lesson segments and policy documents. Developing such scales using can be resource-intensive and time-consuming, and the outcomes are not always reliable. Here we present alternative methods based on comparative judgement (CJ) that have been growing in popularity over recent years. We consider the contexts in which CJ-based methods are appropriate before describing in detail what they are and how they can be applied to construct measurement scales in a range of educational research contexts. We also provide an overview to evaluating the reliability and validity of the resultant measurement scales.
Introduction
At root comparative judgement (CJ) is simple: an assessor is presented with two representations and asked to decide which has ‘more’ of a stated criterion. The representations might be participants’ written work, videoed lesson segments, policy documents or any other representations that are complex and heterogenous. For example, an English teacher could be presented with two pieces of written work and asked to decide which is ‘the better writing’ (Wheadon et al. Citation2020). Many such binary decisions are collected from several assessors, and the Bradley and Terry (Citation1952) model is then fitted to the decision data to produce a unique score for each representation. The scores produced can be used for routine analytical procedures like hypothesis testing, correlating variables, and so on.
There are four motivations for using CJ over than other methods: efficiency, reliability, variety and precision. We discuss each of these in turn, before exploring the technical details of assigning scores to representations using comparative judgement. We then turn attention to more holistic factors that need consideration, and the reliability and validity of the resulting scores.
Efficiency. Common methods for constructing measurement scales can be time and resource intensive. For example, we might conduct clinical interviews (Posner and Gertzog Citation1982) to score participants on an educational outcome such as ‘conceptual understanding’. However, interviews are resource-intensive, requiring trained researchers to conduct the interviews, transcribe tape-recordings, and code transcripts. Alternatively, we might develop and validate an instrument (e.g. Epstein Citation2013). However, this is also resource-intensive, often taking years to iteratively produce a final version. Conversely, CJ methods can produce measurement scales in a few days (Bisson et al. Citation2016).
Reliability. Any measurement scale must be reliable, and this can be problematic for traditional methods. The outcomes of clinical interviews are, to an extent, a function of the skills and assumptions of the interviewers, which threatens reliability. Moreover, time passes between the first and the last interview being conducted, and in contexts such as evaluating educational interventions this further reduces reliability. Similarly, instruments that have been validated in one educational context can prove unreliable in other contexts (e.g. Bisson et al. Citation2016). CJ readily produces reliable measurement scales from a range of educational representations that are robust across different contexts.
Variety. Traditional measurement methods tend to require that the representations to be scored are relatively homogeneous. Conversely, for CJ, the more varied and heterogenous the representations, the more reliable the outcomes. For example, a common application of CJ is to construct a scale of students’ attainment based on different test questions (e.g. Jones et al. Citation2016), which would not be possible or meaningful using a rubrics-based approach to scoring. This affordance of CJ methods means that we can equate independent measurement scales that were constructed at different times using different types of representations.
Precision. Any measurement scale must have the appropriate precision for the research question at stake. Sometimes a binary variable will suffice, or a scale with just three or four levels. In contrast, CJ produces a unique score and standard error for every representation, and therefore best serves situations in which high precision is required.
Comparative judgement (CJ)
The assumption underlying CJ is that people are consistent when making relative judgements, and inconsistent when making absolute judgements (Thurstone Citation1927). For example, people vary when estimating the weight of a single physical object but agree which is heavier when comparing two physical objects. CJ-based methods harness this consistency to produce outcomes that are reliable despite being derived from subjective, holistic judgements.
CJ has a history of use in laboratory settings. Variants of CJ that involve choosing or ranking more than two representations at a time have arisen in fields including marketing (Grashuis and Magnier Citation2018), environmental science (Hanley, Wright, and Adamowicz Citation1998) and health (Soekhai et al. Citation2019). Within education, CJ-based methods were introduced to investigate the relative difficulty of examination papers (Jones et al. Citation2016). Senior examiners judge pairs of scripts from different examination papers in terms of ‘difficulty’, and the outcomes are used to determine whether standards vary over time or across examination boards. Originally, such studies were conducted manually, using in-person assessors provided with physical scripts, and this limited studies to relatively small numbers of scripts (Bramley, Bell, and Pollitt Citation1998). Subsequent technological developments mean representations can be digitized and presented remotely, enabling measurement scales comprising many representations. These developments enabled wider applications of CJ, including grading of student-produced scripts (Jones and Inglis Citation2015, Wheadon et al. Citation2020). CJ is also now used to address educational research questions (e.g. Roose et al. Citation2019, Bisson et al. Citation2020).
Beyond technological developments, take up is further enabled through technical guides (e.g. Bramley Citation2007, Pollitt Citation2012) exploring the statistical calculations and applications of comparative judgement. Until now, the literature has lacked clear, accessible exposition of the more holistic factors associated with CJ research design, and their relationship with the technical factors. The current manuscript intends to bridge that gap, lowering the technical barriers to entry by addressing the key research design decisions necessary to use comparative judgement methods.
The representations
The representations to be judged might already exist, for example as archived examination scripts or videotaped lessons, or be in the public domain, for example, policy documents or journal article abstracts, or they might need creating, for example by administering a test. Often, the representations will need anonymizing and digitizing prior to judging. There is no constraint on the number of representations, although non-pairwise ranking methods, such as asking every participant to put several representations in order (e.g. Bramley Citation2007), might be more suitable for five or fewer. The representations must be heterogenous: the greater the differences between representations according to a specified criterion, the easier to make pairwise decisions. Judgements must be essentially subjective and holistic: if the representations can be objectively scored – for example, multiple-choice questionnaires or spelling tests – then CJ methods are likely to be unhelpful.
The criterion
Assessors are provided with a high-level criterion. This criterion corresponds to the construct or scale of interest, see for examples.
Table 1. Example criteria and representations.
Initially, researchers should try some judging themselves to get a feel for the process, and to decide how long, on average, each judgement takes.
Collecting judgement decisions
The platform
Most CJ studies use an internet browser to present pairings to assessors, although manual arrangements can also be used (e.g. Evans et al. Citation2014). Some CJ platforms are free to use, such as nomoremarking.com, or alternatively some studies can be supported by online survey tools or experimental software such as PsychoPy.
The number of pairings
For n representations, there are unique possible pairings. For small n, collecting a decision for every pairing is possible, but as n increases this becomes unrealistic, see . Fortunately, a small proportion of possible pairings are adequate for constructing reliable outcomes (Bramley Citation2007). A common guideline is to multiply n by 10 to estimate the required number of comparisons, although multiplying by as little as 5 or as much as 17 has been suggested (Verhavert et al. Citation2019).
Table 2. The number of unique pairings is (approximately) proportional to n2. A common guideline is to collect n × 10 comparisons.
Selecting pairings
There are two approaches to selecting pairings for presentation to assessors. One is to select representations at random, subject to constraints such as not repeating pairings and ensuring all representations receive the same number of judgements. The other approach uses adaptive algorithms that select representations based on the decisions made so far, thereby reducing the number of comparisons needed (Pollitt Citation2012). However, adaptive algorithms select those pairings for which decision data are likely to increase reliabilityFootnote1 but this comes at the risk that reliability can be artificially inflated (see Bramley and Vitello Citation2019) and we advise selecting representations randomly.
The assessors
In principle, one person could judge all presented comparisons. In practice, several assessors are recruited because assessors vary: for example, different experts value different aspects of students’ essays such as addressing the question, covering the content, and developing arguments (Elander and Hardman Citation2002). Using several assessors lets us construct a measurement scale based on collective expertise, and also lets us estimate inter-rater (or ‘split-halves’) reliability (see below). The number of assessors required is derived from the number of comparisons required, and the average time each comparison takes. Researchers should consider fatigue if assessors are allocated too many comparisons, although this can be reduced by assessors conducting their comparisons over a few days.
Identifying the population from which to sample assessors should be informed by the research question. For example, if the representations are students’ written work and we wish to construct a scale of writing quality then we might recruit English teachers. If the representations are words and we wish to measure everyday meaning then we might recruit members of the public via a crowdsourcing platform (Tanswell et al. Citationsubmitted). Sometimes a research question requires the representations to be judged independently by groups sampled from different populations (e.g. Hartell, Strimel, and Bartholomew Citation2017, Davies, Alcock, and Jones Citation2021).
Training
One reason CJ methods are efficient is that making pairwise comparisons usually requires no training or extensive guidance (Bisson et al. Citation2016, Keppens et al. Citation2019). Sometimes assessors’ first few comparisons are considered a training phase and discarded, but we find this unnecessary and retain all comparisons.
The scores
An important property of CJ scores, often called scale values, is that they are probabilistic. If we know scores vA and vB of representations A and B, then we can calculate the probability that A will be chosen when compared with B using.
(1)
(1) where (1) is known as the Bradley–Terry (Citation1952) model. The Bradley–Terry model is widely used for processing comparative judgement decisions and is practically identical to the Rasch model for dichotomous items (Wainer et al. Citation1978). For example, the probability that Student A’s work in is judged ‘better’ than Student B’s work is P(A > B) = 0.91; conversely, the probability that Student B’s work is judged ‘better’ is P(B > A) = 0.09. Student C has a closer score to Student A than does Student B and this is reflected in the probability, P(A > C) = 0.53. These probabilistic relationships mean that the outcomes are not merely ranked, but form a genuine scale where the relative distances between representations are intervals.
Table 3. Fictional scores and standard errors for three pieces of student work.
Scores are determined iteratively using a maximum likelihood estimation procedure (Hunter Citation2004). For a representation i, with current score vi, that has won Wi pairings, and has been paired Nji times with a representation j with score vj, then the updated score for i is given by,
(2)
(2) The procedure is started by assigning initial values based on raw wins and losses to v1, v2 … vn for n representations, and the scores are updated using (2) until they converge on values that reflect the maximum likelihood of the pairwise decisions. The Bradley–Terry model typically produces final scores with a mean of about 0 and a standard deviation of about 2.5 (Bramley Citation2007).
A standard error is calculated for each score which can be interpreted as precision. For a representation i we first calculate, for its every pairing, the probability that it was chosen, pi, multiplied by the probability that it was not chosen, 1 – pi. The standard error is the inverse square root of the sum of these products,
(3)
(3) Equation (3) shows that the more decisions a representation receives, the smaller the standard error and so the greater its score’s precision. Moreover, when a representation is paired with a representation of similar ‘quality’ the comparison result reduces the standard error more than when paired with a representation of very different ‘quality’. For example, in Student A has a much higher score than Student B, and therefore a high probability of being chosen, P(A > B) = 0.91. Here, the contribution to the squared denominator in (3) is
. By contrast, students A and C have similar scores, giving P(A > C) = 0.53, and the contribution to the squared denominator is larger, 0.2491.
Estimating reliability
There are three widely reported estimates of reliability in the literature: Scale Separation Reliability (SSR), split-halves reliability (r), and misfit analysis. We describe each estimate here and consider their strengths and limitations.
Scale Separation Reliability (SSR)
SSR is the most widely reported estimate of reliability. It is a measure of internal consistency, considered analogous to Cronbach’s alpha (Andrich Citation1978), with a threshold for acceptable reliability of SSR ≥ 0.7. Just as Cronbach’s alpha increases as the number of items increases, SSR increases as the number of comparisons increases. Accordingly, SSR can be used to establish whether enough comparisons have been collected to construct an internally consistent scale (Pollitt Citation2012).
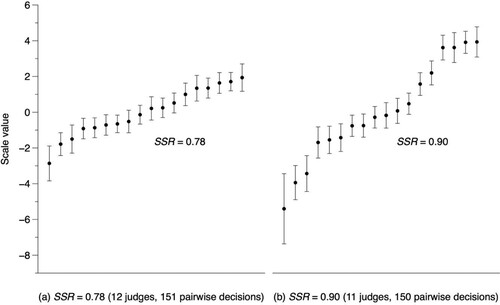
While SSR might be analogous to Cronbach’s alpha, it is not the same conceptually or mathematically. Conceptually, it can be interpreted as a sense of the ‘separatedness’ of scores and the size of their standard errors. The more separated the scores and the smaller the standard errors, the greater SSR. illustrates data from Jones, Swan, and Pollitt (Citation2015) where two independent groups comparatively judged the same 18 test responses. SSR in (b) is larger than in (a), and the scores are more spread out in (b) relative to their standard errors (shown as bars).
Figure 1. Comparison of SSR for 18 test responses independently judged by two groups. Data from Jones et al. (Citation2019).
Mathematically, SSR is the ratio of ‘true’ variance to observed variance and takes a value between 0 and 1, consistent with Rasch measurement theory (Bond and Fox Citation2007). Observed variance is the variance of the scores (SDobserved2), and true variance is defined as observed variance minus the mean square of the scores’ standard errors (RMSE),
(4)
(4)
Split-halves reliability (r)
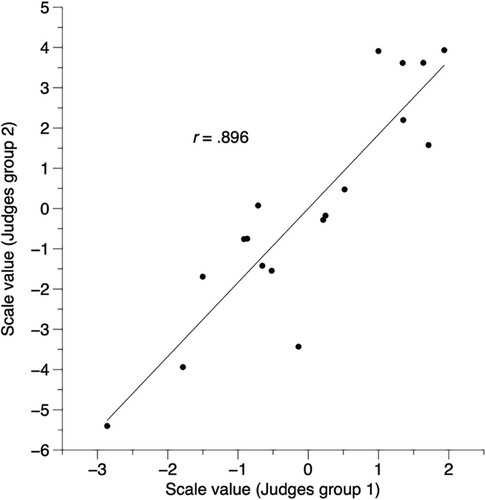
In social science, inter-rater or inter-coder reliability statistics are typically based on two or more researchers independently coding representations such as participant responses and comparing the outcomes using a correlation coefficient. In the context of CJ we can similarly collect comparisons from independent groups of assessors, and calculate the Pearson Product-Moment correlation coefficient (r) between the two sets of scores. For example, shows two sets of CJ scores from two sets of assessors (Jones et al. Citation2013), and the correlation coefficient between the two sets of scores was r = .896, as shown in , suggesting acceptable reliability.
Figure 2. Scatter plot of inter-rater reliability, based on data from Jones et al. (Citation2019).
In practice, rather than randomly allocated assessors to groups before collecting decisions we usually use a split-halves method (Bisson et al. Citation2016). Once judging is complete, assessors are randomized post-hoc into two groups and scores are calculated for each group, and the between-group correlation coefficient is then calculated. This procedure is repeated, typically 100 times, and the median correlation coefficient taken as the inter-rater reliability estimate.
Misfit analysis
Reliability is reduced if an assessor behaves differently to the majority. For example, the assessor might be careless, or have a unique interpretation of the judging criterion. We might want to identify this assessor and remove their decisions before calculating scores. We can do this by scrutinizing each for each assessor the median time they took to make a comparison, or their proportion of ‘left’ to ‘right’ decisions, but the standard method is to calculate a misfit statistic for each assessor (Pollitt Citation2012).
An assessor’s misfit statistic is calculated from the residuals of their decisions. For each decision, we record the outcome as 1 if representation A beats representation B, or 0 if B beats A. To calculate the residual, z, we subtract the probability that A beats B, given in (1). For example, in , assessor 1 chose A over B, consistent with the scores of A and B in , and the residual is . Conversely, assessor 2’s decision was inconsistent with the scores giving a larger residual,
. To calculate a misfit statistic we aggregate over the assessor’s decisions using the formula for calculating ‘infit’ from Rasch measurement theory (Bond and Fox Citation2007),
(5)
(5)
Table 4. Three fictional comparisons by three different assessors.
The larger an assessor’s misfit statistic (infit), the more inconsistent their decisions with the scores. Where an assessor has a large misfit statistic we can remove their decisions and recalculate scores. We then correlate the new and original scores to determine whether the misfitting assessor significantly impacted outcomes.
Strengths and limitations of reliability estimates
SSR is often the only reliability statistic reported, and as such can be used to compare reliability across studies. However, SSR has two limitations. First, it is conceptually opaque, and unfamiliar to readers not acquainted with traditional testing theories. Second, SSR can overestimate the ‘true’ reliability of CJ scores being systematically higher than split-halves reliability (Verhavert et al. Citation2019), especially when adaptive algorithms are used to select pairings (Bramley and Vitello Citation2019).
We prefer split-halves reliability to SSR because it compares the outcomes of independent groups of assessors in a way that is more transparent and likely to be familiar to researchers. However, a drawback is that calculating split-halves reliability requires doubling the number of assessors and comparisons.
An assessor is said to be misfitting if their infit is two standard deviations larger than the mean infit (Pollitt Citation2012), However, this cut-off is arbitrary, and in our experience recalculating scores after removing a misfitting assessor can produce further misfits in a cyclic process. More generally, we rarely find misfit statistics informative and advise not reporting them to avoid false confidence. However, our view is not universal and some scholars have found misfit statistics to be insightful in certain contexts (Roose et al. Citation2019).
In sum, SSR should be reported. Split-halves reliability should ideally be reported, especially when CJ is used in a novel way, but we aware that doubling the number of comparisons can be impractical or unaffordable. SSR and split-halves reliability are correlated (Verhavert et al. Citation2019), at least for non-adaptive CJ (Bramley and Vitello Citation2019), but we have occasionally obtained CJ outcomes where SSR > 0.7 but r < 0.7 (e.g. Bisson et al. Citation2016) and so caution must be exercised when only reporting SSR. We explore the relationship between SSR and split-halves reliabilities systematically in Kinnear, Jones, and Davies (Citationin prep).
Matters related to validity
Evaluating validity can be elusive and there is debate over validity’s definition and operationalization (Newton and Shaw Citation2014). Here we focus on validity concerns that have commonly been raised by researchers when we have presented studies that make use of CJ methods.
Opacity.
Common measurement methods use rubrics and produce audit trails such as red ink on test responses, or coding on interview transcripts. This makes it easy to check for anomalies in the data by scrutinizing the scored or coded participant responses. However, CJ involves no rubrics and produces no audit of decision-making, meaning it can be perceived as opaque. Advocates of CJ methods have three responses to this concern. First, CJ is ideal for exactly those situations where rubrics and traditional scoring are impractical, or produce unreliable outcomes. For example, Bisson et al. (Citation2016) argued when measuring conceptual understanding.
rubrics attempt to capture the letter of a concept but risk losing the spirit. The perceived transparency and objectivity of rubrics can result in a narrow and rigid definition that fails to capture the full meaning and usage that exists in practice. (143)
Second, although auditing is not inherent to CJ, it is readily introduced if required. Many CJ platforms allow assessors to leave a written comment when making a comparison.
Third, standard techniques can be used to evaluate the validity of CJ outcomes. In the next subsection, we provide examples from the education literature.
Criterion validity
Criterion validity is typically evaluated by correlating different measures of the same construct. For example, Steedle, and Ferrara (Citation2016) summarized 15 studies in which essay scores produced using CJ and traditional scoring were correlated. Proxy measures can be used where traditional scores are not available. For example, Wheadon et al. (Citation2020) reported correlations between CJ scores and students’ ages in the context of assessing primary writing.
More nuanced evaluations of criterion validity use regression analyses. Jones et al. (Citation2013) found that proxy measures for conceptual but not procedural knowledge predicted CJ scores, supporting the use of CJ to measure understanding of concepts. Bisson et al. (Citation2020) found that mathematics but not English grades predicted mathematics CJ scores, thereby providing evidence that their open-ended test measured mathematics knowledge not general written communication skills.
Other evaluations of criterion validity have involved correlating CJ outcomes produced by assessors sampled from different populations. For example, Hartell, Strimel, and Bartholomew (Citation2017) correlated CJ scores produced by subject experts from three different countries in the context of design and technology education. Jones and Alcock (Citation2014) and Davies et al. (Citation2021) correlated CJ scores produced by expert mathematicians, novice mathematicians and non-mathematicians.
Content validity
There are two main techniques for evaluating content validity in CJ studies. One is expert scrutiny of the representations. For example, Jones and Inglis (Citation2015) commissioned examiners to construct an examination paper to assess secondary students’ mathematical problem-solving. Content validity was evaluated by administering an online survey to over 100 mathematics teachers who read the paper and provided feedback via Likert-type and open-text items.
The other technique is to qualitatively code representations, for example, using a rubric from the literature or thematic analysis, and then to use statistical procedures to investigate how the codes relate to CJ scores. For example, Davies et al. (Citation2021) collected participants’ responses to the prompt ‘explain what mathematicians mean by ‘proof’’ and developed and applied a coding rubric to the responses. They then constructed regression models to explore which codes predicted CJ scores.
In addition, we advise authors present exemplar responses along with their scores when disseminating findings from CJ studies (e.g. Jones et al. Citation2019, Wheadon et al. Citation2020).
Decision analysis
Methods to understand how assessors make their decisions include think-aloud or stimulated recall protocols (e.g. Davies and Jones Citation2022), and instructing assessors to audit their decisions with written comments (e.g. Keppens et al. Citation2019). Once judging is complete, researchers can administer questionnaires (e.g. Jones et al. Citation2019) or conduct interviews or focus groups with assessors (Jones and Alcock Citation2014), sometimes incorporating other methods such as Kelly’s repertory grids (Holmes, He, and Meadows Citation2017). These methods can shine light on decision-making processes, but all have limitations and results require careful interpretation.
Anchoring
CJ scores are sometimes assumed to be inherently norm-referenced due to the relativity of pairwise judgements. However, there are various techniques for anchoring scores so that they are criterion-referenced. For example, Heldsinger and Humphry (Citation2013) used CJ to create calibrated exemplars for teachers to use when assessing writing. Wheadon et al. (Citation2020) included graded student responses from previous CJ exercises in order to anchor scores to previous cohorts. Similarly, Marshall et al. (Citation2020) included official boundary scripts in order to anchor scores to national standards.
In fact anchoring is a particular strength of CJ methods, and is commonly used to evaluate qualification standards (Bramley Citation2007). This strength arises in part because we can include student responses to different test papers in one judging pot. So long as all responses contain evidence relevant to the stated criterion, such as ‘achievement in mathematics’, then reliable and valid outcomes can be produced (Jones et al. Citation2016).
Perceptions of validity
Our experience reporting comparative judgement studies has led us to understand that outcomes must be both valid and also perceived as valid, and that these are not always the same. For example, the high reliability of CJ methods means that scores are stable across variables factors such as the sampled assessors, distribution of comparisons, the selection algorithm used and so on. However, while these factors do not impact on validity, they can affect perceptions of whether the outcomes are valid. For example, it might be that allocating 90% of comparisons to one assessors and 10% to another nine assessors produces the same scores as allocating comparisons evenly, but the latter sounds simpler and will be perceived as more valid. We advise considering simplicity and perceived validity, in addition to reliability and ‘actual’ validity, when designing CJ studies.
Conclusion
We started by setting out four motivations for using CJ methods in educational research, which we revisit now in light of the preceding discussion.
First, CJ methods offer researchers efficiency savings compared to other common methods for constructing measurement scales. These savings arise because there is no need to create and psychometrically validate tests or coding rubrics. Instead, we harness pairwise comparisons of representations that evidence the construct of interest. Pairwise decisions tend to be relatively fast and, crucially in terms of efficiency, we need only collect a fraction of all possible pairings of a set of representations.
Second, CJ methods readily produce measurement scales that are reliable in the sense that different samples of assessors drawn from the same population would produce the same scale. High reliability arises from the Law of Comparative Judgement which states that people are more consistent at comparing one representation to another than they are at rating a representation in isolation (Thurstone Citation1927). This consistency arises in part because assessors’ relative leniency or stringency is eliminated when making pairwise decisions: an assessor can only choose A or B, in contrast to rating methods where the lenient assessor might assign a higher score than a stringent assessor to a given representation (Pollitt Citation2012).
Third, CJ outcomes are reliable despite the heterogeneity and complexity of the representations being compared, and despite the subjectivity of the high-level criterion used as the basis of the comparisons. Indeed, the more variety across the representations, the greater the distinction between a given pairing, and so the more consistent the pairwise decisions. CJ methods’ dependence on varied representations means they can produce measurement scales that are difficult to construct efficiently or reliably using other methods.
Fourth, CJ outcomes offer high precision. Every representation is assigned a unique score that represents a scaling position, not merely a ranking position, and which can be used to estimate the probability that the representation will be chosen over another representation. Moreover, each representation is assigned a standard error that provides a sense of its score’s accuracy, and which allows us to evaluate the reliability of a measurement scale using some of the techniques described above.
Final comments
At root, CJ is a very simple idea, and therein lies its flexibility and power. The scope of what we have presented here is constrained only by the imagination of researchers. We hope here to have provided an overview of the promise of CJ methods, as well their limitations, and to have offered pointers towards the standardization of evaluating and reporting CJ outcomes.
Further guidance can be found at https://tinyurl.com/NMM4researchers.
Disclosure statement
No potential conflict of interest was reported by the author(s).
Notes
1 Specifically Scale Separation Reliability, see ‘Estimating Reliability’ below.
References
- Andrich, D., 1978. Relationships between the Thurstone and Rasch approaches to item scaling. Applied psychological measurement, 2 (3), 451–462.
- Bisson, M.-J., et al., 2016. Measuring conceptual understanding using comparative judgement. International journal of research in undergraduate mathematics education, 2 (2), 141–164.
- Bisson, M.-J., et al., 2020. Teaching using contextualised and decontextualised representations: examining the case of differential calculus through a comparative judgement technique. Research in mathematics education, 22 (3), 284–303.
- Bond, T., and Fox, C., 2007. Applying the Rasch model: fundamental measurement in the human sciences. Abingdon: Routledge.
- Bradley, R.A., and Terry, M., 1952. Rank analysis of incomplete block designs: I. The method of paired comparisons. Biometrika, 39 (3/4), 324–345.
- Bramley, Tom. 2007. “Paired comparison methods”. In techniques for monitoring the comparability of examination standards, edited by Paul Newton, Jo-Anne Baird, Harvey Goldstein, Helen Patrick, and Peter Tymms, 264–294. London: QCA.
- Bramley, T., Bell, J., and Pollitt, A., 1998. Assessing changes in standards over time using Thurstone paired comparisons. Education research and perspectives, 25, 1–24.
- Bramley, T., and Vitello, S., 2019. The effect of adaptivity on the reliability coefficient in adaptive comparative judgement. Assessment in education: principles, policy & practice, 26 (1), 43–58.
- Davies, B., Alcock, L., and Jones, I., 2021. What Do mathematicians mean by proof? A comparative-judgement study of students’ and mathematicians’ views. The journal of mathematical behavior, 61, 100824.
- Davies, B., and Jones, I., 2022. Assessing proof reading comprehension using summaries. International journal of research in undergraduate mathematics education, 8, 469–489.
- Elander, J., and Hardman, D., 2002. An application of judgment analysis to examination marking in psychology. British journal of psychology, 93 (3), 303–328.
- Epstein, J., 2013. The calculus concept inventory-measurement of the effect of teaching methodology in mathematics. Notices of the American mathematical society, 60 (8), 1018–1027.
- Evans, S., Jones, I., and Dawson, C. 2014. Do subject specialists produce more useful feedback than non-specialists when observing mathematics lessons? In: Proceedings of the 38th conference of the international group for the psychology of mathematics education, 3:33–40. Vancouver: IGPME.
- Grashuis, J., and Magnier, A., 2018. Product differentiation by marketing and processing cooperatives: A choice experiment with cheese and cereal products. Agribusiness, 34 (4), 813–830.
- Hanley, N., Wright, R., and Adamowicz, V., 1998. Using choice experiments to value the environment. Environmental and resource economics, 11 (3), 413–428.
- Hartell, E., Strimel, G., and Bartholomew, S. 2017. “Comparing teacher assessment practices of an engineering design challenge across countries”. In: Association for educational assessment-Europe The 18th annual AEA-Europe conference. Prague 8–11 November 2017. Association for Educational Assessment-Europe.
- Heldsinger, S., and Humphry, S., 2013. Using calibrated exemplars in the teacher-assessment of writing: an empirical study. Educational research, 55 (3), 219–235.
- Holmes, S., He, Q., and Meadows, M., 2017. An investigation of construct relevant and irrelevant features of mathematics problem-solving questions using comparative judgement and Kelly’s repertory grid. Research in mathematics education, 19 (2), 112–129.
- Hunter, D., 2004. MM algorithms for generalized Bradley-Terry models. The annals of statistics, 32 (1), 384–406.
- Jones, I., et al. 2013. “Measuring conceptual understanding: The case of fractions”. In Proceedings of the 37th conference of the international group for the psychology of mathematics education, edited by A. M. Lindmeier and A Heinze, 3:113–20. Kiel, Germany: IGPME.
- Jones, I., et al., 2016. Fifty years of A-level mathematics: have standards changed? British educational research journal, 42 (4), 543–560.
- Jones, I., et al., 2019. Measuring conceptual understanding in randomised controlled trials: can comparative judgement help? British educational research journal, 45 (3), 662–680.
- Jones, I., and Alcock, L., 2014. Peer assessment without assessment criteria. Studies in higher education, 39 (10), 1774–1787.
- Jones, I., and Inglis, M., 2015. The problem of assessing problem solving: can comparative judgement help? Educational studies in mathematics, 89, 337–355.
- Jones, I., Swan, M., and Pollitt, A., 2015. Assessing mathematical problem solving using comparative judgement. International journal of science and mathematics education, 13 (1), 151–177.
- Keppens, K., et al., 2019. Measuring pre-service teachers’ professional vision of inclusive classrooms: a video-based comparative judgement instrument. Teaching and teacher education, 78, 1–14.
- Kinnear, G., Jones, I., and Davies, B. In prep. Comparative judgement as a research tool: a meta-analysis of application and reliability.
- Marshall, N., et al., 2020. Assessment by comparative judgement: an application to secondary statistics and English in New Zealand. New Zealand journal of educational studies, 55 (1), 49–71.
- Newton, P., and Shaw, S., 2014. Validity in educational and psychological assessment. London: SAGE.
- Pollitt, A., 2012. The method of adaptive comparative judgement. Assessment in education: principles, policy & practice, 19, 281–300.
- Posner, G., and Gertzog, W., 1982. The clinical interview and the measurement of conceptual change. Science education, 66 (2), 195–209.
- Roose, I., et al., 2019. Measuring teachers’ professional vision of inclusive classrooms through video-based comparative judgement. What does it mean to misfit? International journal of educational research, 98, 257–271.
- Soekhai, V., et al., 2019. Discrete choice experiments in health economics: past, present and future. Pharmacoeconomics, 37 (2), 201–226.
- Steedle, J., and Ferrara, S., 2016. Evaluating comparative judgment as an approach to essay scoring. Applied measurement in education, 29 (3), 211–223.
- Tanswell, F., et al. Submitted. Comparative judgement for experimental philosophy: a new method for assessing ordinary meaning in vehicles in the park cases.
- Thurstone, L., 1927. A Law of comparative judgment. Psychological review, 34, 273–286.
- Verhavert, S., et al., 2019. A meta-analysis on the reliability of comparative judgement. Assessment in education: principles, policy & practice, 26 (5), 541–562.
- Wainer, H., TimbersFairbank, D., and Hough, R.L., 1978. Predicting the impact of simple and compound life change events. Applied psychological measurement, 2 (3), 313–322.
- Wheadon, C., et al., 2020. A comparative judgement approach to the large-scale assessment of primary writing in England. Assessment in education: principles, policy & practice, 27 (1), 46–64.