
ABSTRACT
Researching well-being has gained popularity over the last decades however, research methodologies have employed mostly surveys, and the use of qualitative and visual methods is still scarce. This study discusses using timelines as a tool for researching the well-being of student teachers in two different cultural contexts. Research data includes researchers’ notes as well as focus groups and students’ notions of using timelines as a course assignment, analyzed using thematic analysis. This study shares our justification for using qualitative, visual methods to collect data related to well-being and evaluates the strengths and limitations of timelining as a tool to do this, from both the participants’ and researchers’ viewpoints. The study argues that timelines have the potential not only to support reflections on well-being but also to provide an approach to support it during teacher training and beyond. The use of timelines as tools to explore the non-linear and dynamic experiences of well-being during student teachers’ teaching practice in Finland and England will be discussed and recommendations for the further development of this approach shared.
Introduction
This study focuses on student teachers’ well-being during their teaching practice which is a crucial and compulsory part of teacher studies and the growth of professional identity (La Paro et al. Citation2018, Mena et al. Citation2017). Practical training provides opportunities for students to connect their theoretical knowledge to educational praxis, and to use and develop their competencies and skills in real-life situations under the supervision and mentoring of experienced professionals (Ferrier-Kerr Citation2009, Standal et al. Citation2014, Vartuli et al. Citation2016). These experiences promote students’ understanding of their future profession as well as of themselves as a teacher (La Paro et al. Citation2018). Teaching practice is an intense period in students’ lives and therefore researching it requires innovative and accessible methods to encourage participants to engage during this acutely busy time. Mapping well-being using qualitative methods has been proposed to do this (Väisänen Citation2019) and using timelines has been successfully piloted in previous research (Thompson et al. Citation2020) involving student teachers. Although this study considers the use of timelines during the period of teaching practice specifically, it proposes that the benefits of timelining could be expanded to consider the process of teacher training more holistically too.
In 2012, Wall et al. (Citation2012) delivered a special issue about visual methodology in the International Journal of Research & Method in Education. Their motivation was to ‘inspire researchers to embrace visual methods and also to bring their creativity’ (Wall et al. Citation2012, p. 225). Pink (Citation2013, p. 5) asserted that the growing use of visual methods in research has been indicative of a wider shift to a more ‘engaged, participatory, collaborative and public … scholarship’. She argued that without ‘engaging with visual forms’ it would be difficult to be a contemporary researcher (Pink Citation2013). In this study, this was attempted by trialling the use of timelines as a data collection tool to explore the well-being of student teachers in two different contexts. It has been suggested that:
… the period of transition from student to teacher is often a struggle for a great number of beginning teachers which usually remains invisible (Pillen et al. Citation2013, p. 241).
With this in mind, approaches were sought that would allow these ‘invisible’, states to become visible and that would enable participants to be active and to articulate what they felt was salient in a relationship that reduced power hierarchies between student and lecturer. Graphic elicitation through the use of timelines was piloted to examine whether it afforded these opportunities.
Visual methods include taking photographs, making collage, video, and drawing (Barbour Citation2014) and focus on participants showing, as opposed to telling others how they ‘perceive their world’ (Richards Citation2011, p. 1). According to Pain (Citation2012, p. 305), visual methods support, mediate, and facilitate communication between the participant and researcher by including expressions of subconscious and tacit knowledge. Visual methods also place participants as experts in their own lives and encourage reflection, support rapport building, and reduce power issues (Pain Citation2012). Traditionally, educational research has overlooked visual methods, but there has been evidence of a ‘rapid expansion in practice’ (Wall et al. Citation2012, p. 233) in more recent years.
This study aims to provide an overview of the possibilities of using timelines as a data collection tool in studying well-being. The results are based on the experiences of researchers who have utilized timelines as a tool for studying students’ well-being during teaching practice, as well as the experiences of the students who participated in the research. The research data were collected in teacher education settings in the UK and Finland as a part of a larger Student Teacher Well-being: Deepening Understanding and Building Support (STeWDUBS) research project to support the well-being of student teachers. The research question is: What are the strengths and limitations of using timelines as a tool in researching student well-being during the teaching practice?
Timelining as a tool in participatory research methods
Timelines are a tool within visual methods which have been used both in academic research (e.g. Marshall Citation2019) and in other contexts, such as personal development (e.g. Brown Citation2013) and therapeutic work (e.g. Hope et al. Citation2013). Timelines are defined as a graphically illustrated linear continuum of past life events (Berends Citation2011). According to a previous study (Sheridan et al. Citation2011), timelining is an eclectic and adaptable research tool that enables participants to record, broaden, and deepen the understanding of their experiences. As a research tool, timelines provide ‘concise, holistic summaries’ of participants’ self-reported experiences (Berends Citation2011, p. 3) that reveal the multi-faceted and nuanced nature of personal human experience (Sheridan et al. Citation2011, p. 553). Berends (Citation2011) and Sheridan et al. (Citation2011, p. 2) point out that timelines provide a ‘bridge’ between participants’ experiences and their recall of them, which enables opportunities to discuss ‘hidden meanings and complex ideas’. Jackson (Citation2013, p. 415) supports this noting the possibilities for these tools to produce holistic narratives where these may be difficult to communicate purely verbally – for example in relation to experiences of well-being.
Including vignettes, text, and annotations as part of the timeline process has been asserted as a way to provide more depth and a more comprehensive account from participants as it provides them with an opportunity to both reflect on and share feelings, as part of the process (Berends Citation2011), achieved by including illustrative quotes for specific or critical points on the timeline to retain participant voice (Berends Citation2011). Sheridan et al. (Citation2011, p. 553) also suggest that by combining graphic elicitation and some form of discussion, deeper ‘layers’ of representation can be uncovered than would be through the use of a single approach.
Nevertheless, as with all forms of data collection, timelines – and visual methods more generally – have a number of limitations, centring on challenges related to data analysis, with drawbacks including issues in the process of interpreting and analyzing potentially ambiguous visual data which are not explicit to the reader (Berends Citation2011, p. 7). Also, limitations exist around any templates provided for participants to structure their timeline, which may constrain either the information they want to include or the way in which they chose to depict their timeline. However, as Sheridan et al. (Citation2011, p. 559) suggest, structurally timelines and interviews are largely similar in their potential to prompt linear narratives.
The timelines in this research were used as a stand-alone dataset and also as a prompt for the focus group discussion. Focus groups have been asserted as tools to enable shared and tacit beliefs to emerge through interactions with other participants (Macnaughten and Myers Citation2004). They may also help those who are reluctant in interviews or feel that they have nothing to say (Robson Citation2011, Sim Citation1998), this can be pertinent when sharing personal information related to individual well-being. Using visual data as the basis of a focus group discussion helps participants to control the agenda and to create dialogue to understand experiences (Bates et al. Citation2017, Burton et al. Citation2017). Using the timelines as a stimulus, participants in the focus group were able to select which information they choose to share and were not under any pressure or expectation to share aspects of their timeline they did not feel comfortable doing. It has been argued that the use of participants’ own generated and selected images ‘alters the tone’ of discussions due to their ability to mediate which images are chosen (Bates et al. Citation2017, p. 459), or which aspects are shared with others.
Researching well-being
Studies concerning well-being have increased (e.g. Dodge et al. Citation2012), with the COVID-19 pandemic adding to extant research, particularly in schools, relating to both pupils and staff (including, but not only Azorín Citation2020, Netolicky Citation2020, Sahlberg Citation2020). Research into student well-being, including those in higher education (Bates et al. Citation2017, Collings et al. Citation2014, Houghton and Anderson Citation2017, Seldon and Martin Citation2017) is also growing.
The increasing research interest in well-being in education has led to many questionnaires and surveys being developed (e.g. Väisänen et al. Citation2018, İnözü and Sahinkarakas Citation2016). Furthermore, qualitative research methods, such as interviews (e.g. Faupel et al. Citation2016), and focus groups (e.g. Olsen Citation2017) are increasingly implemented in studying well-being. However, much research on well-being, as Putwain (Citation2007, p. 207) noted, still has an ‘overwhelming bias … towards measurement’ and researching well-being qualitatively is comparatively scarce. Putwain (Citation2007) noted that the utilization of visual methods provides an innovative methodological approach in this area.
Various data collection methods refer to different definitions and structures of well-being and it was suggested to be ‘commonly used but inconsistently defined’ in a systemic review of the literature (Pollard and Lee Citation2003, p. 62). One of the key hurdles in explicitly defining the ‘elusive’ (Ortega-Alcázar and Dyck Citation2012) concept of well-being is that it is not a discrete entity but rather multi-factorial and multi-dimensional (Dodge et al. Citation2012, Masters Citation2004). Dodge et al. (Citation2012) argued this resulted in blurred and broad descriptions of the term which did little to resolve problems in defining well-being. In this research, a clear definition was required which was understood comparably across the different international and linguistic contexts and suited to collecting both quantitative (for other areas of the wider research project) and qualitative data. One such flexible definition is that of Dodge et al. (Citation2012, pp. 229–230) who consider well-being as;
maintaining the balance between resources and challenges … which may be internal or external and operate in a dynamic flux over time.
Due to the focus on the students’ own experience of their well-being, it is possible to adopt concepts from the strong international body of research on subjective well-being (SWB) (see Diener et al. Citation1999) sometimes referred to as eudaemonic well-being (Bauer et al. Citation2019). The research on SWB is interested in life satisfaction, optimism, and quality of life which all focus on positive elements associated with mental and physical health (Nes et al. Citation2006). SWB includes both positive and negative affect where positive affect consists of pleasant emotions and negative affect refers to the absence of unpleasant emotions. The critical component is a person’s own judgement about satisfaction with these circumstances (Diener et al. Citation1999, Yang et al. Citation2008.)
Well-being of those training to be teachers is an area of paucity in research (Thompson et al. Citation2020). Although teaching practice appears to increase the competence of students, possibly based on the increasing teaching experience (Van Schagen Johnson et al. Citation2017), many students experience teaching practice(s) as stressful and demanding. Periods of practice in schools often contain numerous changes, pressures, stressors, as well as issues of growing fatigue and challenges in managing pupil behaviour (Caires et al. Citation2012, Klassen and Durksen Citation2014, Paquette and Rieg Citation2016, Van Schagen Johnson et al. Citation2017). As Pillen et al. (Citation2013) argued, learning to teach is not simply complex, but also ‘very personal’, and teaching practice(s) can reflect other challenges related to professional development, such as concerns over expectations, worries about personal competency, as well as their performance as teachers. In addition to these challenges, findings suggest that students at higher education institutions – which all participants in this research were – are negatively affected by stress and as a result have lower well-being due to managing a range of responsibilities (Dwyer and Cummings Citation2001) and navigating multiple and multi-dimensional transitions (Jindal-Snape and Rienties Citation2016). This complexity and possibility for increased negatively stressful experiences highlights the need for more focused research in this area to support students who are likely to encounter a range of experiences which challenge their well-being.
Materials and methods
Context
This study focuses on the experiences and perceptions of three teacher-researchers and two researchers in Finland, and two teacher-researchers in the UK who collected their experiences and perceptions about using timelines as a tool in research and as a study assignment. In addition, 55 students consented for their timelines to reflect on their well-being to be used as data. As there were some differences in the context the timelines were used in, these will initially be described. Around half of all teacher training in England is based in universities (Department for Education Citation2018), with both undergraduate and postgraduate routes to Qualified Teacher Status (QTS). There are also school-centred and employment-centred training routes. Teacher training programmes must all include at least 120 days in the classroom and experience of teaching in two different schools, across the chosen age phase. The English students included in this research (N = 6) were towards the end of their university-based programme, with most of their classroom experience completed. The students were asked to draw a timeline based on their experiences of their final teaching practice in the academic year of 2020–2021, which was then followed by a focus group discussion.
In Finland, the participants reported in this study were student teachers in early childhood education (N = 6) and special education (N = 43) completing a 5-year master’s qualification programme. These students used timelines and a written assignment to describe their well-being during their teaching practice which lasted between 3–6 weeks in spring 2021. Early childhood education (ECE) students were qualified ECE teachers who had continued their ECE studies master’s programme and this was their first teaching practice, focusing on adult education at an educational institution. For special education student teachers, this was their third or fourth teaching practice, and it was implemented for six weeks in part-time special education or in special education classes in primary or secondary schools. The special education student teachers implemented their own teaching, observed pupils, and were supported by a mentor teacher. Almost all student teachers had their teaching practice on the spot at school, and few students were either totally online or hybrid in the spot and online. Instruction sessions provided for all students during the teaching practice were implemented online in both Finland and England. In England all students observed pupils, were supported by a mentor, and taught during their practice, either wholly in-person or they experienced a hybrid of online and in-person teaching.
All participants were asked to plot their well-being on the same timeline proforma, listing the specific resources and challenges they experienced related to their subjective well-being (drawn from Dodge et al. Citation2012, pp. 229–230) and asked the same questions in the focus group. However, due to contextual differences, data were collected in slightly different ways as will now be discussed.
Data collection with timelines
In England, timeline proformas were provided individually as hard copies and completed face-to-face immediately after the end of the teaching practice when student teachers returned to the university for taught sessions. The task was discussed with participants who were asked to map their experiences retrospectively on the shared Finnish/English timeline proforma (see Supplemental online material). They were encouraged to annotate their timeline with key events for example, factors which caused particular highs or lows in well-being, as well as any aspects that were responsible for making changes in their perceived well-being. When their timelines were completed, participants were asked to list separately the factors that were specific challenges to their well-being as well as the resources they used to support and develop their well-being.
Before the teaching practice, the Finnish students were provided with written instructions on how to fill in the weekly timelines. The instructions were also discussed in an online session, and the students were encouraged to ask if they had any questions about the assignment throughout the practice. Firstly, the students were requested to observe their well-being weekly during teaching practice and to draw a line describing changes in their well-being on the timeline. Timelines were produced as both hard copies and electronic versions, with participants able to select how they completed the pro-forma. Secondly, the students were requested to name factors that supported or limited their well-being. During the teaching practice, they were asked to consider the most important turning points in their well-being during the week and mark these to the timeline (e.g. with different colours, a darker font, or circles). At the end of the teaching practice, students were asked to look at the timelines they had drawn and based on them, consider the most important turning points during the whole teaching practice, what factors were connected to these changes, and which factors affecting their well-being they would like to pay attention to in the future (during studies and in transition to working life) and how. Participants were allowed (UK) or suggested (FIN) to add annotations or descriptions to their timelines.
Data collection with focus groups
In England, a single in-person focus group, lasting approximately 1 h took place immediately after the timeline activity. The focus group was held with English participants and English researchers (conducted in English). In addition, there was one shared online focus group with Finnish participants and Finnish and English researchers (conducted in English). Both sets of focus groups used the same list of prompt questions to generate discussion. These asked participants to discuss their timelines generally before selecting a specific low point in their well-being and a specific high point in their well-being to discuss in detail, as well as what they learned from these. They were also given the opportunity to share any additional details or information related to their timelines before the discussion ended.
The focus group in Finland was conducted online (Acocella and Cataldi Citation2021) largely due to issues accessing participants during the COVID-19 pandemic. Research data in Finland were collected during the spring semester of 2021 when the COVID-19 pandemic affected well-being of students as well as the implementation of their teacher education. All sets of focus groups were audio recorded and subsequently transcribed into their home language.
Data analysis
Research data were collected from teacher-researchers via field notes (Phillippi and Lauderdale Citation2018) and shared discussions, as well as from students via focus groups and informal annotations and notes in timelines. Two teacher-researchers shared their notions from their research diary (Bartlett and Milligan Citation2015) as a table that was supplemented and expanded on by other authors of this study. Thus, the analysis of notions and experiences related to the timelines can be seen as involving memory work. In this study, teacher-researchers’ individual experiences and notions were collectively reflected upon during and after data collection with the purpose to promote multiple reflections and a comprehensive perception construction. There are issues around reliance on memory in research design, including concerns around the cultural contexts and methodological tools used and how these impact on the participant (e.g. Hope et al. Citation2022). However, our interest in the perceptions of student teachers on their experiences does not rely on absolute accuracy of recall.
Students were not explicitly asked to give feedback on the timeline assignment. However, all students who participated in the focus group discussions (n = 5) presented their views and experiences about timelines as a tool. Some students also commented or referred to the timelines in their discussion part of the assignments (n = 17). All these perspectives have been used as data in this study. These notions are used to complement the researchers’ viewpoints and to reflect participants’ experiences. Data were analyzed using thematic analysis (Braun and Clarke Citation2006).
Ethical aspects
The involvement of participants in timeline research was accomplished based on ethical standards in empirical research. A requirement is the informed and freely given consent of the participants involved in the empirical research. For this research, all student teachers were asked to complete the timeline assignment as part of their routine studies with consent sought to use the data once the assignment was completed. Using students’ existing tasks as a way of consensually collecting data lowers participants’ workload by reducing or eliminating the requirement for additional data collection methods. Most students shared their timeline assignments for research purposes, and they were not penalized in any way for not participating. All students were informed to only provide personal information about themselves that they feel confident about sharing with the researchers. This was important since the student teachers and teacher-researchers knew each other well which encouraged many student teachers to share their personal information in discussions inside and outside the research context. Sources of support were signposted to students, acknowledging that any research that asks participants to share their stories can strongly affect them. Due to anticipated, highly personal elements of participants’ well-being, including health information, students participated in research as research subjects to maintain confidentiality of the research data. We also considered the high workload the students were already tackling in a decision not to ask them to collaborate in the research work.
The participants’ confidentiality and anonymity in the fieldwork phases were strictly protected by the researchers and were guaranteed by the following procedure: research data were pseudonymized by using pseudonyms instead of the actual names, for other data, such as the visual materials, information which could be traced back to individual persons was blurred. All personal data were treated according to the General Data Protection Regulation (GDPR) of the European Union.
Results
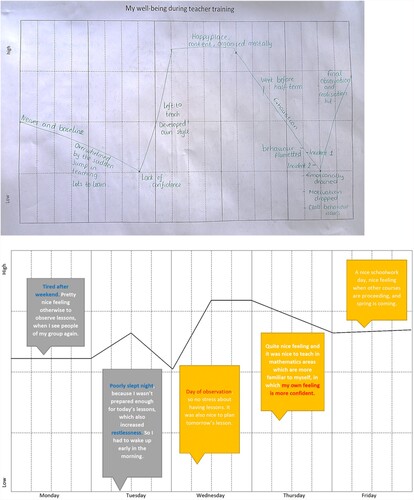
Students were provided with a proforma which they could annotate with various, personal, and creative timelines (see ) that reflected their perceived well-being during teaching practice. Among visual and graphical illustrations, all timelines included – to a range of degrees – written information related to specific peaks and troughs of well-being. These ranged from emotions and reflections on specific incidents such as individual lessons to broader issues such as ‘lack of confidence’ or ‘comprehensions of teacherhood and teacher’s ethics’ as well as the impact of relationship with others such as their school-based and university-based mentors and peer students.
Figure 1. Examples of timelines provided by students concerning their well-being (Example above from the UK and below from Finland, latter translated for the study)
Researchers’ and students’ experiences relating to the use of timelines as a tool for collecting data and using it for researching students’ well-being were mostly positive, and there were only a few negative or critical comments (see ). Views and experiences concerned the nature of the information obtained through the approach, multifaced perspectives, flexibility and the usability of the tool, as well as its suitability for reflecting well-being and promoting professional development. Next, we will describe researchers’ and students’ views on these themes.
Figure 2. Reflections of timelines as a tool in researching well-being.
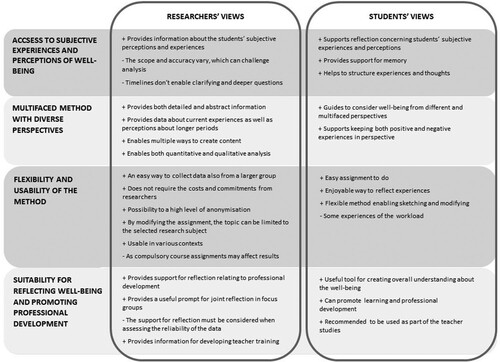
Access to subjective experiences and perceptions of well-being
From the researchers’ perspective, timelines provided a useful way to explore participants’ subjective experiences and perceptions of well-being. Timelines included information about how students themselves understood the meaning of well-being and what kind of factors they saw as affecting their well-being and were supported by students’ different ways of writing and drawing their timelines and the different content they highlighted. Students both in England and Finland described timelines as a good tool to support reflections on their subjective well-being-related experiences and perceptions. Students perceived timelines as supporting memory and helping to structure experiences and thoughts.
With the exception of the timeline assignment, researchers were unable to influence the content produced by students. On the one hand, participants’ freedom to decide how they produced the timelines can be considered as strengthening possibilities to explore participants’ own perspectives on the studied topic. On the other hand, across many different timelines, analysis can be challenging. For example, comparing students’ views can be complex because of the subjective nature of highs and lows drawn on the timeline. In addition, some of the students produced content very minimally, and therefore interpretations were also made based on very little information. Further, once timelines were submitted to researchers, there were no opportunities to ask deeper or clarifying questions without the use of focus groups or similar follow-up activities.
Multifaceted tool with diverse perspectives
The researchers found timelines to be a multifaceted tool for researching well-being as a continuously changing phenomenon influenced by a diverse range of resources and challenges. Students also linked the strength of the timeline to its multifaceted perspectives on well-being. Timelines, as a combination of both graphical illustrations and verbal reflection, helped students to consider their experiences on well-being from different perspectives, as a complex and multidimensional phenomenon including a great spectrum of emotions and experiences. Thus, timelines guided students to pay more attention to a diverse range of factors related to well-being and the continuous development of well-being. For example, one of the Finnish students had noticed how the: ‘well-being task revealed how important it is for a teacher to look after yourself outside of work’.
For researchers, timelines provided detailed information on concrete issues, such as certain factors and situations that affected students’ well-being as well as on more abstract perspectives. At the same time, timelines included information about current feelings and opinions as well as thoughts about longer periods of time. Finally, timelines enabled both quantitative methods in analyzing timelines as graphical illustrations, and qualitative methods in analyzing annotations or focus groups based on the timelines to be used in analyzing the data.
Flexibility and usability of the tool
Timelines provided for researchers with easy and flexible data collection tools. By using timelines, researchers collected data with a relatively low workload. Timeline research gave the ‘feel’ of longitudinal research without the costs and commitment of researchers. After recruiting students and informing them of the timeline assignment, the data were created relatively easily by students. When the assignment was formulated and shared with the students (See Supplemental online material), students had only a few delineating questions concerning e.g. the accuracy of timelines. Therefore, timelines can enable the data collection from a larger group of participants with low effort.
The ease of the tool was also linked to the anonymization of the data. Once timelines were ready, they provided a high level of pseudonymization. Some Finnish students, however, disclosed details of their medical diagnoses or placement locations which could help identify them from the timelines or assignments. In these cases, their teacher-researcher removed details from the assignments before sharing them with other researchers in the research group.
Researchers also perceived timelines as flexible. By modifying the assignment, researchers can limit the topic and focus on the selected research subject. Further, the contexts of the timeline assignment had a lot of variation, both in terms of different countries, cultures, and teaching practices – because it still seemed to work, the tool appears to be flexible and usable in various contexts.
Although from the researchers’ perspective, the tool was quite effortless, it can be burdensome for the student requiring time and effort to complete timelines. Indeed, regarding flexibility and usability, students presented contradictory experiences. Some students considered timelines as an easy, enjoyable, and interesting way to reflect own experiences and to observe well-being. However, some students experienced timelines burdensome. For example, a few Finnish ECE students felt that timelines caused additional workload among other assignments they had to do whilst in teaching practice. However, most Finnish students provided timelines with abundant, detailed text. In this research group, timelines were used as part of course completions, with the aim of avoiding causing additional workload for students. The research team also considered how it would affect results if timelines were used as a course assignment and were not voluntary tasks.
Some students were pleased that timelines provided flexible possibilities to modify assignments later, for example, make corrections and add details. Students often explained that their timelines were a work in process and looked ‘a complete mess’ as one participant stated. For example, students in England produced several drafts, unprompted, from the timeline in a planning phase and two English students were keen to make their timelines ‘look tidy, not a mess like my experience of placement was!’. While sketching the timeline they realized that initially they had ‘missed out’ a few events and that by thinking about their experiences chronologically they were able to add in additional details – often moments of high well-being which were initially forgotten or overlooked.
Suitability for reflecting well-being and promoting professional development
Both researchers and students highlighted the benefit of timelines as a reflective and reflexive tool, suggesting that it aided them in reflecting on their overall experience of well-being. Therefore, the researchers considered that timelines could support the understanding of well-being and its connection to professional development. Similarly, students experienced that timelines supported them to look at experiences from a broader perspective and therefore promoted an understanding of their experiences, feelings, and emotions. At its best, this kind of reflection provided experiences in learning and professional development, as described by one of the Finnish students:
Coming back to positive experiences, in the form of this assignment, for example, put a smile on my face and cheered me up. Coming back to the assignment is good when you feel that things are not working out at all. … I find that this kind of compilation of positive things and successes at work or generally in life, for example, is helpful in those situations when you feel that things don’t work or go as planned … you can notice how many times you have succeeded before and in what ways. It then puts things into perspective and a single unsuccessful event does not carry too much weight in comparison to positive experiences and successes.
An English student noted that timelines would have been a beneficial part of the evidence collected from his school experience as;
..it proves there were highs too, that being on placement wasn’t plain sailing from A to B but I made it!
Since the goal of the timeline as a course assignment is to promote students’ thinking and learning, the researchers’ discussed that the timeline inevitably affects what topics students select for the assignment. Thus, the researchers noted it was important that the support of timelines for reflection is considered when assessing the subjective nature of the data and results.
Researchers also used timelines as a prompt in discussing experiences of well-being in focus groups, suggesting timelines also provided a useful tool for supporting students’ common reflection and discussion. From an ethical point of view, when the timeline was used as a prompt for the focus group, they offered tangible support in the discussion which dealt with a very personal topic and which had the potential to be emotive. As students were talking about an artefact – the timelines – instead of talking about their experiences this provided some perceived distance from the personal recounts and allowed choice as to which aspects from the timeline were chosen to be discussed. Also, students both in Finland and England found the timeline experiences beneficial and positive, suggesting they would make timelining a regular part of teaching practice or the weekly meeting agenda with school-based mentors whilst on placement, to provide them with a purposeful and autonomous stimulus for discussion and reflection. The researchers also highlighted the benefits of timelines for teacher educators. Timelines provided researchers with information about students’ experiences and how their well-being can be supported as well as information on various issues that can be developed for promoting students’ well-being and professional development. Such knowledge can be utilized in the development of teacher training.
Discussion
This section will discuss students’ and researchers’ experiences of using timelines considering the phases of the process from Sheridan et al. (Citation2011). When reporting on their use of timelining in particular, Sheridan et al. (Citation2011) considered the process in three discrete sections: documentation – or ‘drawing the lines’, extension – ‘beyond the lines’, and reflection – ‘between the lines’. However, it was acknowledged that this discrete consideration of the process of timelining was artificial and that these processes were actually concurrent and interwoven, with reflection and extension often occurring simultaneously (Sheridan et al. Citation2011). In this research, timelines were used as a data collection tool both individually and as a prompt in focus groups.
Throughout students’ learning and study, experiences of well-being were affected by social interactions in their learning environment including peers and teacher educators, as well as school staff and pupils in teaching practice. Daily encounters and situations generated emotions and experiences that were important in understanding students’ well-being (see Diener et al. Citation2011). Timelines provided a feasible and motivating tool for students to reflect and manifest the range of emotions and experiences they experienced during teaching practice and an innovative data collection tool that enabled a personal touch motivated participants to provide more elaborate data for both research and professional development purposes.
Drawing the lines
The definition of well-being by Dodge (Citation2012, pp. 229–230) provided us with the flexibility to ask participating students to draw timelines illustrating their resources and challenges related to their well-being which provided scope to include a range of factors and contexts which were easily translated into the different languages. Timelines were a particularly flexible tool not only for working cross-culturally, but they also provided the possibility of being distributed to participants, completed and returned electronically – either as a result of COVID-19 lockdowns or personal preferences – or to be completed in-person and face-to-face. Timelines as a data collection tool afforded participants the autonomy to include labels, text, pictures, or symbols depending on their own preferences. Drawing the timelines was a process that enabled sketching before the final artefact. Sheridan et al. (Citation2011, p. 561) found for their participants too, that timelines were ‘malleable, open to change, fine tuning and augmentation’ and were rarely in a finished state but could be added to during the discussion – something that occurred with English participants. Indeed, this made the actual process of timelining much longer than initially anticipated with participants making multiple revisions and restarts and continuing to acknowledge that they had ‘forgotten to add that’ to their timeline during the focus group. Making clear that timelines would not be expected to be complete and might be untidy could have been supportive for participants and limited the number of attempts they made, reflecting Pain’s (Citation2012) assertion that visual methods enhance data presentations. Although it could be argued that the data collected from the timelines allowed an understanding of experiences of well-being that would not have been possible with more traditional methods such as interviews, it was also the case that the data were ‘messy’ and challenging to present (for participants and researchers) in a way that looked attractive. Timelining has also been used as an aspect participatory diagramming (Jackson Citation2013, p. 415) which again focuses on enabling participants to;
… deconstruct or reconstruct the meanings and structure of their lives and to convey this meaning and structures to others.
It can be argued that the research tool of timelining has supported individuals to create their ‘reality’ using their experiences, following an approach that assumes knowledge is constructed, rather than created (Adriensen Citation2012). Timelining supports a constructivist approach, as well as a broader interpretivist aim; viewing the social realm as requiring a different way of knowing to that of the natural sciences (Pasque Citation2013). There may be more than one way of knowing about a social phenomenon, and the ‘scientific method’ may not be as appropriate for investigating or questioning these realities as intuitive, interpretative approaches (Bordo Citation1986).
Participatory diagramming has been noted as being particularly helpful in overcoming any linguistic barriers (Pain Citation2012, Jackson Citation2013) that were essential in this cross-cultural collaborative research project. Previous European (Germany, Netherlands, Denmark, Finland, England) pilot research conducted (Thompson et al. Citation2020) found that, despite very different training routes, participants experienced peaks and troughs in well-being over their training regardless of which country and context they were training in.
The process of drawing and annotating the timelines mirrors Berends (Citation2011, p. 2) view that timelines helped to support ‘recollection and sequencing’ in chronological order, important in highlighting moments of high well-being which were initially forgotten or overlooked. As a psychological phenomenon, this reflects ‘negativity bias’ where people pay more attention to negative and bad events compared to good ones (Baumeister et al. Citation2001). Negativity bias is reflected in education where research has focused on what causes stress for teachers, rather than what might enhance well-being (Roffey Citation2012). Timelines as a graphical illustration, thus, helped the students to reflect the whole spectrum of emotions and experiences which can provide more versatile, authentic data as well to put into perspective various experiences, in line with the definition of well-being of Dodge et al. (Citation2012) who consider well-being as an equilibrium state of resources and challenges. Recognizing ‘a complex and dynamic interplay of positive and negative experiences’ refers to human flourishing (Lomas and Iztvan Citation2016) that relates to well-being. In this sense, using timelines not only provides a tool to study well-being but also may support participants’ flourishing and well-being, even in the times of emergency such as COVID-19 pandemic.
Timelines were considered mostly as an enjoyable and accessible way to participate in research and observe well-being. Students’ ability to choose the level of detail and style of the timelines reflects their autonomy Ryan and Deci (Citation2017) notes as basic psychological needs among competence and relatedness. In other words, providing a relatively free task assignment in drawing the timeline has the possibility to strengthen participants’ well-being by supporting their autonomy. Also, timelines enabled participants to provide artistic characteristics while reflecting their well-being. According to a scoping review by Fancourt and Finn (Citation2019), an abundant body of evidence shows the health and well-being benefits of the arts. However, perfect solutions do not exist (Fancourt and Finn Citation2019) and, therefore, timelines can be seen to provide a widely flexible and functional tool that suits most participants. Also, positive experiences in filling in timelines highlight ethical aspects in research practices, such as beneficence and non-maleficence (Solbakk et al. Citation2021).
Beyond the lines
For the English participants, this aspect largely incorporated the discussion of the timelines as a group. Here, many of the advantages Pain (Citation2012) highlighted became apparent, reflecting her suggestions that visual methods can facilitate communication and build rapport, which in this case was between participants in the focus group. For the Finnish participants, ‘beyond the lines’ was mostly connected with the annotations and the reflection that students employed as a part of their timeline assignment. A change in observing their own well-being on a daily or weekly basis over the whole teaching practice period provided them with a different viewpoint and also distanced the students from their experiences. Instead of encouraging dialogue, this shift enabled the students’ personal reflection in the past and present, and prompted reflection of the future, reflecting Baumeister et al. (Citation2016), view that people concentrate more on future than the past because they can affect the future. The possibility of using timelines not only to reflect the past and present but also to anticipate the future provides an interesting option for further research.
All participants annotated their timelines, despite no requirement to do so in the UK as Berends (Citation2011) contents, this may be because timelines can facilitate descriptive elements which she describes as including events and feelings as well as ‘interpretative’ elements which can include ‘causal relationships’. Causal relationships in this research included both visual symbols, such as arrows and lines in timelines, and verbal annotations.
When timelines are used individually as research data, as was the case in Finland, no opportunities were provided for researchers to ask deeper and clarifying questions, which may produce a potential for misunderstandings or misinterpretations. Also, the quantity of annotations varied between the participants, to gain deeper knowledge on participants’ well-being and to strengthen the research data, documents such as timelines are mainly used in conjunction with other qualitative research methods, such as interviews (Bowen Citation2009). As Given (Citation2008, p. 942) suggests formative approaches relocate ‘the authority of authorship and interpretation to the participants and away from the researcher’. Instead of complete objectivity or subjectivity, we sought ‘intersubjectivity’ where the duality of gaining an understanding of the participants was necessary, placing the emphasis on communication and shared meaning (Morgan Citation2007, Wall et al. Citation2012) rather than objective and impersonal numerical measures.
Creating timelines has the possibility to work as a tool to support students’ reflection and thus professional development. Teaching practice is an important period relative to students’ professional development. During these practices, it is important to draw attention to cognitions, emotions, and meanings emerging in students’ thinking as well as to the fears and expectations concerning their future profession (Caires et al. Citation2012). Reflection is one of the key elements in professional development in later work life (Toom et al. Citation2021) and timelines could be workable tool to practice these skills during studies.
Between the lines
The ability to help participants reflect was a key strength of timelines. Sheridan et al. (Citation2011, p. 561) noted that timelines;
… allowed considerable time for reflection and contemplation. Through timelining, participants become researchers of their own lives.
In this research, students were provided with a timeline template where they reflected on their well-being during one period of teaching practice. Time is a key feature and a meaningful element of graphic elicitation that is inextricably woven with narrative (Sheridan et al. Citation2011, pp. 553–554), even though time is not a neutral concept. While people are concretely individuated as narrative persons (Mackenzie Citation2014, 160, as quoted in Køster Citation2017), our life histories are more than our narratives (Køster Citation2017).
Timelines visualizes the inevitable part of well-being, equilibrium/homeostasis, by illustrating the continuous fluctuating state between challenges and resources that affect individuals (see Dodge et al. Citation2012). Timelines as a research tool enable analysis of the fluctuating states of self-perceived well-being both quantitatively and qualitatively. In this research, the fluctuation stood visually out since days were used as the key in timelines. A daily-based reflection enabled simultaneously the appearance of the specific, longer-term key events, emotions, and experiences. Even though time is crucial in the timeline method, authors recognize that time is not a neutral concept that should be critically considered in employing timelines in research.
Conclusions and next steps
This study sheds light on timelines as a tool within visual methods to study well-being from the participants’ and researchers’ viewpoints. The study contributes to knowledge by suggesting that timelines are a helpful tool to use for generating data and increasing understanding about participants’ well-being. Strengths in using timelines are in their capability to reflect temporal aspects and changes in well-being that include not only negative (‘lows’) but also positive (‘highs’) and specific resources in supporting well-being. Also, a wider and international research collaboration requires ongoing discussions to gain a shared understanding of how the timelines are completed and how different contexts may influence them. Scheduling the timeline and students’ workload needs to be considered as well when planning a timeline assignment as a part of coursework.
As a research tool, timelines enable the fluid, constantly changing characteristics of well-being to appear in participants’ drawings and annotations. Further studies may, therefore, use timelines as a pedagogical tool or in participatory action research where students have an opportunity to participate in analyzing the timelines and research activities aimed at supporting a change in the lives of participants. SWB is based on individual experiences and interpretations, and it would be necessary to pay attention to the level of SWB the students express. As SWB is shown to be quite stable (Diener et al. Citation1999) information would be needed on elements that strongly change students’ sense of well-being. Also, future studies may consider not only personal well-being but also community well-being such as in teacher education, teaching practice, or school classrooms. Since there is no panacea for studying and supporting well-being (in the case of the arts and well-being, Fancourt and Finn Citation2019), alternative ways to include all people to reflect and maintain or support their well-being need to be considered in the future.
Declaration of interest statement
The authors report there are no competing interests to declare.
Supplemental Material
Download MS Word (28.3 KB)Acknowledgements
The data used in this report has been collected with the support of Erasmus+, Call 2020 Round 1 KA2 – Cooperation for innovation and the exchange of good practices, KA203 – Strategic Partnerships for higher education and the British Council. The authors are grateful to Tiina Muhonen for her contribution to finalize the manuscript and to all the students who participated in the research.
Disclosure statement
No potential conflict of interest was reported by the authors.
Additional information
Funding
References
- Acocella, I., and Cataldi, S., 2021. Using focus groups. Theory, methodology, practice. London: SAGE.
- Adriensen, H.K., 2012. Timeline interviews: a tool for conducting life history research. Qualitative studies, 3 (1), 40–55.
- Azorín, C., 2020. Beyond COVID-19 supernova. Is another education coming?. Journal of professional capital and community, 5 (3–4), 381–390.
- Barbour, R., 2014. Other sources of qualitative data. In: Rosaline Barbour, ed. In Introducing qualitative research. London: SAGE, 179–202.
- Bartlett, R., and Milligan, C., 2015. What is diary method? London: Bloomsbury.
- Bates, E., Kaye, L., and McCann, J.J., 2017. A snapshot of the student experience: exploring student satisfaction through the use of photographic elicitation. Journal of further and higher education, 9486, 1–14.
- Bates, E., et al., 2017. “Beyond words”: a researcher’s guide to using photo elicitation in psychology. Qualitative research in psychology, 14 (4), 459–481.
- Bauer, J.J., et al., 2019. What growth sounds like: redemption, self-improvement, and eudaimonic growth across different life narratives in relation to well-being. Journal of personality, 87 (3), 546–565.
- Baumeister, R.F., et al., 2001. Bad is stronger than good. Review of general psychology, 5 (4), 323–370.
- Baumeister, R.F., Vohs, K.D., and Oettingen, G., 2016. Pragmatic prospection: how and why people think about the future. Review of general psychology, 20, 3–16. doi:10.1037/gpr0000060.
- Bowen, G.A., 2009. Document analysis as a qualitative research method. Qualitative research journal, 9 (2), 27–40.
- Berends, L., 2011. Embracing the visual: using timelines with in-depth interviews on substance use and treatment. Qualitative report, 16, 1–9.
- Bordo, S., 1986. The cartesian masculinization of thought. Signs: journal of women in culture and society, 11 (3), 439–456. doi:10.1086/494250.
- Braun, V., and Clarke, V., 2006. Using thematic analysis in psychology. Qualitative research in psychology, 3 (2), 77–101.
- Brown, A., 2013. A timeline reflection: emboldened learning from my stories. International practice development journal, 3 (2), 81–89.
- Burton, A., Hughes, M., and Dempsey, R.C., 2017. Quality of life research: a case for combining photo-elicitation with interpretative phenomenological analysis. Qualitative research in psychology, 14 (4), 375–393.
- Caires, S., Almeida, L., and Vieira, D., 2012. Becoming a teacher: student teachers’ experiences and perceptions about teaching practice. European journal of teacher education, 35 (2), 163–178.
- Collings, R., Swanson, V., and Watkins, R., 2014. The impact of peer mentoring on levels of student wellbeing, integration and retention: a controlled comparative evaluation of residential students in UK higher education. Higher education, 68 (6), 927–942.
- Department for education, 2018. Analysis of teacher supply, retention and mobility. London: DfE.
- Diener, E., et al., 1999. Subjective well-being: three decades of progress. Psychological bulletin, 125, 276–302.
- Diener, Ed. 2006. “Guidelines for national indicators of subjective well-being and ill-being”. Applied research in quality of life 1 (2): 151–157.
- Diener, E., Oishi, S., and Lucas, R.E., 2011. Subjective well-being: the science of happiness and life satisfaction. In: Shane J. Lopez, and C. R. Snyder, eds. Oxford handbook of positive psychology, 2nd Edition. New York: Oxford University Press, 187–194.
- Dodge, R., et al., 2012. The challenge of defining wellbeing. International journal of wellbeing, 2 (3), 222–235.
- Dwyer, A.L., and Cummings, A.L., 2001. Stress, self-efficacy, social support, and coping strategies in university students. Canadian Journal of Counselling and Psychotherapy/Revue canadienne de counseling et de psychothérapie, 35 (3), 208–220.
- Fancourt, D., and Finn, S. 2019. What is the evidence on the role of the arts in improving health and wellbeing? A scoping review. WHO, Health evidence network synthesis report 67. https://apps.who.int/iris/bitstream/handle/10665/329834/9789289054553-eng.pdf.
- Faupel, S., et al., 2016. Stress at school? A qualitative study on illegitimate tasks during teacher training. Frontiers in psychology, 7, 1410–1410.
- Ferrier-Kerr, J.L., 2009. Establishing professional relationships in practicum settings. Teaching and teacher education, 25 (6), 790–797.
- Given, L. M., 2008. The SAGE encyclopedia of qualitative research methods. Thousand Oaks, CA: SAGE. doi:10.4135/9781412963909
- Hope, L., Anakwah, N., Antfolk, J., et al., 2022. Urgent issues and prospects at the intersection of culture, memory, and witness interviews: exploring the challenges for research and practice. Legal and criminological psychology, 27 (1), 1–31.
- Hope, L., Mullis, R., and Gabbert, F., 2013. Who? What? When? Using a timeline technique to facilitate recall of a complex event. Journal of applied research in memory and cognition, 2 (1), 20–24.
- Houghton, A.-M., and Anderson, J., 2017. Embedding mental wellbeing in the curriculum: maximising success in higher education. York: Higher Education Academy.
- İnözü, J., and Sahinkarakas, S., 2016. Exploring relations between pre-service English teachers’ psychological and social well-being and their perceptions of positive classroom environment. Eurasian journal of applied linguistics, 2 (2), 79–93.
- Jackson, K.F., 2013. Participatory diagramming in social work research: utilizing visual timelines to interpret the complexities of the lived multiracial experience. Qualitative social work, 12 (4), 414–432.
- Jindal-Snape, D., and Rienties, B., 2016. A social network perspective on the affect, behaviour and cognition of international and host-national students. In: Divya Jindal-Snape, and Bart Rienties, eds. In multi-dimensional transitions of international students to higher education. London: Routledge, 21–38.
- Kashdan, T.B., Biswas-Diener, R., and King, L.A., 2008. Reconsidering happiness: the costs of distinguishing between hedonics and eudaimonia. The journal of positive psychology, 3 (4), 219–233.
- Klassen, R.M., and Durksen, T.L., 2014. Weekly self-efficacy and work stress during the teaching practicum: a mixed methods study. Learning and instruction, 33, 158–169.
- Køster, A., 2017. Personal history, beyond narrative: an embodied perspective. Journal of phenomenological psychology, 48 (2), 163–187.
- La Paro, K., et al., 2018. A systems perspective on practicum experiences in early childhood teacher education: focus on interprofessional relationships. Early childhood education journal, 46 (2), 365–375.
- Linley, P.A., et al., 2009. Measuring happiness: the higher order factor structure of subjective and psychological well-being measures. Personality and individual differences, 47 (8), 878–884.
- Lomas, T., and Iztvan, I., 2016. Second wave positive psychology: exploring the positive-negative dialectics of wellbeing. Journal of happiness studies, 17, 1753–1768.
- Mackenzie, C., 2014. Embodied agents, narrative selves. Philosophical explorations, 17 (2), 154–171.
- Macnaughten, P., and Myers, G., 2004. Focus groups. In: Clive Seale, Giampietro Gobo, Jaber Gubrium, and David Silverman, eds. Qualitative research practice. London: SAGE, 65–79.
- Marshall, E.A., 2019. Timeline drawing methods. In: Pranee Liamputtong, ed. Handbook of research methods in health social sciences. Singapore: Springer, 1183–1199.
- Masters, G. N., 2004. Conceptualising and researching student wellbeing. 1997-2008 ACER Research Conference Archieve: supporting student wellbeing: what does the research tell us about social and emotional development of young people? Adelaide: ACEReSearch, pp. 1–6.
- Mena, J., Hennisen, P., and Loughran, J., 2017. Developing pre-service teachers’ professional knowledge of teaching: the influence of mentoring. Teaching and teacher education, 66, 47–59.
- Morgan, D.L., 2007. Paradigms lost and pragmatism regained. Journal of mixed methods research, 1 (1), 48–76.
- Nes, R.B., et al., 2006. Subjective well-being: genetic and environmental contributions to stability and change. Psychological medicine, 36 (7), 1033–1042.
- Netolicky, D.M., 2020. School leadership during a pandemic: navigating tensions. Journal of professional capital and community, 5 (3–4), 391–395.
- Olsen, S.T. 2017. How can a focus on teacher well- being in pre-service training promote the resilience of primary school student teachers? https://www.semanticscholar.org/paper/How-Can-a-Focus-on-Teacher-Well-being-in-Training-Olsen/ee60bed21f8794e40fa0703a91290e8eec8f77b1.
- Ortega-Alcázar, I., and Dyck, I., 2012. Migrant narratives of health and well-being: challenging ‘othering’ processes through photo-elicitation interviews. Critical social policy, 32 (1), 106–125.
- Pain, H., 2012. A literature review to evaluate the choice and use of visual methods. International journal of qualitative methods, 11 (4), 303–319.
- Paquette, K.R., and Rieg, S.A., 2016. Stressors and coping strategies through the lens of early childhood/special education pre-service teachers. Teaching and teacher education, 57, 51–58.
- Pasque, P.A., 2013. (Re)membering and (re)living: a methodological exploration of postmodern and constructivist feminist approaches to interviewing women leaders in higher education. Naspa journal about women in higher education, 6 (1), 99–126.
- Phillippi, J., and Lauderdale, J., 2018. A guide to field notes for qualitative research: context and conversation. Qualitative health research, 28 (3), 381–388.
- Pillen, M., Douwe Beijaard, D., and den Brok, P., 2013. Tensions in beginning teachers’ professional identity development, accompanying feelings and coping strategies. European journal of teacher education, 36 (3), 240–260.
- Pink, S., 2013. Doing visual ethnography. 3rd Ed. London: SAGE.
- Pollard, E.L., and Lee, P.D., 2003. Child well-being: a systematic review of the literature. Social indicators research, 61 (1), 59–78.
- Putwain, D., 2007. Researching academic stress and anxiety in students: some methodological considerations. British educational research journal, 33 (2), 207–219.
- Richards, N., 2011. Using participatory visual methods. Realities at the morgan centre, 1–8. www.representing-ageing.com.
- Robson, C., 2011. Real world research. 3rd Ed. Chichester: Wiley.
- Roffey, S., 2012. Pupil wellbeing – teacher wellbeing: two sides of the same coin? Educational and child psychology, 29 (4), 8–17.
- Ryan, R.M., and Deci, E.L., 2017. Self-determination theory: basic psychological needs in motivation, development, and wellness. Guilford Publications.
- Sahlberg, P., 2020. Will the pandemic change schools? Journal of professional capital and community, 5 (3–4), 359–365.
- Samman, E., 2007. Psychological and subjective well-being: a proposal for internationally comparable indicators. Oxford development studies, 35 (4), 459–486.
- Seldon, A., and Martin, A., 2017. The positive and mindful university. Oxford: HEPI.
- Sheridan, J., Chamberlain, K., and Dupuis, A., 2011. Timelining: visualizing experience. Qualitative research, 11 (5), 552–569.
- Sim, J., 1998. Collecting and analysing qualitative data: issues raised by the focus group. Journal of advanced nursing, 28 (2), 345–352.
- Solbakk, J.H., et al., 2021. Back to WHAT? The role of research ethics in pandemic times. Medicine, health care and philosophy, 24, 3–20.
- Standal, Ø.F., Moen, K.M., and Moe, V.F., 2014. Theory and practice in the context of practicum: the perspectives of Norwegian physical education student teachers. European physical education review, 20 (2), 165–178.
- Thompson, S., et al., 2020. Averting the crisis in trainee teacher well-being – learning lessons across European contexts: a comparative study. Journal of comparative & international higher education, 12 (Fall), 38–56.
- Toom, A., et al., 2021. Professional agency for learning as a key for developing teachers’ competencies? Education sciences, 11 (7), 324.
- Van Schagen Johnson, A., La Paro, K.M., and Crosby, D.A., 2017. Early practicum experiences: preservice early childhood students’ perceptions and sense of efficacy. Early childhood education journal, 45 (2), 229–236.
- Vartuli, S., Snider, K., and Holley, M., 2016. Making it real: a practice-based early childhood teacher education program. Early childhood education journal, 44 (5), 503–514.
- Väisänen, S. 2019. Student teachers’ study well-being in teacher education. How is it constructed and regulated during studies? Thesis (PhD). University of Eastern Finland.
- Väisänen, S., et al., 2018. Student teachers’ proactive strategies for avoiding study-related burnout during teacher education. European journal of teacher education, 41 (3), 301–317.
- Wahyuni, D., 2012. The Research Design Maze: understanding paradigms, cases, methods and methodologies. Journal of applied management accounting research, 10 (1), 69–80.
- Wall, K., Hall, E., and Woolner, P., 2012. Visual methodology: previously, now and in the future. International journal of research & method in education, 35 (3), 223–226.
- Yang, A., et al., 2008. The impact of adult attachment and parental rearing on subjective well-being in Chinese late adolescents. Social behavior and personality: an international journal, 36 (10), 1365–1378.