
ABSTRACT
Physiological measures associated with emotional expressions have been used extensively in lab- and, more recently, digital-learning settings. However, the portable and ubiquitous nature of hardware that measures these physiological features makes them particularly useful in situations where you do not want the hardware to be too obtrusive, like in contexts of informal learning. In this proof-of-concept study, we apply skin conductance methods that measure Electrodermal Activity (EDA) to a family everyday activities context, in which a parent and their children, complete several science learning activities, while being recorded by both video and EDA hardware. We analyse the resulting data in three different ways: (i) a peak analysis in software recommended by the hardware provider, (ii) a conventional, qualitative microanalysis, and (iii) a method mainly used by econometricians to discover ‘structural breaks’ in time series data. We conclude that all three provide a piece of the overall puzzle, revealing up- and down-sides of each method.
Introduction
Emotions play an important role in learning (Bellocchi et al. Citation2016, Staus and Falk Citation2017), both to the detriment of learning, for example anxiety, as to the benefit of learning, for example, positive engagement with the learning content. Many studies measure emotional engagement through self-report and observational studies, which are challenging methodologies (e.g. see Mauss and Robinson Citation2009), therefore, there is a growing interest in exploring other methodologies for emotional expressions. With technological advances, one such method is the use of tools that measure skin conductance, called Electrodermal ActivityFootnote1 (EDA). In this proof-of-concept article, we look at methodological challenges of three methods used to analyse EDA data, as a relatively new approach within the educational field. EDA is associated with arousal and can therefore be used to detect emotions. Our article explores the affordances of EDA in informal learning settings, which presumably elicit a wider range of emotions (Rappolt-Schlichtmann et al. Citation2017). As EDA previously has mainly been used in laboratory settings, improvements in wearability of the technology have meant that EDA tools could be useful for measuring emotional expressions in naturalistic settings, amongst those are informal learning settings. In this methodological article, we use data collected from one family learning science at home. We demonstrate a new approach for exploring individual emotional expressions during family science activities using EDA measures, where a parent’s (the mother in this case) emotional expressions are measured with EDA while engaging in science activities with her children in addition to a more traditional video-based observational approach. The significance of this research lies in its potential to make research on emotions more accessible and manageable in naturalistic settings, using the technology of EDA. We suggest that EDA, while novel to research in educational settings, has the potential to help us better identify emotional expressions in situ. In the article, we first describe the literature around emotions, measurement of emotions, and research in educational settings. We then describe the methodology and context we apply our EDA approach to, using three complementary approaches to analysing EDA data. Finally, we compare the three approaches and draw methodological conclusions.
Literature review
In this work, a methodological focus on EDA meets a substantive focus on informal science learning. We therefore first briefly report on emotions and research on measuring emotions. We then, describe one physiological approach using EDA, and some prior educational research with it. Finally, we describe how this leads to our study’s aim.
Emotions, emotional expressions, and emotional engagement
Modern biology recognizes the fact that humans are emotional and social creatures, yet the educational field mainly focuses on cognitive skills and fails to consider more affective and social domains related to learning (Immordino-Yang and Damasio Citation2007). Although emotions are recognized as central to learning (Pekrun Citation2006, Staus and Falk Citation2017), relatively little research explores emotions in naturalistic settings (not in the laboratory), how emotions relate to learning during interactions, and what factors are associated with emotional experiences during learning processes (Bellocchi and Ritchie Citation2015).
Emotions are multidimensional phenomena that include a combination of physiological changes, expressive body movements, and appraisals of situational contexts and cues (Thoits Citation1989). Researchers from different disciplines describe emotions differently. Some, for example, treat emotions such as happiness, anger, and fear as discrete entities, while others refer to the different dimensions of emotions such as arousal. There are three dimensions of emotions: (1) Valance/pleasure, (2) Arousal/activation, and (3) Dominance/control. Those emotional states range from boredom/sleepiness through intermediate states to excitement (Russell and Mehrabian Citation1977). In this research, we consider arousal as a psychophysiological indicator for emotions. Evidence suggest that arousal is more likely to command attention and be remembered in the future, thus potentially leading to more successful learning outcomes (Staus and Falk Citation2017). In contrast, the relationship between valence and learning outcomes is less clear with evidence that both positive and negative emotions can be associated with successful learning outcomes in different contexts (Pekrun Citation2014).
Research on emotions often struggles with the fact that although emotions are transient feelings that can trigger unconscious displays of our inner states, over time we learn to control the visible expression of certain emotions to adhere to social expectations and the fact that emotions are not always shared (Bellocchi and Ritchie Citation2015). Since emotions are hard to describe and even harder to detect, in this article we will adopt Hufnagel and Kelly’s (Citation2018) approach and refer to ‘emotional expressions’, as opposed to emotions. Emotional expression is used here to describe emotions that are presumed to be communicated by discourse (talk and action). Another assumption commonly presented is that emotional engagement will promote learning (Rappolt-Schlichtmann et al. Citation2017), however, engagement is defined differently by different scholars. Engagement is generally conceptualized as a multidimensional construct including behavioural, emotional, and cognitive dimensions, for the purposes of this study we focused on attention as one indicator of engagement.
Measuring emotions through self-report and observations
Traditionally, a popular way to measure and report on various topics, amongst those are emotions related to learning, has been self-report. As methods of self-report ‘depend heavily on recollected emotions, which may not be representative of an individual’s emotional response’ (Hadinejad et al. Citation2019, p. 467), with different time frames assessing qualitatively different sources of self-knowledge (Robinson and Clore Citation2002). The time between when emotions are elicited and participant reports leads to recall inaccuracy. Recall through self-report is also subject to cognitive bias, reinforcing positive self-description (see Brodien Hapairai et al. Citation2018, for an example in tourism research). Self-report cannot measure emotions continuously in real time, which is the case when respondents are exposed to video stimuli (Li et al. Citation2018). Many of the processes involved are subconscious and non-discrete (Poels and Dewitte Citation2006). According to Scherer (Citation2009), emotions have a dynamic architecture, which implies that emotions from particular recalled moments seldom can be reported. Despite the challenges described above, self-report has been used extensively in researching emotions. One prominent research by Bradley and Lang (Citation1994) used the Self-Assessment Manikin (SAM) to measure emotions (while exposed to pictures) and proved to be fairly reliable. However, this was done in a laboratory setting, with the self-report in close proximity to the stimuli. It is our contention that the emotions experienced in educational settings are more akin to the numerous examples where self-report would not be sufficient, for example, like emotions while experiencing commercials (Mano Citation1996), tourism advertisements (Hadinejad et al. Citation2019) or extreme sports (Hetland et al. Citation2018). Additionally, self-report can be very intrusive, especially during informal science learning activities, interrupting the flow and disrupting engagement. Therefore, other tools are needed to measure emotions in those settings.
Another way to measure emotional expressions is observations, preferably recorded observations. As many definitions describe, some emotions will have distinct observable behaviour such as gestures, facial expressions, and verbal expressions (see Ekman’s Atlas of Emotions https://atlasofemotions.org/). For example, the definition of surprise: ‘The feeling when you realize something good or nice just happened, which you did not expect. When surprised, we typically widen our eyes, open our mouth, and raise our eyebrows’ (Noordewier and Breugelmans Citation2013). This can be accompanied with a gasp or other verbal response. Those emotions are easily detectable by observation. However, some emotions are harder to detect, and some emotions are hard to distinguish, for example, the difference between joy and happiness or fear, fright and worry. Those are especially difficult to detect by merely observing a person and require time-consuming techniques such as microanalysis (Hufnagel and Kelly Citation2018). Microanalysis is often used while analysing video data, when the researchers view the recording, frame-by-frame, looking at all modes of communication to describe the interaction (in this case, the emotions that can be detected by observable behaviour, such as smile, widening eyes, frown, etc.). Microanalysis is a common qualitative methods, used in various situations, not restricted to analysing emotions. In the findings section, we explain how we used this method to identify emotions.
In response to the criticism against the self-report measurements of emotions and observational studies, particularly in informal settings, researchers have turned to physiological techniques to assess emotional responses; one such techniques being EDA. Using EDA measures can help us uncover those unshared emotions that are not always expressed, consciously or unconsciously, in a behaviourally detectable way.
Measuring emotion through electrodermal activity
Changes in electrodermal activity are associated with heightened levels of arousal (Dawson et al. Citation2017). Arousal of the sympathetic nervous system (as a result of stimulation) activates sweat glands, especially near a person's hands and feet (Matsumoto et al. Citation1990). Sweat is a conductive liquid that yields measurable change in conductivity, even without any sweat reaching the skin's surface (Cain and Lee Citation2016). Sensors attached to specific areas on the skin can measure the changes of skin conductivity. The hardware will include two adhesive electrodes attached to the skin, most commonly the palm of the hand or fingers (but can also be on the wrist), electric wires with low voltage, using sweat as conductive that close electric circuit between the electrodes, thus indicating a change to skin conductivity. This data is exported and analysed using various software. A spike or sudden rise in skin conductance that is detected by the software, referred to as a ‘peak’, indicates arousal of the sympathetic nervous system, which is associated with emotions. It is this phenomenon we use as a starting point for this study. It is important to point out that EDA is not exclusively a function of emotional expressions but encompass a variety of other bodily functions, such as cognitive load (Berntson and Cacioppo Citation2000). It is also worth mentioning that EDA can only detect changes to skin conductance, however, do not indicate the type of emotions (e.g. anger and happiness will produce the same peaks). Those must be considered while analysing EDA data.
EDA hardware and software generate waveform peaks, which can be analysed through peak analysis. Peak analysis is done by an algorithm, that calculates the threshold of the unit of analysis (micro-Siemens – μS), as determined by the researcher (usually a default setting according to the participant, e.g. mouse, guineapig, human, etc.). The algorithm calculates the differences between measurement points to determine the peaks. This often is an automated process, embedded in the software. Some can be part of an openly available codebase, where the researcher can revise the algorithm, some are intellectual property (therefore not accessible). Most software includes artefact detection algorithm as well (for example, rapid movement of the sensors will create a false peak, that will be detected by the artefact detection algorithm and will be removed from the dataset). Manual verification by a researcher is still needed in most cases. More detailed descriptions on the peak analysis process can be found in the findings section, in the review below we mention briefly how others have used this analysis and the challenges they reported on.
A recent review by Horvers and colleagues (Citation2021) on detecting emotions through electrodermal activity in learning contexts, highlighted that research using EDA is relatively new in learning contexts, starting to be more common since 2009, when a technological ‘leap’ had afforded researchers to take EDA studies outside the lab and into the field (e.g. measure EDA in real learning contexts). In their systematic review of 27 studies, it is shown that research using EDA in learning contexts include various learning tasks (such as programming tasks, online exam, reading etc.) and virtual simulations, which are minds-on, non-physical learning activities. Most of the studies involved university students (only three included high school students and another three primary school students). None of those studies examined a family learning context. As informal science learning environments are relatively understudied in educational research anyway, compared to formal science learning in schools (Falk et al. Citation2018), a non-intrusive, relatively easy-to-use method to study emotional expressions might incentivise research in that area. This lack of research in this settings and context forms the impetus for this study an exploratory and research to study everyday family science activities, using EDA sensors to detect emotional expressions. This initial incentive to use EDA in this under-researched setting with potential to various emotional expressions led to this particular methodological article where we describe the results of our challenges while analysing the EDA data.
EDA research in an education context
In order to highlight the challenges using EDA, we will elaborate on three studies, not included in the above-named review, exploring learning in informal environments. All those studies were using the same hardware, Empatica E4 wristband (https://www.empatica.com/), where the above-mentioned sensors are located on a watch-like wristband (similar to Smartwatch). Additionally, all three studies aimed to explore the emotional expressions of research participants in informal learning environments (which is as similar to our settings as we could find). Eisenhauer (Citation2019) collected EDA measures during a theatre afterschool programme. Sixteen youths’ EDA signals were measured while performing on stage, to identify engagement. Youths were also interviewed and invited to a debriefing session right after the EDA data were collected to describe their subjective experience. The researcher used all sources of data to create ‘CSP Timelines’ (Context, Subjectivity, Physiology), using Inqscribe (version 2.2.3.258) and Matlab (R2015a) software. EDA was broken down into activities and marked with particular events, creating a unique pathway to each participant, which were presented and interpreted as part of the findings of this research. The finding highlights the different pathways for each participant, considering all data sources. The author pointed out the significance of this research in relating to a personal emotional experience that can ‘illuminating black-box processes’ (Eisenhauer Citation2019, p. 186). As a limitation, the study reports on the difficulty comparing EDA data between participants due to biological differences (e.g. different people have different physiological responses) and possible emotional states on particular days (e.g. previous emotional state such as irritation about the bus being late, can elevate the EDA levels measured). Avelar and colleagues (Citation2022) explored arousal of children and parents during shared and independent e-book reading. In this research, 71 parent–child dyads participated in experimental research design in laboratory settings. Dyads, invited to a room in a university, were randomly assigned to one of three conditions in a between-subjects design: child listening to e-book alone, child and parent reading e-book together, and child and parent reading traditional book together. Both parent and child were wearing Empatica E4 multi-sensors wristbands (see above). The participants completed pre–post questionnaires about their mood (self-report) and engaged with mindfulness activity (to create baseline). The researchers analysed the EDA measurements using Ledalab, open-source Matlab software and performed statistical analysis on the data (ANCOVA, one-way ANOVA and t-test). In addition, the researchers conducted microanalysis of emotions using video recordings of the activities. Their findings suggest that children had more arousal moments that were coded positively (happy) while reading any kind of book with a parent than alone and there were no differences in arousal (from EDA data) or emotional expression (microanalysis) for parents or children between the e-book and traditional book. Among the limitation of this research, the authors mentioned the inability to synchronize the EDA measurements and the video recordings.
In a final example, Lee et al.’s (Citation2019) research aimed to detect and identify engagement in afterschool Makerspace camps. They examined youth participating in various activities during a makerspace camp with twelve participants wearing Empatica E4 wristbands and wearable GoPro cameras to video record the activities. Participants answered a self-reported affective, behavioural, and cognitive engagement survey a few days after each camp. To analyse EDA data, researchers used work from another study (Taylor et al. Citation2015), that have used machine learning software to detect artefacts, the authors used this ‘modified peak detection code’ to analyse the EDA data and to eliminate false positives. In addition, the authors coded video segments associated with the peaks and statistically analysed the survey data. Ridgeline plots of youths’ EDA peak densities demonstrated engagement in each activity, and further findings suggested a moderate correlation between EDA and survey data. The GoPro video recordings showed that activities that emphasize personal expression elicit engagement. Lee et al.’s (Citation2019) study marks an important step towards EDA research in naturalist settings, yet, using EDA in informal contexts is not without challenges, as the authors of the few studies note. Although the Empatica E4 wristband hardware paved the way to research in naturalist settings, a reduced sensitivity due to its location on the wrist (and not fingers) and lack of ability to synchronize EDA measures and video recordings, still pose serious limitations to EDA research. Another issue raised by Horvers et al. (Citation2021) is the lack of EDA guidelines, specifying that unlike natural science where researchers follow a strict protocol, there are none for human subjects to guide the researchers through data collection and data analysis. Furthermore, EDA measures are complex, needing multiple processing steps (see Horvers et al. Citation2021 for more details).
The above research demonstrates the potential of EDA in emotions research, alongside the challenges. In this study, we wish to address some of the challenges, hoping to advance EDA research from a methodological point of view. In analysing the data for our proof-of-concept study in three different ways, we have encountered methodological issues regarding using EDA as a tool, which we will also specify in the following sections. The study contributes to the field by exploring the methodological potential of EDA during informal family science learning contexts.
Methodology
Hardware and software
We used wearable mobile tools (that could be used out in the field, not necessarily in a lab), including a vest with sensors measuring skin temperature, heart rate, chest expansion and 3D combined with two electrodes attached to the palm of the hand measuring EDA.Footnote2 This hardware is different from the wristband mentioned above mainly in the position of the sensors (palm of hands vs wrist). We used LabChart software (Equivital intellectual property) that collects psychophysiological data and has a video capture mode that allows synchronized recording of video with sensors data. In this analysis, we focus on the EDA data. The EDA is measured in a unit called micro-Siemens (μS). The sampling rate of the software was around one measurement per second.Footnote3
Research participants and setting
In this exploratory study, we had one participant, Irit, a mother of four children (Yael age 13, Ofri age 11, Yoav age 7 and Eyal age 4) and a science teacher (1st to 9th grades). She wore the sensors during five family activities (), which she chose in advance due to the preparation required. We define learning science at home as an informal learning environment, to differentiate it from a formal learning environment, school. To be more specific, we describe those activities as ‘designed’ (National Research Council Citation2009), since some activities are structured (such as the science quiz) or regulated (as homework), however, the participants have the choice to engage with those activates as they like. For example, although the lava lamp experiment is a school experiment (demonstrated by a teacher), while done at home, the children: (1) Do not need to participate, (2) Can leave when they want (as they do), (3) There is no test at the end, and they do not need to demonstrate knowledge, (4) They can offer various ways to conduct the experiment to be tested together (which is often not the case in a science classroom). As mentioned before, the focus of this research is not the informal environment, we merely collected data in this settings and using this data to demonstrate our analysis. It is, however, important to be aware of the settings, since this might affect the expressed emotions.
Table 1. Description of the activities.
Before starting the study, the researcher instructed Irit how to use the wearable sensors and how to activate the software (see data collection), so she could run the activities on her own, without the researcher present, to create a more natural setting as per the aims of our study. The activities took place at the family’s home in Israel, using materials that they have at home and representing activities they usually do at home, together. The authors wish to note that participants requested that their real names and photographs will be used, following Ethical guidelines to gain consent and assent.
In this paper, we will use the Physics homework and Invisible ink experiment as more detailed case examples; therefore, we now elaborate on these activities in more detail.
Invisible ink experiment
Davidsson online is a website providing various scientific experiments to do at home (using everyday materials), science quizzes and science-related articles (written in plain language to communicate scientific information to the public). The family regularly engage with materials on the website, as a family, and the children on their own. In this case, Irit asked the children to choose an experiment from the website they have not done before and wanted to do. They chose the Invisible ink experiment. In this experiment, you use milk to ‘write’ something on a piece of paper, when it dries out it becomes invisible. To reveal the text, you need to apply heat to the paper, burning the sugar in the milk, revealing the text (in brown colour) on the paper. When the children chose the experiment, the family watched the video together, following the instructions, step-by-step.
Physics homework
During this activity, Irit was doing seventh-grade physics homework with Yael. Yael’s science teacher gave them a task to conduct a scientific investigation at home. In the task, the students were supposed to measure the expansion of a spring (coil) when attached to a certain weight. The teacher provided each student with a spring and a measurable unit (a battery). The instructions were to: (1) attach the spring to the edge of the table (so it will dangle down), (2) measure the length of the spring using a meter, (3) attach one battery to the end of the spring, (4) measure the length again, (5) add a second battery, (6) measure the length and so on. The students were asked to calculate the differences in length and use a formula to calculate the force of the spring. Yael had the task on her phone (downloaded from the school website) and all the materials needed on the dining room table in the family living room. Irit was helping Yael with her homework, conducting the investigation together, with the aid of the instructions provided by the teacher. None of Yael’s siblings were present in the living room, however, at some point, Ofri came down from her room and distracted Irit.
Data collection
Irit was instructed on how to use the sensors and LabChart software that recorded the data. Irit decided on the five activities in advance. When she decided to conduct data collection, she set up the computer with the software and wore the sensors. She gathered the children (for each particular activity) and began recording the data. The sensors on her body started measuring psychophysiological data the second the software on the computer was activated. The software also video-recorded the activity using the laptop web camera (see ). Irit also used an additional GoPro camera (on a tripod) as backup to record the activities from a different angle ().
Figure 1. Example of the LabChart output (all measures, left) and an image from the back-up camera (Invisible ink experiment).
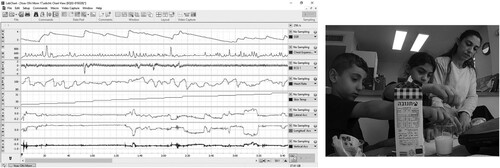
Data collected by LabChart are displayed as diagrams shown in . In the case of EDA output, the software allows coding on the diagram itself (see ), but also have the option to export the measurements to a spreadsheet, choosing a sampling rate of a minimum of one second, as well as export peak values calculated by the software’s algorithm.
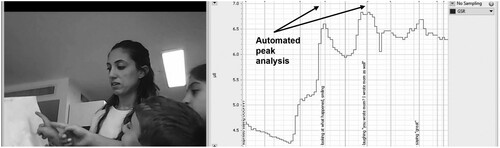
Figure 2. Coding peaks using the software, Invisible ink experiment.
Data analysis
To analyse the data, we used the following methods:
Peak analysis – using the built-in feature in the software and manual peak verification. This uses methods available by the software provided with the skin conductance hardware.
Microanalysis – coding the video recordings to observable emotions, using the definitions of emotions in the Appendix.
Structural breaks – identify shifts in trends. This is a method that typically is used in research with time series, particularly popular in the economic sciences.
In the findings section we will describe each data analysis method in more detail and present an analysis of our data.
Findings and comparison of the methods
Peak analysis
We used the Peak Analysis Module for LabChartFootnote4 that automatically detects and analyses peaks in recorded waveforms (also see ). Peaks detected with the software default adjustment for 0.05 μS threshold and a minimum peak height of 2 standard deviations. LabChart has a built-in artefact detection algorithm to eliminate false peaks. In addition, a researcher verified peaks manually and if needed, eliminated additional peaks. We conducted the analyses in the following steps:
Automated peak analysis – Using this feature, create circles above the EDA output diagram to indicate which is to be considered a peak (see ). In the Invisible ink experiment, the automated peak analysis (using the parameters stated above) detected 46 peaks, in the Physics homework, 69 peaks.
Artefact deletion – During the manual verifications, false positive peaks were eliminated, for example, when Irit was touching the sensors resulting with a peak that was not due to stimulus.
Peak smoothening – In addition, we performed an analytical approach referred to as ‘peak smoothening’ (Lee et al. Citation2019). This method is used when there are two (or more) peaks very close together, e.g. EDA levels of first peak do not ‘go down’ and start raising again. We associate this EDA peaks to the same stimuli, therefore, we ‘combine’ the peaks to one, and smoothen them. Manual verification is a long process, requiring the researcher to verify all the peaks, one-by-one. We followed Dawson et al. (Citation2017) conditions of half recovery time of 2–10 s and gradual change of SCR 1–3 μS while manually eliminating peaks.
After manual verification of artefacts deletion and peak smoothening, the Invisible ink experiment had 26 peaks and Physics homework had 41 peaks. In the discussion section, we will compare these peaks with the two other analysis methods.
Peak analysis as analytical method
All EDA tools offer a way to conduct automated peak analysis. Some software, such as LabChart, do not share their algorithm, leaving the researcher with no option but to trust the software. Some software, use public algorithms (for example, Empatica E4) for researchers to use and adjust parameters as they see fit.
Peak analysis on its own affords two main analyses: (1) Comparing the same participant experiencing different activities, (2) Comparing various participants experiencing the same activity. For example, Avelar et al. (Citation2022) show in their Figure 3 (p. 8), how one child’s EDA levels vary among the three conditions of the study (reading e-book alone, reading e-book with their parent and reading traditional book with their parent). This comparison led the researchers to the conclusion that reading a book with parents elicit higher emotional expressions than reading a book alone. On the other hand, Lee et al. (Citation2019), aggregated data from various participants in different activities to determine what activity generated more emotional expressions.
In our research, since we only had one participant (unlike the studies above), we can only compare peaks (indicating emotional expressions) from one participant experiencing different activities. However, since EDA levels are affected by multiple uncontrollable variables (such as the emotional state of the participant at the moment), we claim that our small sample of five activities would be unreliable to make any inferences of this sort. Using peak analysis in order to compare one participant experiencing different activities requires a much larger data set, which constitutes one of the challenges of this method. The benefits will be discussed later, in comparison with the other methods.
Although possible, using peak analysis this way will only suggest emotional expressions but will not indicate what kind of emotions. To identify specific emotions researchers must conduct microanalysis of the activities (as also seen done by the studies mentioned above).
Microanalysis
In order to identify the emotions related to emotional expressions (peaks), we watched the video and described the expressed emotions that was observed at the same time (considering the 3–5 s delay time between stimulus and galvanic response). As demonstrated in , the psychophysiological data is displayed on one side of the screen, with the recorded video on the other side, running synchronized side by side. LabChart allows adding descriptions and coding on the EDA output diagram, as seen in . We have coded the data twice: (1) Coding only the peaks detected by the software, (2) Coding the entire activity regardless of the peaks. Description of those coded behaviours included what Irit was doing and saying, together with any gestures or facial expressions, such as ‘Looking at the page, smiling’ (Shaby and Vedder-Weiss Citation2020). This process was done by two researchers separately and then compared. The various descriptions needed to be mapped to a specific emotion (e.g. smiling is a positive emotions that can be enjoyment/happiness/pleasure), a process that was also done by two researchers (deciding on the types of emotions is out of the scope of this article, therefore, not discussed).
After coding all 26 peaks in the Invisible ink experiment, we identified the following emotions (, see Appendix for definitions of emotions).
Figure 3. Coded emotions Invisible ink experiment.
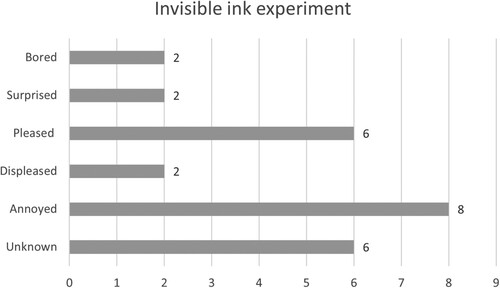
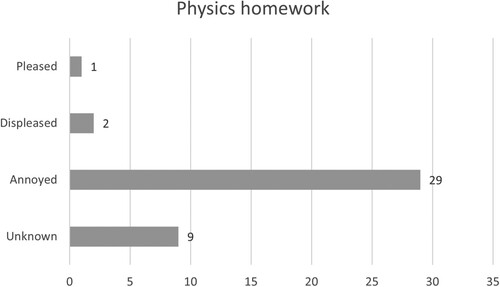
The 41 peaks in the Physics homework activity were also coded as seen in . In this activity, the range of emotions is not as varied as in the Invisible ink experiment.
Figure 4. Coded emotions Physics homework.
Microanalysis as analytical method
Microanalysis is a fairly common method to analyse human behaviour, usually coupled with multimodal analysis to capture all modes of communication (gestures, facial expression, posture etc., Shaby and Vedder-Weiss Citation2020). Limitations of microanalysis, apart from the fact that is time-consuming, derive from the fact that it uses humans (researchers) interpreting other humans (participants) observed behaviours. Claims questioning the reliability of this method mainly include social and cultural differences affecting the interpretations and the fact that it can only address observable behaviour. The use of EDA might eliminate some of those claims since people cannot control their sympathetic nervous system (Dawson et al. Citation2017), therefore, detected emotional expressions are less subjective (excluding technical issues). This is the benefit of using EDA as a method to detect emotions. However, determining the type of emotion detected by the sensors, still remains in the hands of the researcher. Within our dataset, we conducted microanalysis firstly on the peaks detected by the software. Doing so, we were able to detect most observable behaviours such as pleased and annoyed ( and ). However, in some instances, the EDA sensors indicated a response, but we could not identify any emotion in the participant behaviour, therefore, coded it as unknown. This coincides with literature about emotions indicating that over time people learn to control visible expression of emotions to adhere to social conventions (Bellocchi and Ritchie Citation2015). EDA can reveal those unexpressed (consciously or unconsciously) emotions to determine actual arousal state in relation to one’s experience, which is another benefit of this method.
Since one of the aims of this research is to function as a ‘proof-of-concept’ research, we coded the data again, this time not only coding the peaks, rather, coding the entire activity. Doing so revealed a number of situations where the researchers detected an observable behaviour that was not associated with a peak. For example, in the Physics homework activity, Irit seemed annoyed (observable by her speech, e.g. the words she was saying to Yael and the intonation of her voice), however, there was no arousal detected by the sensors. In the Invisible ink experiment, we found five such instances. For example, Irit was smiling, an action that usually elicit measurable changes in EDA, but in this case did not. Another notable example (from the Watching video activity) is worth mentioning since Irit said to Yoav: ‘This annoys me’, an utterance that would be coded as ‘annoyed’ in any discourse microanalysis method, however, there was no peak associated with this utterance. This phenomenon might reveal another social convention, reacting as expected, not necessarily as we feel. It is expected of a mother to smile at her children for positive feedback, and one’s values might prompt them to verbalize displease by a child actions. These everyday actions do not necessarily cause by emotional expressions and could only be detected by physiological measures.
A way to mitigate those differences is usually self-report questionnaires (Bradley and Lang Citation1994) or Experience Sampling Method (EMS) (Hektner et al. Citation2007), however, the limitations of those are also discussed in the literature. Self-report questionnaires and EMS can help assess the overall emotional state during the activity but will be hard to use for individual arousal moments. In our research, we have asked Irit to keep a reflective diary (to record her general emotional state). Her overall impression from the activity as positive (in the Invisible ink experiment) or negative (in the Physics homework), coincides with our microanalysis of the data. To overcome the analytical issue of unknown emotions we suggest conducting a reflective interview with participants (our analysis using this method is out of the scope of this paper, therefore, will not be discussed further). Another notable issue with coding observable behaviour might arise from the subjectivity of researchers, for example, a smile might be interpreted as pleased, enjoyed or happy.
Considering the merits of both methods it is rightly suggested that EDA and microanalysis of observable behaviour can use to complement each other (Avelar et al. Citation2022). By now we outlined the benefits and challenges of the analytical methods, suggesting EDA as a tool might be used in conjunction with (rather than a replacement of) observations and self-reports. However, both peak analysis and observations are time-consuming. This led us to peruse another method that might simplify the use of EDA data.
Structural breaks
A sequence of skin conductance values in μS as produced by hardware, can be seen as time series data. Researchers, then, often are interested in the way such a time series develops: when do values significantly increase or decrease? In a discipline like economics such time series data is often analysed with respect of the occurrence of so-called ‘structural breaks’. Structural breaks in time series denote abrupt changes at a point in time, something we hypothesize could happen when emotional expressions occur. Intuitively, a ‘structural break’ can be seen as a moment where there is a structural change (or a ‘shift’) in the time series; we want to explore if such breaks coincide with important moments of change in emotional expressions. A structural breaks approach, in its simplest form, divides a time series in a series of linear line segments, and uses algorithms in conjunction with time series regression models to determine multiple structural breaks (e.g. see Bai Citation1997 or Bai and Perron Citation1998). The number of structural breaks one might find, partially depends on the so-called ‘minimum segment size’, which is the minimum distance between a pair of possible ‘structural breaks’. This means that with a smaller value of this minimum value, you allow more structural breaks, while a large value allows fewer structural breaks. We used the R package ‘strucchange’ (Zeileis et al. Citation2002, Citation2003) within the Rstudio environment (RStudio Team Citation2021) in R version 4.1.1 (R Core Team Citation2021), which used the algorithm described in Bai and Perron (Citation2003) for simultaneous estimation of multiple breakpoints. As data input we only used the time series, one per second, of micro-Siemens (μS). We used the function breakpoints to calculate breakpoints in the time series. We used the default value of the minimal segment size (h = 0.15). The results of this analysis can be seen in the vertical dashed lines in and . Structural breaks only show the (significant) occurrence of a shift, e.g. the structural break. In order to understand why this shift occurred, we went back to the recorded activities to describe what happened in each segment between the structural changes. As we had already completed a detailed qualitative analysis of the activities, we could now compare the results of our structural breaks approach with our qualitative analysis.
Figure 5. Descriptions of specific actions in the structural breaks, Invisible ink experiment.
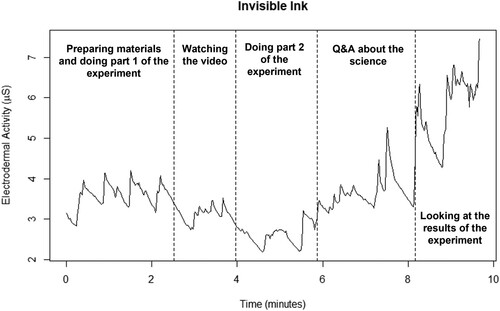
Figure 6. Descriptions of specific actions in the structural breaks, physics homework.
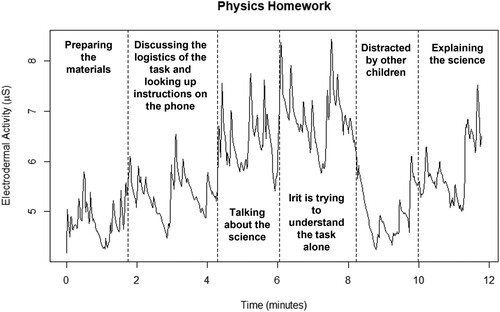
During the first stage of microanalysis, we created a detailed description of what happened in each activity. We created a flow chart to describe various elements in the sequence of the activity. For example, in the Invisible Ink experiment, during the first 02:30 min, the family prepared materials for the experiment while doing the first part of it. From 02:30 to 04:00 min, they were watching the video explaining the experiment on the phone, and so on. After creating the visual representation of the structural breaks, we compared it to those descriptions. As and illustrate, the various elements of the activity were consistent with the structural breaks.
Structural breaks as analytical method
Structural breaks offer a more holistic way to examine the findings, allowing to identify what specific elements in each activity elicit different emotional expressions (e.g. doing the experiment, looking at the video). Our results indicate that indeed such breaks coincide with important moments of change in emotional expressions (at least for the mother). Although the number of peaks in the ‘peak analysis’ was much greater than the number of breaks in the structural breaks approach, this could actually be seen as an advantage, as the breaks, depending on the value of the minimal segment size (default h = 0.15), are more manageable with regard to more substantial changes during the activities, as evidenced by the microanalysis. The choice of the minimal segment size can be seen as a variable that determines the sensitivity of the analysis; in certain cases, you might want more sensitivity (i.e. a smaller segment size, more peaks), in other cases less sensitivity (i.e. a larger segment size, fewer peaks). The benefit of this method is in its simplicity (and it is not very time-consuming), however, the results on their own do not offer much insights. A useful way to combine the approaches, using the strength of each, can be: (1) Using structural breaks on the entire data set and describing the elements of activities in each break (as in and ), (2) Choosing specific ‘breaks’ with emotional expressions that of interest depending on the specific research question and, (3) Performing microanalysis only on this part, considering all behavioural accounts and the automated peak analysis.
Contribution and conclusion
What is apparent from the three approaches for analysing our dataset, and the main take away of this article, is that the methods complement each other, each providing a piece of the complex puzzle of emotions. The hardware-provided peak analysis gives the quickest analysis for the particular hardware used. No data processing is necessary, as the data can readily be fed into the accompanying software. However, that also makes the analysis method closed and less transparent, since this particular software is intellectual property of the company, the codes are not openly available. The microanalysis provides the most detailed qualitative analysis but based on the enormous number of peaks for only a short segment, it is time-consuming and cumbersome. Structural breaks can use the raw data to quickly reduce the number of meaningful events in the activity but do not offer insights into what actually happened in the activities. Taken together, the methods combined are all relevant to understanding emotions and cannot be assumed to be interchangeable, in line with Mauss and Robinson’s (Citation2009) review. This ‘proof-of-concept’ study, then, has shown how researchers can benefit from triangulating three methods for analysing EDA to provide the most comprehensive picture of emotional expressions.
We found a few interesting findings that emerged that can be a venue of future research. First, emotions as social construct. The fact that by using EDA and microanalysis we can detect emotional expressions that are not a result of arousal and vice versa, arousal that is not expressed (Bellocchi and Ritchie Citation2015). Expanding research to focus on those moments can offer insights into social norms and cultural differences, especially within families and related to science practices. Second, using structural breaks with larger datasets can encourage researchers to collect large datasets that can offer useful insights into the relationship between emotions and learning. Collecting such large datasets might be intimidating if the researcher needs to rely on analysing it using solely peak analysis and microanalysis. This can especially be useful in informal settings such as science museum, where implications expand to exhibit design, pedagogy, and visitor experiences that can be collected in a large scale (Rappolt-Schlichtmann et al., Citation2017). Furthermore, as manual analyses sometimes can be very time-consuming, an approach with structural breaks could point researchers in the direction of noteworthy changes. Third, since these three methods are best combined, with the addition of self-report, future research is needed creating a research design to combine those to create a more coherent path to measure emotions in educational settings. It is still unclear what the ‘correct’ balance will be in utilizing these three methods. As a model, we can see the structural breaks approach being used for a quick ‘macro’ view of EDA data, perhaps augmented by proprietary software’s peak analyses. This can encompass the full range of the data but provide little detail. However, they can point in the directions where micro-analyses could shed further light on occurrences of emotional expressions. As computational methods also evolve, the future might bring further automated approaches for analysing rich, qualitative data. This also opens up possibilities of studying research questions in contexts that previously were hard to study.
Research on emotions in education mainly conducted in formal settings, with relatively few empirical reports examining EDA in association with engagement during scientific activities, specifically in informal settings (a few studies explore EDA in museums and Zoo). To our knowledge, there are no other studies exploring emotional expressions using EDA in the context of family science activities in the home (as opposed to laboratory experiments).
The presented analysis can capture unique emotional expressions, combining the psychophysiological measure and interpretation of video recordings. The work can contribute to research on emotional expressions related to learning, interest, and identity development. We argue that this combination of methods is promising yet still a work in progress. As family science learning becomes more essential in our life, this method may assist researchers to better understand the role of emotions in it and the implications to other areas.
This proof-of-concept study argued that an EDA approach has the potential to inform researchers about emotional expressions and help us understand what elements and moments in family science activities encourage those. While novel to research in informal science environments, the method has the potential for helping us to better identify emotional expressions in situ. The three methods we employed, complement each other and together provide a piece of the emotional puzzle.
Supplemental appendix
Download MS Word (15.8 KB)Disclosure statement
No potential conflict of interest was reported by the author(s).
Additional information
Funding
Notes
1 Other terms are used as well, for example Skin Conductance Response (SCR) or Galvanic Skin Response (GSR). In this article we will use EDA.
3 Note that this sampling rate influenced what data analysis methods would be available to us.
4 The software is not open to the public and protected as intellectual property. See https://www.adinstruments.com/products/peak-analysis.
References
- Avelar, D., et al., 2022. Children and parents’ physiological arousal and emotions during shared and independent e-book reading: a preliminary study. International journal of child-computer interaction, 33, 100507. https://doi.org/10.1016/j.ijcci.2022.100507.
- Bai, J., 1997. Estimating multiple breaks one at a time. Econometric theory, 13 (3), 315–352. https://doi.org/10.1017/S0266466600005831.
- Bai, J., and Perron, P., 1998. Estimating and testing linear models with multiple structural changes. Econometrica, 66 (1), 47–78. https://doi.org/10.2307/2998540.
- Bai, J., and Perron, P., 2003. Computation and analysis of multiple structural change models. Journal of applied econometrics, 18 (1), 1–22. https://doi.org/10.1002/jae.659.
- Bellocchi, A., C. Quigley, and K. Otrel-Cass, eds. 2016. Exploring emotions, aesthetics and wellbeing in science education research (Vol. 13). New York, NY: Springer.
- Bellocchi, A., and Ritchie, S.M., 2015. “I was proud of myself that I didn’t give up and I did it”: experiences of pride and triumph in learning science. Science education, 99 (4), 638–668. https://doi.org/10.1002/sce.21159.
- Berntson, G.G., and Cacioppo, J.T., 2000. From homeostasis to allodynamic regulation. In: J.T Cacioppo, L.G. Tassinary, and G.G. Berntson, eds. Handbook of psychophysiology. New York: Cambridge University Press, 459–481.
- Bradley, M.M., and Lang, P.J., 1994. Measuring emotion: the self-assessment Manikin and the semantic differential. Journal of behaviour therapy and experimental psychiatry, 25 (1), 49–59. https://doi.org/10.1016/0005-7916(94)90063-9.
- Brodien Hapairai, P.M., Walters, G., and Li, S., 2018. The effectiveness of ad-induced emotion in reducing tourist risk perceptions towards politically unstable destinations. Tourism recreation research, 43 (4), 483–496. https://doi.org/10.1080/02508281.2018.1470737.
- Cain, R. & Lee, V.R., 2016. Measuring electrodermal activity to capture engagement in an afterschool maker program. In Proceedings of the 6th annual conference on creativity and fabrication in education, 78–81. https://doi.org/10.1145/3003397.3003409
- Dawson, M.E., Schell, A.M., and Filion, D.L., 2017. The electrodermal system. In: J.T. Cacioppo, L.G. Tassinary, and G.G. Berntson, eds. Handbook of psychophysiology. Cambridge University Press, 217–243.
- Eisenhauer, S., 2019. Youths’ individual pathways towards contextual well-being: utilizing electrodermal activity as an ethnographic tool at a theatre after-school program. Ethos (Berkeley, Calif), 47 (2), 168–189. https://doi.org/10.1111/etho.12235.
- Falk, J.H., et al., 2018. The contribution of science-rich resources to public science interest. Journal of research in science teaching, 55 (3), 422–445. https://doi.org/10.1002/tea.21425.
- Hadinejad, A., et al., 2019. Emotional responses to tourism advertisements: the application of FaceReader™. Tourism recreation research, 44 (1), 131–135. https://doi.org/10.1080/02508281.2018.1505228.
- Hektner, J.M., Schmidt, J.A., and Csikszentmihalyi, M., 2007. Experience sampling method: measuring the quality of everyday life. Thousand Oaks, CA: Sage.
- Hetland, A., et al., 2018. Skiing and thinking about it: moment-to-moment and retrospective analysis of emotions in an extreme sport. Frontiers in psychology, 9 (971), 9–24. https://doi.org/10.3389/fpsyg.2018.00009.
- Horvers, A., et al., 2021. Detecting emotions through electrodermal activity in learning contexts: a systematic review. Sensors, 21 (23), 7869. https://doi.org/10.3390/s21237869.
- Hufnagel, E., and Kelly, G.J., 2018. Examining emotional expressions in discourse: methodological considerations. Cultural studies of science education, 13 (4), 905–924. https://doi.org/10.1007/s11422-017-9806-4.
- Immordino-Yang, M.H., and Damasio, A.R., 2007. We feel, therefore we learn: the relevance of affective and social neuroscience to education. Mind, brain, and education, 1, 3–10.
- Lee, V.R., Fischback, L., and Cain, R., 2019. A wearables-based approach to detect and identify momentary engagement in afterschool Makerspace programs. Contemporary educational psychology, 59, 101789. https://doi.org/10.1016/j.cedpsych.2019.101789.
- Li, S., et al., 2018. Using skin conductance and facial electromyography to measure emotional responses to tourism advertising. Current issues in tourism, 21 (15), 1761–1783. https://doi.org/10.1080/13683500.2016.1223023.
- Mano, H., 1996. Assessing emotional reactions to TV ads: A replication and extension with a brief adjective checklist. ACR North American advances, 23 (1), 63–69.
- Matsumoto, R.R., et al., 1990. Fundamentals of neuroscience, edited by J.T. Cacioppo and L.G. Tassinary, eds. Principles of psychophysiology: physical, social, and inferential elements. New York: Cambridge University Press, 58–112.
- Mauss, I.B., and Robinson, M.D., 2009. Measures of emotion: a review. Cognition and emotion, 23 (2), 209–237. https://doi.org/10.1080/02699930802204677.
- National Research Council, 2009. Learning science in informal environments: People, places, and pursuits. Washington, DC: National Academies Press.
- Noordewier, M.K., and Breugelmans, S.M., 2013. On the valence of surprise. Cognition and emotion, 27 (7), 1326–1334.
- Pekrun, R., 2006. The control-value theory of achievement emotions: assumptions, corollaries, and implications for educational research and practice. Educational psychology review, 18 (4), 315–341.
- Pekrun, R., 2014. Emotions and learning. Vol. 24. Geneva: International Academy of Education (IAE).
- Poels, K., and Dewitte, S., 2006. How to capture the heart? Reviewing 20 years of emotion measurement in advertising. Journal of advertising research, 46 (1), 18–37. https://doi.org/10.2501/S0021849906060041.
- Rappolt-Schlichtmann, G., et al., 2017. Core emotion and engagement in informal science learning. Exhibition, 36 (1), 42–51.
- R Core Team, 2021. R: a language and environment for statistical computing (Version 4.1.1) [Computer software]. R Foundation for Statistical Computing. Available from: https://www.R-project.org/
- Robinson, M.D., and Clore, G.L., 2002. Episodic and semantic knowledge in emotional self-report: evidence for two judgment processes. Journal of personality and social psychology, 83 (1), 198–215. https://doi.org/10.1037/0022-3514.83.1.198.
- RStudio Team, 2021. RStudio: integrated development for R (Version 1.4.1717) [Computer software]. RStudio, PBC. Available from: http://www.rstudio.com/
- Russell, J.A., and Mehrabian, A., 1977. Evidence for a three-factor theory of emotions. Journal of research in personality, 11 (3), 273–294. https://doi.org/10.1016/0092-6566(77)90037-X.
- Scherer, K.R., 2009. The dynamic architecture of emotion: evidence for the component process model. Cognition and emotion, 23 (7), 1307–1351. https://doi.org/10.1080/02699930902928969.
- Shaby, N., and Vedder-Weiss, D., 2020. Science identity trajectories throughout school visits to a science museum. Journal of research in science teaching, 57 (5), 733–764. https://doi.org/10.1002/tea.21608.
- Staus, N.L., and Falk, J.H., 2017. The role of emotion in informal science learning: testing an exploratory model. Mind, brain, and education, 11 (2), 45–53. https://doi.org/10.1111/mbe.12139.
- Taylor, S., et al., 2015. Automatic identification of artifacts in electrodermal activity data. In: Proceedings of the 2015 37th annual international conference of the IEEE engineering in medicine and biology society (EMBC). Milano, Italy: IEEE, 1934–1937.
- Thoits, P.A., 1989. The sociology of emotions. Annual review of sociology, 15, 317–342. https://doi.org/10.1146/annurev.so.15.080189.001533.
- Zeileis, A., et al., 2002. strucchange: an R package for testing for structural change in linear regression models. Journal of statistical software, 7 (2), 1–38. https://doi.org/10.18637/jss.v007.i02.
- Zeileis, A., et al., 2003. Testing and dating of structural changes in practice. Computational statistics & data analysis, 44 (1-2), 109–123. https://doi.org/10.1016/S0167-9473(03)00030-6.