
ABSTRACT
Student emotions influence assessment task behaviour and performance but are difficult to study empirically. The study combined qualitative data from focus group interviews with 22 students and 4 teachers, with quantitative real-time learning analytics (facial expression, mouse click and keyboard strokes) to examine student emotional engagement in an online Data Science assessment task. Three patterns of engagement emerged from the interview data, namely whizz, worker and worrier. Related emotions for these were discerned in the real-time learning analytics data, informing interpretations of associations between emotional and other forms of engagement. Instead of displacing human insights, learning analytics used alongside student self-report and teacher professional insights augment our understanding of student emotions in a naturalistic school assessment setting.
Introduction
Students’ emotions, particularly test anxiety, can significantly impact their performance in assessments (Camacho-Morales et al. Citation2021, Roos et al. Citation2020). Elements contributing to these emotional experiences include perceived importance of the assessment, fear of failure and the competitive school culture (Zeidner Citation2014). Students’ emotional states affect their cognitive processes, attention, memory, reasoning and information retrieval, subsequently influencing the quality of their responses in assessments (Pekrun Citation2006 Azevedo et al. Citation2016, Eteläpeltoa et al. Citation2018, Hasnine et al. Citation2021, Gladstone et al. Citation2022,).
Emotions are also related to motivation, self-efficacy, active engagement and self-regulation (Arguedas et al. Citation2016 Eteläpeltoa et al. Citation2018,). Interest and joy/happiness can be activating, promoting engagement, while boredom or fear can be deactivating, associated with loss of focus and disengagement (Pekrun Citation2006, Sinatra et al. Citation2015).
Emotions do not just happen to students. They emerge from conscious and/or unconscious judgements relating to perceived success. They thus have personal, social/cultural and contextual aspects (Schultz et al. Citation2016). The personal might concern a particular student's history of success and tendency to feel anxious. The social and cultural reflect the fact that assessments happen in an environment (school, family and peer) which might be perceived as more or less competitive or supportive, for example. Contextual aspects include specifics of the assessment that can affect emotions – the format of the task, whether it is high stakes or not, the subject area, etc. These are not isolated aspects but intersect and interact.
More research is needed to understand emotional engagement in authentic assessment tasks (Ritchie et al.Citation2016). Typically, teachers have access to students’ final submitted work, but not to the emotions they experience while completing the task. Understanding the latter is essential for educators to create a positive and equitable assessment environment for students (Pekrun and Schutz Citation2007), as well as informing pedagogical practices and offering tailored support to students, especially those whose emotional struggles negatively impact performance (Arguedas et al. Citation2016, Davies et al. Citation2018). Suggested strategies include stress-reduction techniques and additional resources for preparation (Pekrun Citation2006, Pekrun and Schutz Citation2007).
Studying students’ emotional engagement on assessment tasks presents a methodological challenge due to the multi-componential nature of emotions which cannot be fully captured using singular methods (Eteläpeltoa et al. Citation2018). We employed focus groups eliciting students’ accounts and teachers’ insights as professionals who knew those students well alongside granular real-time learning analytics to understand student engagement in an online assessment task. We asked, ‘How can learning analytics be used alongside qualitative data to help teachers better understand student emotional engagement in online assessment?’ Sub-questions were:
What did students say about their emotional engagement in the task?
What additional insights about emotional engagement in assessment did the learning analytics data reveal beyond what students reported?
How did teachers add to and make sense of these insights into students’ emotional engagement during assessment?
Literature review
Learning analytics
Learning analytics is defined as the ‘use of measurement, data collection, analysis and reporting to understand student learning and the learning environment through digital learning tools and technologies, intelligent data, and analytic models’ (Madinach and Abrams Citation2022, p. 196). It involves the collection and use of (usually large) datasets through software tools, machine learning or artificial intelligence (Madinach and Abrams 2022) to better understand and optimize learning (Ferguson Citation2012, Long and Freed Citation2021, Siemens Citation2013, Veerasamy et al. Citation2021).
Ye (Citation2022) reviews the development of learning analytics, from origins in educational data mining to a prominent empirical field. Sharing longstanding goals of using data to enhance insights into learning and improve practices, contemporary learning analytics offer something distinctive. Earlier approaches were based on extant data, such as results from standardized tests, and developed as online learning management systems became more widespread, enabling analysis of individual and aggregate page views, contributions, time online, etc. (Krumm et al. Citation2018). Contemporary learning analytics can combine machine learning or artificial intelligence with new sensor technologies, reflecting multidisciplinary developments in data science, educational technology and instructional design (Ye Citation2022). The granularity of available data has increased significantly, including through real-time capture of online and offline aspects simultaneously. Our study involved software which recorded students’ keystrokes and cursor movements, and cameras built into laptop devices that analysed facial expressions at 30 frames per second.
This study contributes to a branch of research that uses learning analytics to better understand student learning, uncovering aspects that were previously difficult to capture (Lodge et al. Citation2018). The study adopted an interpretivist approach, seeking to identify patterns in emotional engagement and to posit associations between those and other forms of engagement.
Emotional engagement and learning analytics
Student engagement refers to concrete and abstract working on a task (Krapp Citation2007). It is strongly linked to positive learning outcomes (Sinatra et al. Citation2015, Veerasamy et al. Citation2021, Wang et al. Citation2022). The dimensions of engagement most relevant to our study were (drawing on Christenson et al. Citation2012, Fredericks et al. Citation2004, Krapp Citation2007, Finn and Zimmer Citation2012, Sinatra et al. Citation2015, Vytasek et al. Citation2019):
Behavioural – active involvement in a task such as displaying effort, paying attention, persistence, concentrating, purposeful seeking of information
Emotional – affective reactions to tasks, subjects or schooling
Cognitive – referring to psychological investment and cognitive effort in the material or task
Domain-specific – behavioural, emotional, cognitive and agentic engagement specific to a discipline, task, subject or content area
Learning analytics in our study focused on facial expressions, a less commonly used process-oriented approach in real school settings (others being eye-tracking and monitoring electrodermal activity; Azevedo et al. Citation2016). This involves video data streams of learners’ facial expressions. Software objectively measures these through action units (AUs) that refer to facial motor muscles, and then uses algorithms to link them to emotions (Azevedo et al. Citation2016). For example, AUs 1, 2, 4 and 5, which correspond to brow raising, furrowing and eyelid tightening, indicate a prototypical expression of fear . Software enables automated valid coding in a non-intrusive, real-time fashion (Azevedo et al. Citation2016, Eteläpeltoa et al. Citation2018).
The basis for linking facial expressions to emotions lies in Ekman’s (Citation1992, see also Ekman and Friesen Citation1978) work on facial action coding. The emotions which can be reliably mapped in this way are commonly listed as joy (or happiness), anger, disgust, fear, sadness and neutral. Some software further differentiates, surprise frustration and confusion (Azevedo et al. Citation2016), although these demand detection of more subtle muscle movements, and are thus liable to increased errors.
However, Eteläpeltoa et al. (Citation2018) join Azevedo et al. (Citation2016) in expressing caution relating to the interpretation of results based on predefined emotions that have (supposed) universal facial movements as indicators because (i) emotions are multi-dimensional and exist on a spectrum that goes beyond the basic states Ekman identified; (ii) humans can regulate and consciously control the outward display of emotions; and (iii) there are cultural differences in the expression and understanding of emotions. We used qualitative data generated through student focus groups to guard against imposing a priori emotional categories and to prevent artificial delimitation of the range of emotions captured in the data.
Research design and methods
Eteläpeltoa et al. (Citation2018) argue that mixed methods approaches are helpful to match the complexity of emotions in education, noting the contextual, social and cultural dimensions discussed above. Both qualitative and quantitative methods were used in our study. A methodological contribution is offered through the combination of sensor-based learning analytics with qualitative focus groups involving students and teachers.
School and curriculum context
The study was conducted in collaboration with Pymble Ladies’ College (‘Pymble’), an independent K to 12 girls’ school in Sydney (Australia). Pymble was established in 1916 and has a Christian heritage. It has over 2300 students, including boarders from rural areas and overseas, and students on a range of scholarships, including First Nations students, girls with disability, and students from refugee backgrounds. Pymble has a large catchment, reflecting strong demand. It is not academically selective, but relatively high fees shape the student population. The school has an active research culture and has consented to be named in this paper.
In 2022, Pymble was the first school in Australia to offer an elective developed by the University of California, Los Angeles called ‘Introduction to Data Science’. Content includes machine learning, data visualization, inference and statistical analysis. Data were collected in the final term of this first year of delivery. Pymble teachers and students nominated this new subject as the focus for the study, anticipating that students might also be interested in learning analytics. The study was approved by [HREC details removed for anonymity] and discussed at Pymble's student-led ethics committee.
Sample
Year 9 and 10 students who had chosen to study Data Science (73 in total) were invited to participate, along with their Data Science teachers. Invitations were via email from a school administrator, avoiding possible pressure to opt in if requests came from teachers or managers. All 25 students who consented to participate were female. Four of the teachers involved in delivering the course also opted into the study (3 male, 1 female).
Task design
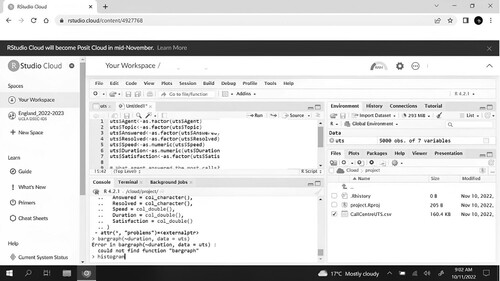
Participating teachers co-designed an assessment task to be completed individually on a laptop within one lesson. The task comprised four questions using R studio software relating to employee performance data in a call centre. Once students had followed instructions to run code, they were asked to:
Write a simple statistical question for each of the seven variables
Answer 2 of those questions
Describe how to use the provided codes to help a manager pick her best agent
Write and run additional code to gain more insight into identifying the best agent and compose an email to the manager with the findings.
Figure 1. Screenshot from the assessment task.
Learning analytics data collection
LEA (Learning Engagement Analytics), software developed by [Removed for anonymity], was installed onto participating students’ laptops and ran in the background as they completed the task. The software recorded all student keyboard and mouse usage and detected facial emotions via embedded laptop cameras. No images of students were recorded – visuals were converted in real time into numerical data. Students were aware that the software was running as they completed the task, and were reminded they could switch it off if they wished. None did so. Data were aligned with timestamps on system computers and no data was found to be lost.
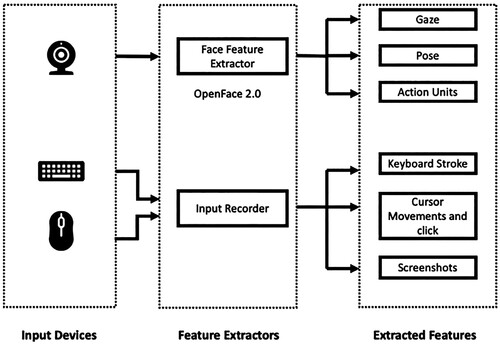
The LEA data collection process involved two main components: the Face Feature Extractor and the Input Recorder. illustrates the feature extraction pipeline used in LEA. To capture students’ facial emotions, the OpenFace 2.0 toolbox (Baltrušaitis et al. Citation2016) was used. It is an open-source Artificial Intelligence library, offering a range of features related to human subjects’ head, face, and eyes. It processes images captured by an embedded camera with a default resolution of 1080 pixels. OpenFace 2.0 has been shown to outperform other (more complex) methods in terms of facial landmark detection, head pose estimation, facial action unit recognition and eye-gaze estimation (Baltrušaitis et al. Citation2016). This accuracy, combined with real-time performance and ability to run through simple cameras embedded in common devices made OpenFace 2.0 a robust and practical basis for the study.
Figure 2. Feature extraction pipeline of LEA.
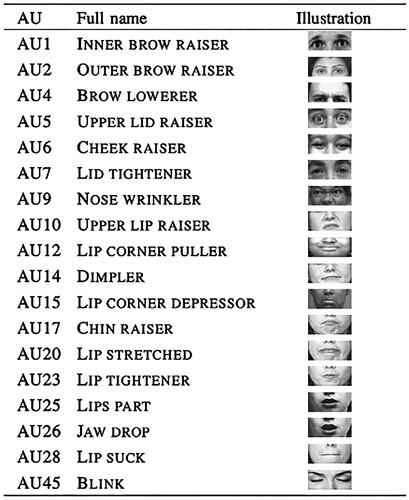
To identify facial expressions LEA utilized the Facial Action Coding System (FACS), which relates different combinations of codes to specific facial movements. The study gathered data on 18 different facial action units (AU), as shown in .
Figure 3. Facial action units.
Students’ emotions were inferred from combinations of collected action units using the Emotional Facial Action Coding System (EMFACS). Based on the action units collected by OpenFace, five emotions could be inferred: fear, happiness, sadness, anger and disgust, as well as neutral. These are those that can be most reliably identified based on the action units captured by the software; surprise, frustration and confusion were not coded as they are more prone to detection error. presents the relationship between the action unit combinations and the corresponding emotions.
Table 1. Emotions and linked action units.
Student focus groups
Qualitative data from students were important to avoid limitations of relying solely on automated emotion analysis. Informed by their student research ethics committee, Pymble preferred focus groups to 1:1 interviews, as these were more time efficient and expected to be less uncomfortable for students. Twenty-two students (all but 3 from whom learning analytics data were collected) consented to participate in focus groups. Six focus groups were conducted (2–4 students per group), either on the day of the task, or within the following couple of days. These lasted 20–45 minutes and were audio recorded; the total length of audio files was 3 hours 7 minutes. After discussing their interest in Data Science generally, an emotions sheet was provided as a stimulus, on which students marked how they felt at the start and end of each item, using emotional scales adapted from Kort et al. (Citation2001) of worried-confident, bored-interested and frustrated-happy. The purpose was not to quantify emotions, but to anchor the discussion closely to the task (Eteläpeltoa et al. Citation2018).
Teacher focus groups
The four teachers participated in two focus groups. These were audio recorded, lasting 52 and 68 minutes respectively. The first took place shortly after the task was completed, where preliminary patterns from the learning analytics data were presented. Teachers identified foci they wanted the researchers to follow up on emotions during idle periods of apparent inactivity (no keyboard strokes or cursor movements), and when students pressed backspace (to what they had written). The second focus group was conducted after this analysis had been done, and shifted the focus to validating and adding new layers of meaning to key findings. It asked teachers to relate them to what they knew about particular students and to the school's academic contextual, social and cultural aspects.
Data analysis
To answer sub-question 1, student focus groups were transcribed and coded in the software NVIVO. Coding was multi-layered. One layer used codes based on the three emotion scales adapted from Kort et al. (Citation2001) and used as stimuli in the focus groups (worried-confident, bored-interested and frustrated-happy). A second layer coded forms of engagement (emotional, cognitive, behavioural, domain-specific), informed by diverse sources (Fredericks et al. Citation2004, Krapp Citation2007, Finn and Zimmer Citation2012, Sinatra et al. Citation2015, Vytasek et al. Citation2019). Two open codes were created relating to challenges discussed by students, and strategies they used to complete the task; sub-codes were added to these in a grounded way. Coding layers were not exclusive (one comment could be coded under multiple layers).
Four researchers coded in two independent pairs. Inter-rater reliability was calculated for all 52 codes, ranging between 67% and 100% (mean 79.44%). Cohen's Kappa was calculated for each rating pair on every code, with the following results: no agreement (k<0.10) 8 codes; slight agreement (k = 0.10–0.20) 3 codes; fair agreement (k = 0.21–0.40) 10 codes; moderate agreement (k = 0.41–0.60) 7 codes; substantial agreement (k = 0.61–0.80) 5 codes; near perfect agreement (k = 0.81–0.99) 7 codes; perfect agreement (k = 1.00) 12 codes. Higher Kappa values were for codes based on existing literature (emotions, forms of engagement), which the grounded codes relating to challenges and strategies had lower Kappa values. The four coders met to discuss disagreements and reached consensus on all coding.
Once the coding was settled, the four coders discussed emerging patterns. These were not captured in any single coding layer, nor in quantifiable overlaps between them. They reflected an integrative and synoptic process, articulating a way of understanding associations between emotional and other forms of engagement. These patterns were labelled as whizz, worker and worrier. They emerged from the data and discussion, and did not have a specific prior theoretical referent.
These insights were combined with outcomes from the first teacher focus group to guide analysis of the learning analytics data for sub-question 2. LEA classified students’ emotions at 30 frames per second (consistent with similar software, see Azevedo et al. Citation2016). For each student, percentages of frames displaying non-neutral emotions were calculated. Following the analytical leads suggested by teachers in the first focus group, the analysis also identified the total time each student was idle or active, producing counts of the emotions registered when idle. Similarly, counts of emotions were produced for each student for all instances they pressed backspace.
The next step in addressing sub-question 2 involved producing a composite for each student (overall emotion distribution, emotions when idle and pressing backspace). These were then explored to see if they could be meaningfully linked to the particular the whizz, worker and worrier patterns of engagement.
Finally, for sub-question 3, qualitative data from the second teacher focus group were analysed thematically to enrich the categories of whizz, worker and worrier, linked to teachers’ knowledge of their students.
Findings
Answer to each sub-question will now be presented in turn.
Sub-question 1: what did students say about their emotional engagement in the task?
Students reported experiencing a range of emotions during the task. These varied in the kind of emotion (e.g. bored or interested), degree (closer to one end of the scale or closer to the middle), and in the change between start and end of an item (some remaining the same, some moving in one or the opposite direction). The quotes below exemplify how the stimulus helped students refer to specific moments in the task when talking about their emotions:
When I started, I was really confident because as soon as I wrote the statistical question the code just popped out of my mind, it's easy, I can do this. But then I realised I can't do it so easily, so I started to get worried. I got more interested by the end of it because I was like “How am I going to do this?” I was happy at first, I was oh this is so easy, I’m going to finish it so quickly then realisation hit, and I got really frustrated. (Year 10)
I was worried because I forgot how to make a statistical question but at the end, I was confident because I’d realised it wasn't as hard as I thought it was. I was frustrated I didn't know how to write it, but then I was happy because it wasn't that hard. (Year 9)
Table 2. Whizz, worker and worrier.
Sub-question 2: what additional insights about emotional engagement in assessment did the learning analytics data reveal beyond what students reported?
Learning analytics data were analysed to probe deeper into emotional engagement and idle/active time and pressing backspace as two behavioural indicators that participating teachers were particularly interested in.
LEA analysed emotions at 30 frames per second; because the time taken by students working on the task varied, the number of frames also varied (between 28,000 frames over 20 minutes and 67,000 frames over 37 minutes). Across all participants, neutral emotions were registered most of the time, typically in the range from 76% to 90% of all frames. Given the importance of emotions in assessment relates to heightened affective states, the analysis focused on non-neutral emotions.
presents the percent of frames analysed as non-neutral across the whole task for three exemplar students: a whizz, worker and worrier. Fear did not occur. shows the percentage of frames analysed as non-neutral emotions when these same three students were pressing backspace. shows the same for when these students were idle (not moving the mouse or pressing any key). Note, 1% of frames were coded as Anger for the worker, and 1% as Disgust for the worrier, while idle. The three students for whom data are presented in were selected based on the qualitative data indicating a strong association with their respective pattern of engagement (whizz, worker, worrier).
Figure 4. Percentage of frames coded as non-neutral emotions across the task for whizz, worker and worrier.
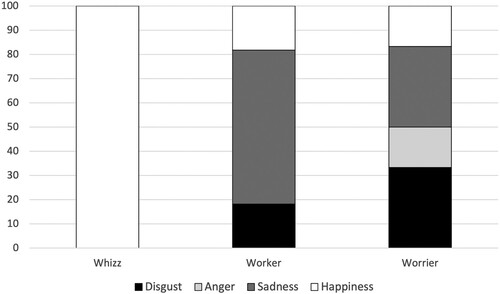
Figure 5. Percent of frames coded as non-neutral emotions when pressing backspace for whizz, worker and worrier.
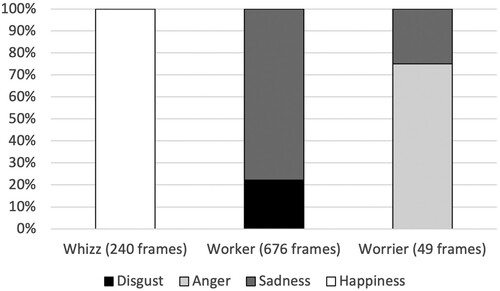
Whizzes displayed the most happiness, although some students who enjoyed deep engagement in coding found more procedural questions less rewarding. shows happiness associated with pressing backspace for one whizz. She and other whizz students explained in the focus groups that this was not a moment of panic, but part of the process, and often linked to the joy of finding a better way of doing. Whizzes were typically idle 35–50% of frames, more than workers, but similar to worriers. shows happiness often co-occurred with idle time. In the focus groups, they commented how this was enjoyable, time to ponder and dig down deeply into questions, searching for (more) elegant solutions.
Figure 6. Percent of frames coded as non-neutral when idle for whizz, worker and worrier.
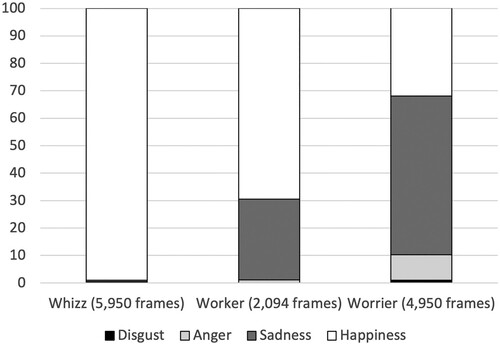
Emotional engagement for workers was very different, as exemplified in . The range of emotions was much greater, in line with what students said in focus groups about finding some questions interesting, others boring, some easy, others hard, worrying at times and feeling confident at others (). Workers pressed backspace more than others, which coheres with focus group comments about using trial and error. Their non-neutral emotions when pressing backspace were typically negative (sadness or disgust; ). This was analytically linked to focus group data concerning frustration with themselves for wasting time, and worry that their answers were incorrect. Overall, workers were the least idle (20–40% of frames). Idle time for workers was associated with a range of emotions (). Workers wanted to find the right answer quickly and move on. They described feeling happy when they got closer to the answer, angry with themselves when they couldn't figure out what to do, and upset, especially when questions required more creative or inventive (rather than familiar and routine) work, or when their answers were not correct.
The worriers exhibited more anger, disgust and sadness overall (exemplified in ). They talked about being frustrated with themselves that they could not remember, meaning they were failing the task. Pressing backspace was associated with anger and sadness (e.g. ). Worriers were idle more than others (45–75% of frames), and this idle time was emotionally difficult for them, associated with disgust and sadness (). In focus groups, worriers discussed feeling cross or upset with themselves for not remembering what to do. They also discussed feeling anxious as time was running out. Some froze (see ), while others discussed trying almost anything.
Sub-question 3: how did teachers add to and make sense of these insights into students’ emotional engagement during assessment?
In the second teacher focus group, visual summaries were presented for several individuals analysed as whizz, worker or worrier. Teachers were asked to comment as to whether this characterization of engagement in the task matched what they knew of the student more broadly. Without hesitation, teachers confirmed all except two, with comments such as:
Yes she's a whizz. She’ll dig, do more, tweak the code, keep going. Similarly [name] will dig, dig, keep investigating.
She was my student, an achiever. She's got a strategy, but she's not here for the beauty of the coding, so yes, a worker. Everything is high stakes for her … and [name] worker rather than whizz because she was more concerned about getting it right than mastering.
Oh yes [name] is a worrier. She worries not to remember. She's worried she's not getting the right answer. It's hard to get her to change her mindset, she's used to blaming herself and her failing memory.
Teachers discussed what might lie beneath the patterns of engagement in terms of locus of control. They suggested whizzes might have general assurance as to their capability, pressing backspace when they knew the way forward. They contrasted this with worriers who blaming their own perceived incompetence: ‘I don't know the way forward, I’m blocked, so what I’m faced with is a block rather than opportunity’. For the worrier, the backspace is a deficit moment where control is lost, while for the whizz it is a positive future-oriented one that is borne of control. For the worker, it could be both – realizing something isn't working, but also trusting in themselves to figure something out, hence the varying emotion displayed by workers when pressing backspace.
The teachers commented that a particular student might engage in different ways depending on the context, particularly the degree of preparation for assessment tasks. They identified how one student who engaged as a worker in the assessment task would engage much more as a whizz if she felt fully prepared for a task.
Returning to the two students for whom the suggested pattern was not immediately confirmed, teachers also discussed how students who engaged as worriers in tests and assessments (or in preparation for them) might be workers or whizzes in everyday class work: ‘In class, she's collaborating, working well, making progress, happy … today it was stressful for her because it's getting ready for the test’. They also thought this would vary between subjects: they knew students who might engage as a whizz in Data Science, but be much more of a worrier in History, for example. Thus, teachers made sense of the forms of engagement as context-specific and dynamic, and could see they reflected complex aspects of students as learners.
Coda
At Pymble's request, researchers presented key findings back to students who had taken the Data Science elective. Students who had participated in the focus groups were provided with a version of , and a summary of their learning analytics data (but not whether whizz, worker or worrier applied to them – following advice from Pymble, this was left for them to reflect on rather than being presented as a judgement by researchers). They were asked by show of hands if they identified with one of the three patterns of engagement and all indicated that they did. When asked if they thought they would have the same pattern of engagement in other subjects, the majority indicated no.
Discussion
Our aim was to better understand students’ engagement in a new Data Science assessment task. The mixed methods approach positioned technology in concert with students’ and teachers’ insights, rather than replacing or displacing them (Lodge et al. Citation2018).
How we understand engagement depends on the ‘size of grain’ that we look at (Sinatra et al. Citation2015). Taking a fine-grained approach, in student focus groups we explored changing emotions as students worked on each assessment item in turn – the personally enacted aspect of emotions reflecting individual appraisals in particular contexts (Schutz et al. Citation2016). The whizz, worker and worrier () emerged as patterns in how students talked about their own engagement. As fluid syntheses that point to associations between emotional, behavioural, cognitive and domain-specific engagement in particular contexts, they reflect the multi-dimensional and situated complexity of emotions and engagement in education (Schutz et al. Citation2016). This is a different approach from studies that use learning analytics to categorize students into pre-defined learning styles (eg. Luo Citation2021).
The learning analytics offered opportunities to reduce the ‘grain size’ (Sinatra et al. Citation2015) further, pursuing teachers’ curiosity about emotions when students pressed backspace, and when they were ‘idle’. The emotions the software could detect through facial expression did not map directly onto those discussed by students themselves. Nonetheless, overall emotion patterns for whizz, worker and worrier could be discerned in the learning analytics data, which were later validated by both teachers and (in a more general way) students.
Significant additional layers of insight emerged, linking emotion with student attention (Azevedo et al. Citation2016). While being idle may appear to be behavioural disengagement, this was in fact associated with very different forms of affective, cognitive and behavioural engagement. The whizz might enjoy taking time to ponder elegant answers, the worker might experience varied emotions as they use trial and error or struggle with more creative or unusual questions, and the worrier might freeze, frustrated with not being able to recall what to do. Similarly, undoing work might involve the same behaviour (backspace), but learning analytics revealed different emotions, which focus groups linked to cognitive and behavioural engagement, ranging from the reward of realizing a better way of doing something (whizz), diagnosing an error and fixing it (worker), and trying something different while hoping for the best or having finally remembered what to do (worrier).
These findings can be theorized in terms of activating and deactivating emotional reactions (Pekrun Citation2006). For the whizz, the activating reactions pull them further and deeper into the task; deactivating reactions arise for the worrier, where loss of focus and disengagement ensue. The worker may experience elements of both.
It is important to understand personal, social/cultural and contextual aspects of emotional engagement (Schutz et al. Citation2016). Teachers’ added relevant insights into students and school culture. They identified some students as particularly attentive to peers’ performance, reflecting the way perceptions of a competitive school environment can shape emotions (Zeidner Citation2014). They also discussed how some students could regard all assessments as personally high stakes, often feeling they did not meet their own very high expectations of performance. Such perceptions can contribute to anxiety (Camacho-Morales et al. Citation2021, Roos et al. Citation2020, Zeidner Citation2014). Teachers also remarked on contextual aspects, noting students who were characteristically more confident in some subject areas than others.
Thus the learning analytics do not capture the whizz, worker and worrier as fixed properties of individuals, but rather as manifestations of personal appraisals that reflect the task itself, its context, and how students perceive and experience wider school culture.
Limitations
There may be selection bias resulting from the convenience sample and further information about students who did not give consent is not available. However, teachers commented that the sample of 25 comprised a range of students in terms of academic achievement and general classroom behaviour. The diverse patterns of engagement found suggest that any selection bias did not strongly favour those who were most confident or interested in Data Science, or in schooling in general.
While variations within each pattern were detected, exploring these in detail is beyond the scope of this analysis. The pattern of engagement associated with this task may be different for the same student in other contexts, and multiple case study designs could track the same students across different contexts. This would aid a better understanding of variation within each pattern as well as potential movement between them.
The findings are not empirically generalisable, given their basis in a small convenience sample. Larger studies could address this while also linking whizz, worker and worrier with assessment performance.
There is some risk of confirmation bias because teachers and researchers sought to explain the learning analytics findings using the three key patterns. It is indeed possible that alternative patterns might be posited. The detailed and immediate way in which teachers could link the patterns with their knowledge of students suggests their validity: they hold up to teachers’ lived experience of working with those individuals.
The sliding scales presented to students in focus groups involved different emotions from those that could be detected by the software. While this created some complexity, this was arguably a strength of the study. The classification used in LEA and similar software must be treated with caution as its reliance of facial manifestation limits the range of emotions that can be reliably detected, and software assumes universalism where in reality culture and context matter greatly. Therefore, the use of alternatives as stimuli in the focus groups, in which students also expressed other emotions, was an important means to counter this limitation.
Furthermore, the three pairs informed by Kort et al. (Citation2001) offered a vocabulary that we expected (including through discussion with Pymble) would be more inclusive, comfortable and natural for students to discuss than the language of disgust, anger (etc.) that is limited by the basic emotions detectable by software.
Conclusions
This study introduced a novel real-time learning analytics system in concert with qualitative data from students and teachers to produce new insights into students’ emotional engagement during an assessment task. It furthers research seeking to take learning analytics from the lab to the classroom (Jarodzka et al. Citation2021) in the new and under-studied curriculum area of Data Science.
Whizz, worker and worrier are not replacements for established ways of differentiating forms of engagement or learning styles. Their value lies in their synthetic yet fluid quality, connecting different aspects in a situated way which enabled the teachers to add layers of insight to the learning analytics data. Facial expression analytics are limited in the emotional range they reliably identify (Azevedo et al. Citation2016), and do not account for complex social and contextual aspects of emotional engagement. Rather than starting from algorithmic patterns which can often seem inexplicable (Bartimote et al. Citation2019), this study took insights from qualitative data and sought to confirm and enrich them through learning analytics. This provided a learner-grounded lens through which to interpret quantitative automated analyses, oriented towards issues of particular interest and importance to teachers (idleness and pressing backspace).
The ideas of whizz, worker and worrier resonated authentically with teachers’ knowledge of students’ approaches to their peers, assessment tasks and different subject areas. Thus, the complex nature of emotional engagement was addressed, elucidating associations with behavioural, cognitive and domain-specific engagement. Learning analytics alone could not have achieved this: the sequence from student stimulated recall to learning analytics to teacher social and cultural insights was crucial. Teachers’ professional expertise was not displaced by the technology (Lodge et al. Citation2018), but found new ways to be put to work. The three sources of data elucidated overlapping but different aspects of students’ engagement in the assessment task (Sinatra et al. Citation2015 Schutz et al. Citation2016,).
Insights into student emotions during assessment have been discussed as informing teachers’ actions based on offering additional support to reduce anxiety (Pekrun and Schutz Citation2007). As ways of understanding emotional engagement in assessment, whizz, worker and worrier offer a different basis for acting. The worker and worrier might feel anxious (at times), but the reasons for this and the resulting task behaviours are very different. Teachers commented that the multifaceted ideas associated with whizz, worker and worrier provided a richer basis to reflect on support for students than simply considering those who were more or less anxious. This would be a valuable line for further research to pursue.
Reflecting on practical applications of software such as LEA, we are mindful of maintaining a focus on the value that arises from bringing learning analytics into connection with professional expertise and student lived experience. Thus, we anticipate uses in alerting teachers to combinations of triggers such as sustained idleness and negative emotion when students complete assessments online – information that teachers could conjoin with their contextual and cultural knowledge to inform judgements as to whether and how to intervene.
As learning analytics become more widely used and sophisticated, it is important to close the gap between the laboratory and the classroom (Krumm et al. Citation2018). This study showed how combining technological affordances of real-time facial expression analysis with qualitative student and teacher insights can provide rich understandings of emotional engagement in assessment tasks, pointing to meaningful patterns that connect emotions with cognitive, behavioural and domain-specific engagement.
Acknowledgements
The authors wish to thank the students of Pymble's Ethics Committee, and those who took part in the study. We acknowledge the contributions of Pymble teachers Cedric le Bescont, Anthony England, Kim Maksimovic and Glen McCarthy, as well Pymble's Research Assisstant Victoria Adamovich. All those mentioned here have given consent to be named in this way.
Disclosure statement
No potential conflict of interest was reported by the author(s).
Additional information
Funding
References
- Arguedas, M., Daradoumis, T., and Xhafa, F., 2016. Analyzing how emotion awareness influences students’ motivation, engagement, self-regulation and learning outcome. Educational technology & society, 19 (2), 87–103.
- Azevedo, R., et al., 2016. Interdisciplinary research methods used to investigate emotions with advanced learning technologies. In: M. Zembylas and Paul A. Schutz, eds. Methodological advances in research on emotion and education. Dordrecht: Springer, 231–243.
- Baltrušaitis, T., Robinson, P., and Morency, L.-P., 2016. Openface. An open source facial behavior analysis toolkit. In: WACV, ed. 2016 IEEE winter conference on applications of computer vision. Lake Placid: IEEE, 1–10.
- Bartimote, K., Pardo, A., and Reiman, P., 2019. The perspective realism brings to learning analytics in the classroom. In: Jason Lodge, Jared Horvath, and Linda Corrin, eds. Learning analytics in the classroom: translating learning analytics research for teachers. London: Routledge, 22–41.
- Camacho-Morales, J., et al., 2021. Activity achievement emotions and academic performance: A meta-analysis. Educational psychology review, 33, 1051–1095. doi:10.1007/s10648-020-09585-3.
- Christenson, S.L., Reschly, A.L., and Wylie, C., eds. 2012. Handbook of research on student engagement. Cham: Springer.
- Davies, L., Newton, D., and Newton, L., 2018. Teachers’ pedagogies and strategies of engagement. International journal for talent development and creativity, 6 (1), 169–180.
- Ekman, P., 1992. An argument for basic emotions. Cognition and emotion, 6 (3-4), 169–200. doi:10.1080/02699939208411068.
- Ekman, P., and Friesen, W.V., 1978. Manual for the facial action code. Palo Alto, CA: Consulting Pyschologists Press Inc.
- Eteläpeltoa, A., et al., 2018. A multi-componential methodology for exploring emotions in learning: using self-reports, behaviour registration, and physiological indicators as complementary data. Frontline learning research, 6 (3), 6–36. https://www.lib.uts.edu.au/goto?url=https://search.ebscohost.com/login.aspx?direct=true&db=eric&AN=EJ1199455&site=ehost-live
- Ferguson, R., 2012. Learning analytics: drivers, developments and challenges. International journal of technology enhanced learning, 4 (5-6), 304–317. doi:10.1504/IJTEL.2012.051816.
- Finn, J.D., and Zimmer, K.S., 2012. Student engagement: what is it? why does it matter? In: Sandra L Christensen, Amy L Reschly, and Cathy Wylie, eds. Handbook of research on student engagement. Boston, MA: Springer US, 97–131.
- Fredericks, J.A., Blumenfeld, P.C., and Paris, A.H., 2004. School engagement: potential of the concept, state of the evidence. Review of educational research, 74 (1), 59–109. doi:10.3102/00346543074001059.
- Gladstone, J.R., Wigfield, A., and Eccles, J.S., 2022. Situated expectancy-value theory, dimensions of engagement, and academic outcomes. In: A.M. Reschly and S.L. Christenson, eds. Handbook of research on student engagement. Dordrecht: Springer, 57–76.
- Hasnine, M.N., et al., 2021. Students’ emotion extraction and visualization for engagement detection in online learning. Procedia computer science 192: 3423–3431. doi:10.1016/j.procs.2021.09.115.
- Jarodzka, H., Skuballa, I., and Gruber, H., 2021. Eye-tracking in educational practice: investigating visual perception underlying teaching and learning in the classroom. Educational psychology review, 33, 1–10. doi:10.1007/s10648-020-09565-7.
- Klein, P., et al., 2021. Test of understanding graphs in kinematics: item objectives confirmed by clustering eye movement transitions. Physical review physics education research, 17 (1): 013102. doi:10.1103/PhysRevPhysEducRes.17.013102.
- Kort, B., Reilly, R., and Picard, R.W. 2001. An affective model of interplay between emotions and learning: reengineering educational pedagogy-building a learning companion. IEEE International Conference on Systems, Man, and Cybernetics (SMC), Melbourne, 17–20 October.
- Krapp, A., 2007. An educational–psychological conceptualisation of interest. International journal for educational and vocational guidance, 7 (1), 5–21. doi:10.1007/s10775-007-9113-9.
- Krumm, A., Means, B., and Bienkowski, M., 2018. Learning analytics goes to school: a collaborative approach to improving education. New York: Routledge.
- Lodge, J.M., Cooney Horvath, J., and Corrin, L., 2018. Learning analytics in the classroom: translating learning analytics research for teachers. Boca Raton, FL: Routledge.
- Long, D.L., and Freed, E.M., 2021. An individual differences examination of the relation between Reading processes and comprehension. Scientific studies of Reading, 25 (2), 104–122. doi:10.1080/10888438.2020.1748633.
- Luo, Z., 2021. Using eye-tracking technology to identify learning styles: behaviour patterns and identification accuracy. Education and information technologies, 26, 4457–4485. doi:10.1007/s10639-021-10468-5.
- Mandinach, E.B., and L.M. Abrams. 2022. Data literacy and learning analytics. In: The handbook of learning analytics, 196–204.
- Pekrun, R., 2006. The control-value theory of achievement emotions: assumptions, corollaries, and implications for educational research and practice. Educational psychology review, 18 (4), 315–341. doi:10.1007/s10648-006-9029-9.
- Pekrun, R., and Schutz, P.A., 2007. Where do we go from here? implications and future directions for inquiry on emotions in education. In: Paul A Schutz, and Reinhard Pekrun, eds. Emotion in education. Amsterdam: Elsevier Academic Press, 313–331.
- Ritchie, S.M., et al., 2016. Evolution of self-reporting methods for identifying discrete emotions in science classrooms. Cultural studies of science education, 11 (3), 577–593. doi:10.1007/s11422-014-9607-y.
- Roos, A.-L., et al., 2020. Test anxiety and phsyciological arousal: A systematic review and meta-analysis. Educational psychology review, 33, 579–618.
- Schutz, P.A., DeCuir-Gunby, J.T., and Williams-Johnson, M.R., 2016. Using multiple and mixed methods to investigate emotions in educational contexts. In: M. Zembylas and P.A. Schutz, eds. Methodological advances in research on emotion and education. Dordrecht: Springer, 217–229.
- Siemens, G., 2013. Learning analytics: The emergence of a discipline. The American behavioral scientist (Beverly Hills), 57 (10), 1380–1400. doi:10.1177/0002764213498851.
- Sinatra, G.M., Heddy, B.C., and Lombardi, D., 2015. The challenges of defining and measuring student engagement in science. Educational psychologist, 50 (1), 1–13. doi:10.1080/00461520.2014.1002924.
- Tóthová, M., Rusek, M., and Chytrý, V., 2021. Students’ procedure when solving problem tasks based on the periodic table: An eye-tracking study. Journal of chemical education, 98 (6), 1831–1840. doi:10.1021/acs.jchemed.1c00167.
- Veerasamy, A.K., Laakso, M.-J., and D’Souza, D., 2021. Formative assessment tasks as indicators of student engagement for predicting at-risk students in programming courses. Informatics in education, 21 (2), 375–393. doi:10.15388/infedu.2022.15.
- Vytasek, J.M., Patzak, A., and Philip Winne, H., 2019. Analytics for student engagement. In: M. Virvou, E. Alepis, G. Tsihrintzis, and L.C. Jain, eds. Machine learning paradigms. Dordrecht: Springer, 23–48.
- Wang, C., et al., 2022. How learner engagement impacts non-formal online learning outcomes through value co-creation: an empirical analysis. International journal of educational technology in higher education, 19 (1), 32–32. doi:10.1186/s41239-022-00341-x.
- Ye, D., 2022. The history and development of learning analytics in learning, design, and technology field. Techtrends, 66 (4), 607–615. doi:10.1007/s11528-022-00720-1.
- Yun, E., 2021. Comparing the Reading behaviours of students with high- and low-level comprehension of scientific terms by eye movement analysis. Research in science education, 51 (4), 939–956. doi:10.1007/s11165-020-09935-9.
- Zeidner, M., 2014. Anxiety in education. In: Reinhard Pekrun, and Lisa Linnenbrink-Garcia, eds. In international handbook of emotions in education. London: Routledge, 265–288.