
 ?Mathematical formulae have been encoded as MathML and are displayed in this HTML version using MathJax in order to improve their display. Uncheck the box to turn MathJax off. This feature requires Javascript. Click on a formula to zoom.
ABSTRACT
Visitor crowding issues caused by over-tourism at World Heritage Sites (WHS) are increasingly prominent. However, related studies and management give less consideration to the uneven tourist spatial-temporal distribution within micro-attractions, ignoring the detrimental impacts of local crowding on WHS’ sustainable development. Aimed at exploring local crowding within heritage attractions from a perspective of time-space, this study used video-based computer vision technology to analyze tourist spatial-temporal distribution, density, and carrying capacity at stationary points (spatial locations where visitors stay and gather), taking a case study of the Master-of-Nets Garden, a World Cultural Heritage Site. The results indicated that although the total visitor number was below the attraction’s carrying capacity, visitors repeatedly and quickly crowded at stationary points and formed high-density clusters, exceeding stationary points’ space capacity and causing spatial local crowding. When visitors’ dwell time was 5, 12, and 20 seconds, the crowding index K of stationary points was 3.4∼108.5, 1.7∼42.9, and 0.5∼33, indicating the spatial local crowding effect was negatively correlated with the length of visitors’ dwell time at stationary points. Our contribution provides an accurate understanding of local crowding in WHS by highlighting the impact of tourist spatial-temporal distribution on carrying capacity and spatial crowding and suggests visitor management recommendations.
Introduction
With the rapid expansion of tourism demand and the growing popularity of holiday travel, over-tourism has many negative impacts on destinations, including crowding (Dodds & Butler, Citation2019; European Parliament, Citation2018). Crowding issues in tourist destinations have been a hot topic of research interest for more than 40 years (Vaske & Shelby, Citation2008). Due to the increase in the number of visitors and the limited capacity of tourism facilities, visitor crowding occurs when the number of visitors exceeds the carrying capacity of tourism destinations (Mehta, Citation2013). The large, dense, and concentrated influx of visitors to popular tourist attractions leads to a significantly higher risk of tourist safety accidents, such as the Itaewon stampede accident in 2022, which attracted widespread public and social media attention.
Many high-profile World Heritage Sites (WHS) are often popular and major tourism destinations, attracting a large number of visitors (Riganti & Nijkamp, Citation2008). Especially in China, most travelers are constrained by the availability of public holidays and need to travel during holidays (Liu & Ma, Citation2019). According to the China Tourism Research Institute (Citation2022), more than 420 million people traveled during the National Day holiday in 2022. Among them, the number of visitors to WHS increased by 0.8% year-on-year, recovering to 97.1% of Covid-19 pre-pandemic. Without effective management to reduce crowding issues, this would lead to a poor visitor experience and degradation of World Heritage values (Cros, Citation2008; Li et al., Citation2020). However, current studies and practical strategies for managing visitor crowding in WHS (such as limiting access, dispersing visitors, and smart tourism) have targeted entire large tourism destinations, such as historical cities, protectorate areas, archeological sites, national parks, etc. (Cavalheiro et al., Citation2020; Enseñat-Soberanis et al., Citation2019; Jovicic, Citation2019; Nevola et al., Citation2022). Local crowding based on uneven tourist distribution within micro-attractions has received little scholarly attention, despite being an important consideration in the carrying capacity of WHS (Zehrer & Raich, Citation2016).
It is important to understand the local crowding of intra-attractions to achieve management objectives. If all visitors were concentrated at a few locations within an attraction, their perception of crowding would be very different than if the same number of people were spread evenly over a variety of locations (McManus, Citation1988). Many empirical studies have shown that people are not evenly distributed in an attraction but converge on some spatial locations (East et al., Citation2017; Ferrari et al., Citation2014; Sugimoto, Citation2013). The names of these spatial locations, which have a specific appeal to visitors in their movements, have not yet been unified, such as hot spots for tourists gathering, areas with long average dwell time, and tourist interest areas (Yao et al., Citation2021). This paper defines the spatial location as a ‘stationary point.’ It refers to the specific location within an attraction where necessary static tourist activities (e.g. photographing, viewing, resting, etc.) temporarily interrupt tourist dynamic movement during the tour. The dwell time and spatial distribution of visitors at stationary points accurately reflect visiting preferences of visitors (Gutwill & Allen, Citation2010). Extending visiting dwell time at stationary points and slowing tourist movement can enhance the overall tourist experience (Davey et al., Citation2005). Local crowding occurs when the number of people at a stationary point exceeds the expectations of visitors and restricts them from achieving their goals (McManus, Citation1998). Local crowding at stationary points has a significant effect on tourist enjoyment and their perception of carrying capacity within attractions (McCool & Lime, Citation2001). Russo (Citation2002) highlighted the importance of managing local crowding at stationary points, and noted that understanding the variation of visitors’ temporal activities and spatial movements is essential to managing crowds at those locations.
Space is a primary factor and place of crowding, closely related to carrying capacity and visitor density (Neuts & Nijkamp, Citation2012). Based on spatial crowding, the introduction of the ‘time’ element can focus on the time change of local crowding, thus providing a possibility for further analysis of the spatial-temporal characteristics of local crowding. In addition, video-based computer vision technology provides us with an effective method to identify tourist behavior on a micro-scale (to the meter on a spatial scale) and to calculate the number and density of visitors at stationary points on a time scale (to the second on a time scale) (Liang et al., Citation2020).
The purpose of the paper is to investigate local crowding of a micro intra-attraction, the Master-of-Nets Garden (a World Cultural Heritage Site), based on the spatial-temporal distribution of visitors at stationary points, using a new method that combines video-based computer vision technology with GIS measurement. The aim of this study is fourfold:
To record the number of visitors at stationary points with different dwell times through video-based computer vision technology and visualize tourist spatial-temporal distribution by GIS.
To calculate the carrying capacity of the Master-of-Nets Garden and stationary points, respectively, and compare them with the actual visitor volume to analyze the influence of tourist spatial-temporal distribution on carrying capacity and local crowding.
To calculate the local spatial crowding index of stationary points to analyze the spatial and temporal characteristics of local spatial crowding in the study area.
To discuss spatial choice behavior, path choice behavior, and spatial preference characteristics of visitors in spatial local crowding situations through the data of video playback and tourist spatial-temporal distribution.
The findings of this paper offer new insight into the impact of tourist spatial-temporal distribution on carrying capacity and crowding. The contribution highlights the relationship between local crowding and the dwell time of visitors staying at stationary points in heritage attractions. The stationary point methodology helps to better understand the drivers of local crowding and emphasizes the necessity to manage visitors at stationary points.
Literature review
Crowding
With the rapid development of the global economy after the 1960s, the contradiction between the growing tourism demand and the scarcity of tourism resources has become increasingly prominent, and the overcrowding of scenic spots has been a common phenomenon (Schmidt & Keating, Citation1979). Stokols (Citation1972) first defined crowding as the negative evaluation of an individual’s unmet need for space. Later, Gramann (Citation1982) suggested that when the crowd density is too high to supply individuals’ space demands, visitors will be in a psychological state of overload because they feel pressure from others or their target behaviors are restricted. This negative psychological state is related to the causes of crowding (Gramann & Burdge, Citation1984). Objective environment, personal experience, and group interaction lead to spatial crowding, personal crowding, and social crowding respectively (Sherrod, Citation1974; Stokols et al., Citation1973). Among them, spatial crowding is a result of visual stimulation brought by a high-density environment (Li et al., Citation2020). The increase in visitor density leads to physical space tension and spatial crowding (Rapoport, Citation1975).
In terms of tourism, carrying capacity is a support structure closely related to tourist overcrowding (Bertocchi et al., Citation2020). The United Nations World Tourism Organization defined carrying capacity as the maximum number of people that may visit a tourism destination at the same time, without destroying the physical, economic, and socio-cultural environment and an unacceptable decrease in the quality of visitors’ satisfaction (Priority Actions Programme/Regional Activity Centre, Citation1997). In this study, we mainly focus on the spatial crowding caused by tourist density. Crowding occurs when the visitor number exceeds a destination’s carrying capacity. (Jurado et al., Citation2013).
The impact and management of visitor crowding in WHS
Mass access has negative effects on WHS and the visitor experience, resulting in problems such as attraction overloading, traffic congestion, inadequate reception facilities, declining service quality, and increased safety risks (Shen et al., Citation2018). Previous studies have shown that when visitors encounter spatial crowding, their satisfaction with tourist destinations decreases, which may further lead to a negative impact on their intention to revisit (Liu & Ma, Citation2019). It indirectly affects travelers’ loyalty to the destination and their tourist behaviors, which is not conducive to the long-term sustainable development of WHS (Li et al., Citation2009). In addition, crowding in fragile WHS may undermine conservation. Studies have shown that heritage sites with high tourist saturation are more vulnerable to destruction than those with low saturation (Petr, Citation2009). In most WHS, once restrictive measures were implemented (e.g. restricting the visitor number, closing trails, etc.), the damage to WHS would be significantly reduced (Enseñat-Soberanis & Blanco-Gregory, Citation2022). Therefore, it is necessary to further manage the spatial crowding of WHS.
Identifying carrying capacity and managing excessive visitor numbers are effective measures to manage the spatial crowding of WHS (Enseñat-Soberanis & Blanco-Gregory, Citation2022). In recent years, the number of tourists to popular WHS has been growing rapidly, triggering discussions among researchers on carrying capacity and crowding management of WHS. Bertocchi et al. (Citation2020) identified the sustainable number of visitors to Venice by setting a fuzzy linear programming model through questionnaires distributed to visitors and residents. Enseñat-Soberanis and Blanco-Gregory (Citation2022) used quantitative questionnaires and visual methods to determine the maximum visitor number and crowding criteria for domestic and international tourists of the Mayan archaeological site in Tulum, Mexico. However, the traditional methods include some uncertainties, one from the subjectivity of the questionnaire set, and the other from the lack of consideration of local space (Bertocchi et al., Citation2020).
Crowding and tourist spatial-temporal distribution
From the perspective of the entire tourism process, visitor crowding occurs in the round-trip process between macro destinations and between attractions within mesoscale destinations, as well as the local crowding of spatial paths and nodes within attractions (Zheng et al., Citation2021). It is necessary to distinguish between these different environments, as space is considered one of the three main constraints on visitors’ perception of crowding (the other two are controlled by social and personal factors) (Shelby & Heberlein, Citation1984). However, until now, it has remained difficult for researchers to measure and manage visitor local crowding in different spatial settings within WHS, and related works were mainly fuzzy calculations of macro-regional carrying capacity (Enseñat-Soberanis & Blanco-Gregory, Citation2022). Carrying capacity is only an objective or ideal criterion to judge crowding (Lindberg et al., Citation1997), which does not reflect the dynamic characteristics of visitors within attractions on the spatial-temporal scale.
Crowding is essentially a phenomenon of the excessive gathering of visitors at a specific spatial-temporal scale, thus tourist spatial-temporal distribution can directly reflect local spatial crowding of visitors at stationary points under a time constraint (Li et al., Citation2020; Song et al., Citation2020). To date, empirical works have focused on exploring local crowding through the spatial distribution of visitors within scenic areas, and most studies of open areas have been conducted at a relatively coarse level of spatial resolution (Needham et al., Citation2004; Tarrant, Citation1999). For example, Tratalos et al. (Citation2013) used aerial videography data to estimate the spatial distribution of visitors on a recreational beach and found a strong negative correlation between visitors’ spatial crowding and their distance to the beach entrance. Pettebone et al. (Citation2013) monitored the spatial distribution of crowds by local cable lines in Yosemite National Park to assess the local crowding of visitors at the Half Dome attraction. These efforts helped introduce visitor distribution into crowding research applications, particularly at the intra-attraction scale. But few researchers have considered the temporal distribution of visitors and combined both temporal and spatial dimensions to analyze visitor crowding (Liu et al., Citation2022). The temporal variability of the spatial crowding effect has not been widely addressed (Needham et al., Citation2004). Using tourist spatial-temporal distribution at a microscopic scale can explore the spatial-temporal patterns, causes, and management of local crowding within WHS (Huang et al., Citation2020).
Tourist spatial-temporal distribution within attractions
Tourist spatial-temporal distribution research is often conducted at three scales: inter-destination, intra-destination, and intra-attraction (Zheng et al., Citation2021). Tourist spatial-temporal distribution studies of inter-destinations and intra-destinations focus on regions or cities (Hallo et al., Citation2012). In contrast, intra-attraction tourist behavioral studies mainly focus on smaller places, with clearly defined boundaries. Zhang et al. (Citation2017) proposed the optimization strategy of spatial design to improve carrying capacity by studying the influence of the spatial structure of theme parks on tourist temporal-spatial distribution. Huang et al. (Citation2020) found that visitors are mainly concentrated in popular locations in attractions, and high-density areas have a variety of facilities (exhibitions, amusement facilities, shops, etc.), leading to local overload. Liu et al. (Citation2022) revealed three tourist spatial-temporal patterns in the Huangshan Scenic spot through geographical tagging photos and GPS track data. These studies found that attractive stationary points affect the spatial layout of visitors, resulting in local crowding. Understanding the spatial-temporal distribution of visitors at stationary points on the micro-scale is helpful to manage intra-attraction visitors (Edwards & Griffin, Citation2013) and alleviate crowding (Shi et al., Citation2017).
Previous research methods of intra-attraction tourist spatial-temporal distribution mostly used manual observation, digital equipment, or monitoring technology to record behavior data at a specific location and period (Do et al., Citation2016). Manual counting observation, questionnaire surveys, and interviews are highly controllable (Shah et al., Citation2013). But the methods require an enormous investment in labor and easily lead to deviation caused by subjective impressions (Anderson, Citation1971), which is not suitable for heritage attractions with a large number of stationary points. In recent studies, researchers have used digital monitoring techniques to collect tourist temporal-spatial behavior data (Sugimoto et al., Citation2019). For example, Zheng et al. (Citation2017) collected high-quality movement data using GPS to predict the potential location of a focal tourist based on the person’s current trajectory and the experience of previous tourists at the Summer Palace. Grinberger et al. (Citation2014) used GIS tools to process high-resolution spatial-temporal data of Hong Kong visitors obtained by GPS to identify visitors’ location preferences and path choices under the limitation of time and space. GPS and GIS can obtain a large amount of tourist temporal-spatial data in macro-scale spaces, making up for the shortcomings of tracking and questionnaire methods (Hallo et al., Citation2012). However, the accuracy of behavior data through them is highly affected by device setup and techniques (equipment location, satellite signal strength, data granularity, and beacon distribution density) (Yan et al., Citation2021). They are difficult to control and repeat experiments in complex environments (Bruneau et al., Citation2015), especially in micro-scale WHS with mass crowds gathered. Because of limitations of environment and technology, the methods adopted in these studies appear insufficient in pinpointing visitors’ movement at microscale stationary points, clouding the accuracy and objectivity of results and limiting the quantity and diversity of data, thereby impeding in-depth analysis.
With the continuous progress of a vast array of computer vision applications, video, and image data processing was supported to enable pedestrian identification, moving target tracking, and automated analysis (Zeng et al., Citation2014). This technique generally features a combination of video systems, a stand-alone microcomputer, and a set of AI or computer vision algorithms (Yan et al., Citation2021). At present, the main application directions are real-time traffic condition analysis, intelligent monitoring, crowd safety evacuation, and accident early warning (Dziedzic et al., Citation2019; Favaretto et al., Citation2016). Video-based computer vision technology has realized the long-term, repeated and precise monitoring, as well as automatic analysis of massive crowd behaviors (Wang et al., Citation2012), making up for the deficiencies of previous techniques. The new technology provides an opportunity for us to further explore local crowding based on tourist spatial-temporal distribution at stationary points in cultural heritage sites. In this paper, we made full use of the monitoring system of WHS and increased camera equipment to record the behavior data of visitors at each stationary point. To obtain the number of visitors and their dwell time at stationary points accurately, we improved the video analysis algorithm according to the spatial structure of WHS to overcome the complex external environmental interference.
In the next section, we explain the methodology of the research, taking the Master-of-Nets Garden in China as an ideal study case.
Methodology
Study area
The Master-of-Nets Garden is the only private garden with a preserved residence and garden in Suzhou, Jiangsu Province, China (). It was founded in the Southern Song Dynasty, with a history of over 800 years, and created as a UNESCO (United Nations Educational, Scientific and Cultural Organization, Citation2016) World Heritage Site in 1997. Covering an area of approximately 6670 m2, it is mainly divided into three parts. The entire garden, although small, has a compact layout and a well-proportioned spatial scale. It is famous for its exquisite garden layout, profound cultural connotations, and elegant garden atmosphere. As a World Cultural Heritage Site, the Master-of-Nets Garden represents the highest level of Chinese Classical Garden (CCG) art, furnishing people with an ideal space for harmony between humans and nature (Li et al., Citation2019; Yao et al., Citation2020) through the simulation of natural sceneries, the regulation of water and terrain, and the layout of buildings, plants, stones, calligraphy, and paintings (Wang, Citation2016). The Master-of-Nets Garden has become a popular public tourist scenic spot and the first choice for Chinese cultural heritage tourism. The average daily number of visitors to the garden is about 1500 in the off-season and 3570 in the peak season. The number of visitors was even 4500 per day during the Spring Festival, 2022 (China Tourism Research Institute, Citation2022). The visitor number on peak days is 2∼3 times more than usual. Growing numbers of visitors flowing to the site have led the Master-of-Nets Garden to face the crowding phenomenon on every Chinese holiday, while the complex and changeable spatial structure of the heritage site increases the possibility of crowding during the tour (Dai et al., Citation2012). The crowded attraction significantly affects visitors’ recreation experience and public health and safety, which is not conducive to the sustainable development of the cultural heritage site.
Figure 1. The location (a, b), ichnography (c), and space types (d) of the Master-of-Nets Garden.
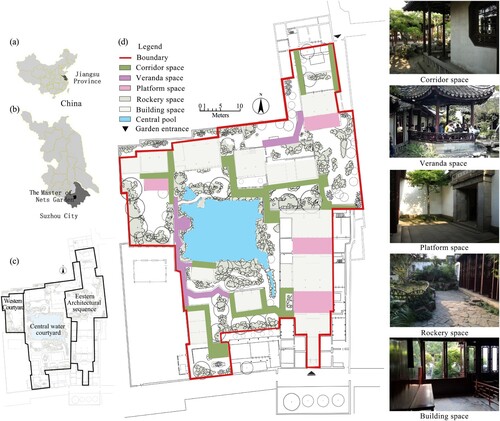
In this paper, we have selected the resident and garden area of the Master-of-Nets Garden as the research scope. To facilitate later analysis and stationary point labeling, we divided the spaces into five categories (). The corridor space (NC) is attached to a single building and under the eaves; the veranda space (NV) is a corridor space with a roof and not attached to buildings; the platform space (NP) is distributed in the south and north of main buildings in the garden; the rockery space (NR) is a tourist space formed by stacking mountains and rocks (including islands in the lake, stone tables, small bridges); and the building space (NB) includes halls, porches, and pavilions in the garden.
Data collection
Visitor data collection of the Master-of-Nets Garden
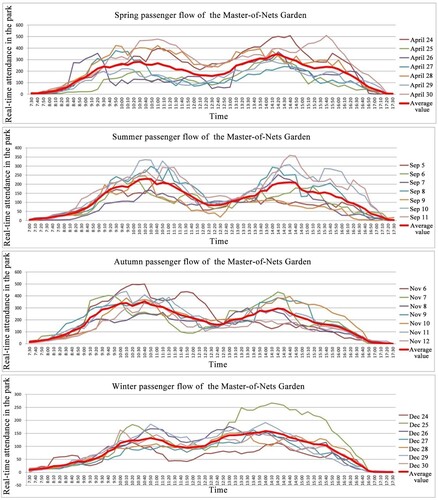
We obtained basic data about the number of visitors entering and leaving the park provided by the Master-of-Nets Garden Management Office. The collection time was 8:30–16:30 every day (garden opening hours are 8:00–17:00), from 24 April to 30 April (spring), 5 September to 11 September (summer), 6 November to 12 November (autumn) and 24 December to 30 December (winter) 2016. As shown in , the tourist flow of the attraction has obvious temporal characteristics. The two peak values of visitors appear at 10:30–11: 00 and 14:00–14:30, and the trough appears at 12:00–12:30. The average tourist flow in spring is the highest. On nonworking sunny days (China Meteorological Data. 2016), the number of visitors is the largest, and their age range is the widest. Therefore, this study selected a nonworking day in spring (4376 visitors, sunny day, Saturday, 30th April 2016) for a specific quantitative analysis.
Figure 2. The real-time number changes of visitors in the garden.
Visitor data collection at stationary points
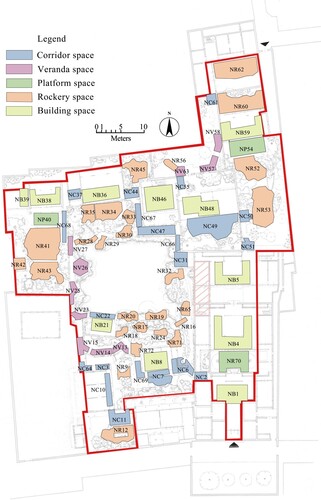
We selected and identified 72 stationary points in the study area by on-site observing where visitors gathered and with obvious staying behavior, and classified them according to spatial types. The location and scope of each stationary point are shown in . Camera devices were installed in the vicinity of 72 potential stationary points, covering the area to capture tourist video data.
Figure 3. The distribution and the serial number of stationary points. (NC, NV, NP, NR, and NB are corridor space, veranda space, platform space, rockery space, and building space).
Video data procedure
We used a computer vision program to automatically analyze the tourist video data obtained at stationary points. After the pretreatment (integration, interception, and denoising) of all video data, the main process is as follows:
Set up the object detection area: The video target detection area is the range collection of vertical projection points of the crowds who have staying behavior in the video coverage area.
Moving target detection: Most foreground extraction methods were generally processed in RGB color space (Barnich & Van Droogenbroeck, Citation2011), which were difficult to fit the requirements of complex scenes. This paper applied an improved ViBe moving target detection algorithm based on the Lab Color Space (Liu et al., Citation2017), effectively solving the difficult problem of inaccurate tourist identification caused by the disturbance of the garden environment.
Moving target tracking: this study adopted the tracking algorithm based on the color histogram (Zhao et al., Citation2010).
Target number output: through observation, the obvious stationary behavior of visitors was at least 5 seconds. The number of visitors, whose dwell times were 5, 6, 8, 10, 12, 20, 40, 60, 90, and 150 seconds at stationary points, was updated every 5 minutes and exported cumulatively.
Data calculation method
Spatial carrying capacity
This paper focuses on the local space crowding of visitors at stationary points. It was used to determine whether there was spatial crowding through the comparison of the actual number of visitors and spatial carrying capacity. The study adopted the calculation method of spatial carrying capacity and the value of data standard from China Guide for Maximum Carrying Capacity of Scenic Spots (2014). The formulas for calculating the spatial carrying capacity of the whole garden (1) and stationary point space carrying capacity (2) are:
(1)
(1)
(2)
(2) Xi is the effective sightseeing area of attraction i, Yi is the visitor unit tourism area of attraction i, T is the effective opening time of WHS a day, t is the average visiting time of visitors in WHS, C is the instantaneous carrying capacity of space, and Z is the average daily turnover rate of WHS.
Spatial local crowding measure
Tourist density is an objective index that can directly measure spatial crowding, reflecting the size of space per visitor. Due to the uneven distribution of tourists in attractions, we used the ratio K of the tourist density of stationary points to the average density of the whole garden to represent the spatial crowding of stationary points. The formula (3) is:
(3)
(3) t is tourist dwell time, n is the serial number of stationary points, ρtn is the density of visitors staying at a stationary point for a period, ρt0 is the average density of visitors in the whole garden, Ntn is the number of visitors staying at the stationary point n for a certain period t, Sn is the area of the stationary point n, P is the actual number of tourists in the whole garden during a day, and S is the accessible area of the whole garden.
Results and analysis
Spatial carrying capacity of the Master-of-Nets Garden and stationary points
X is the effective sightseeing area of the garden (1565.73 m2), the opening time of the Garden is 10 hours, and the average visiting time of each visitor in the garden is 2 hours. Y and C are defined by the standards of the Master-of-Nets Garden management department. According to formulas (1) and (2), the spatial carrying capacity of the Master-of-Nets Garden is 5685 visitors, and the spatial carrying capacity of stationary points is 12∼277 visitors ( in Appendix A). The total number of visitors was 4376 on April 30, which did not exceed the garden’s spatial carrying capacity. Meanwhile, there was no visitor crowding warning announced by the Master-of-Nets Garden Management Office. However, as shown in , the real number of visitors staying at each stationary point is far more than their spatial carrying capacity. There is a large gap between the number of visitors staying at stationary points for 5–20 seconds and the spatial carrying capacity. Only when the dwell time of visitors at stationary points is longer than 20 seconds, do the numbers of visitors at some stationary points begin to fall below their carrying capacity.
Figure 4. Stationary points’ spatial carrying capacity and their actual number of visitors with different dwell times (N5, N6, N8, N10, N12, N20, N40, N60, N90, and N150 are actual numbers of visitors at stationary points, whose dwell times are 5, 6, 8, 10, 12, 20, 40, 60, 90, and 150 s, respectively).
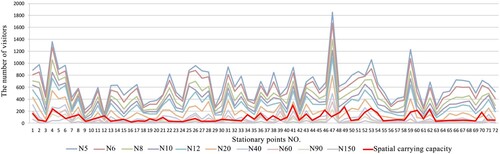
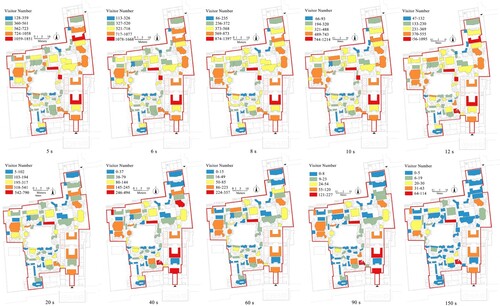
To visually present the spatial-temporal distribution of the crowds at stationary points, we loaded the number of visitors staying 5∼150 seconds at stationary points into ArcGIS10.2 software. As shown in , the visitor spatial-temporal distribution in the garden is extremely unbalanced, and the visitor density at some stationary points is always at a high level. In open spaces with large platform spaces or seats (such as NC47, NB4, NC31, etc.), visitors’ dwell time is more than 20 seconds (including 20 seconds). The average time for visitors to pass through each stationary point is about 15 seconds, but the average time to pass through other areas is only 6.54 seconds. The results mean that tourist activities (taking photos, visiting, communicating, resting, etc.) mainly take place at stationary points, while the rest of roads and sites are only scenery space passageways. Tourists’ visiting movements in the garden aren’t a single line with uniform speed, but repeatedly and quickly stay at some stationary points, resulting in an agglomeration phenomenon. Therefore, although the actual visitor number in the garden doesn’t exceed its spatial carrying capacity, local spatial crowding still occurs at stationary points.
Figure 5. The distribution of visitors at stationary points with different dwell times.
Spatial-temporal characteristics of local spatial crowding at stationary points
and reveal that the total number of visitors staying at stationary points for 5 seconds is the largest, with an average decline rate of about 50% when dwell time is 12 seconds and a sharp decrease in visitor distribution after 20 seconds. Therefore, the numbers of visitors staying at stationary points for 5, 12, and 20 seconds were selected to calculate the spatial crowding index K of each stationary point on the day (, ).
Figure 6. K-value line chart of spatial crowding at stationary points with different dwell times.
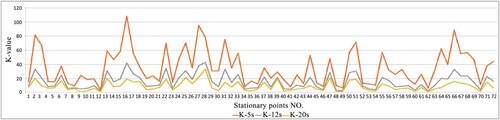
Table 1. The spatial crowding index K of different seconds at each stationary pointTable Footnotea.
Temporal changes of spatial local crowding at stationary points
As shown in and , the crowding index K of stationary points are 3.4∼108.5, 1.7∼42.9, and 0.5∼33 when visitors’ dwell times are 5, 12 and 20 seconds, and average K-values are 35.4, 15.5, 9.0, respectively. The results illustrate that with an increase in the dwell time of visitors at stationary points, the local space crowding of stationary points decreases. The local spatial crowding effect of stationary points negatively correlated with the dwell time of visitors at stationary points.
Local crowding of stationary points at different spatial types
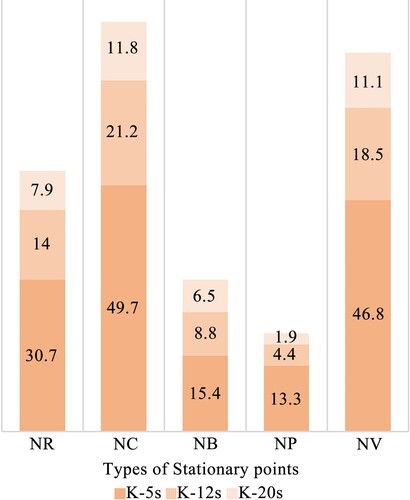
Statistically analyzing the average K-value of five spatial types in the Master-of-Nets Garden (), we found that the spatial order of local crowding effect is: Corridor space (NC) > Veranda space (NV)> Rockery space (NR) > Building space (NB) > platform space (NP). Due to the relatively large area and the single function of platforms and buildings, although the number of visitors is large, their level of spatial crowding is low. The other three types are usually both passageway and landscape spaces, with various functions such as transportation, scenery appreciation, rest and so on, attracting a large flow of visitors. Especially the corridor space (NC), which is the connection vein of buildings and the tourism guidance system of the garden, with the highest density of visitors, is very prone to crowding. It indicates that the more spatial functions in space, the greater number of visitors are attracted. Tourists with different travel behaviors and purposes gather in these small spaces and interfere with each other, leading to spatial crowding.
Figure 7. The average local crowding index K of five spatial types in the Master-of-Nets Garden.
The influence of local crowding on tourist behavior
Visitor space choices in the local crowded situation
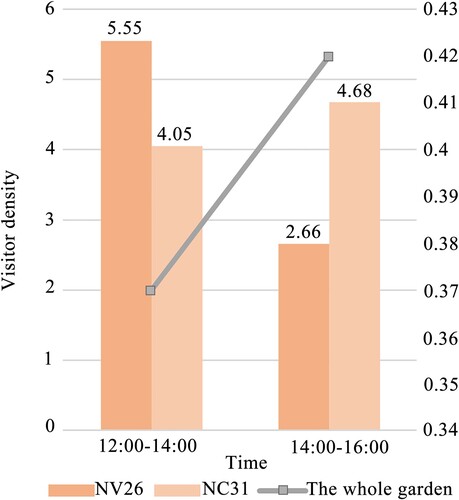
When the crowded space cannot meet visitors’ tourism needs, they tend to spontaneously find a more comfortable alternative space (Liu & Ma, Citation2019). For example, NV26 is a key point in the Masters-of-Nets Garden, a must-visit for visitors because of its prominent position and unique shape. NC31 (opposite NV26) is similar in size to NV26, and both of them have excellent viewing angles, allowing a complete view of the central water pool, with the function of resting. According to the real-time tourist flow data of the garden, the trough of the number of people appeared at 12:30 (234), and the peak appeared at 15:40 (510) on April 30. As shown in , the visitor density of NV26 is higher than that of NC31 during the low period of visitor numbers, while during the peak period, the visitor density of NV26 is lower than that of NC31. As a necessary place to pass the central pool, the sharp influx of a large number of people will inevitably lead to local crowding and a serious decline in the experience of tourists. As the scenery of NV26 and NC31 are highly similar, when the number of tourists is suitable, visitors are naturally willing to choose NV26 with a better viewing location. However, when the number of visitors increases to a certain extent, visitors staying at NV26 leave for NC31 because their sightseeing behavior is affected by local space crowding.
Figure 8. Visitor density in different periods of the day at NV26, NC31 and the whole garden.
Visitor spatial path choices at high-density stationary points
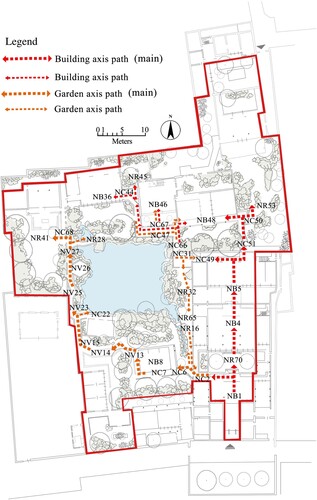
We selected 10 high-density stationary points with multiple-path intersections of the Master-of-Nets Garden. These points are located on the main tour lines of the garden, determining the direction of visitor route selections. We replayed the video of the 10 stationary points and recorded the number of people choosing different directions. According to visitor choices of routes and directions (), we drew a tourist trajectory map of the Master-of-Nets Garden (). As shown in , visitors at high-density stationary points tend to visit from the residential building sequence (NB1 to NB5), rather than the garden sequence (NB1 to NC6). When tourists visit the Master-of-Nets Garden in a building sequence, their walking tracks are counter-clockwise, while if they enter the garden area at the entrance, their trajectory is in a clockwise direction. According to video data, the total number of counter-clockwise visitors in the study area accounts for 71.2%, indicating that the counter-clockwise tour route carries more visitors in the Master-of-Nets Garden, which is the key route of local crowding management.
Figure 9. The route direction selections of visitors at 10 multi-path intersections.
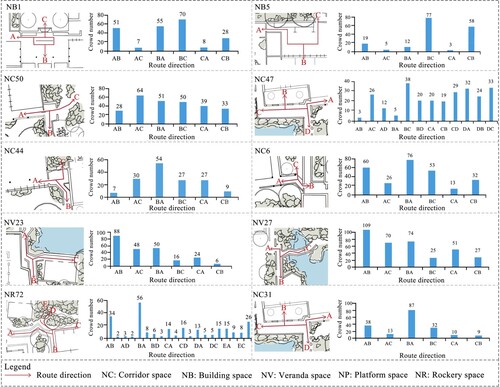
Figure 10. The main directions of the tourist trajectory in the Master-of-Nets Garden.
Spatial characteristics of hot stationary points
illustrates that some ‘hot’ stationary points are highly attractive to visitors and prolong their dwell time. A better understanding of their spatial characteristics can lead to steps being taken to spread visitors to less well-used areas by providing more activities and space optimization in unpopular areas (Davey, Citation2006). We analyzed the spatial characteristics of hot stationary points:
High accessibility is convenient for gathering a large number of people. The five stationary points with the most visitors in the whole day (NC47, NB4, NC31, NB59, NC6) are located on the necessary tourist lines, with at least three paths passing through.
A large area is a prerequisite to ensuring tourist comfort. The above five stationary points are spacious enough to provide a comfortable place for massive numbers of visitors from different paths to enjoy the scenery, rest, exchange, and other activities.
The place of spatial transformation strengthens the richness and changeable sense of visitors’ spatial experience. NC47, NC31, and NC6 are all located in the space transformation places between the residential area and the central water courtyard, forming a strong spatial contrast. When people enter the central water courtyard through these three stationary points, they either experience the change from dark to bright or go through the twists and turns of the space, enhancing the drama and pleasure of their experience in the space and producing a strong psychological induction for visitors.
With the rest function, stationary points provide the possibility to trigger diversified tourist behavior. NC6, NC31, and NV26 are equipped with long stools. They can accommodate multiple people to rest at the same time, adding a variety of static activity spaces for visitors, such as rest, communication, eating, and reading.
The scenery to be enjoyed is rich and varied in order to meet the different aesthetic needs of visitors. For example, NC47 involves five kinds of landscape elements. First, the landscape element itself is a building, whose specific form of expression is a pavilion. Second, the building near the central pool, whose waterscape is the best landscape of the garden. Third, a variety of plant elements, with several bamboo clusters planted at the north leakage window, and a pine tree planted at the leaking window on the west side. Fourth, a rockery is on the opposite side of the pool. Finally, there are stone inscriptions at NC47, belonging to a humanistic element.
Discussion and conclusions
The purpose of this study is to investigate visitor local crowding from a perspective of space-time as well as its influence on visitor behavior based on tourist spatial-temporal distribution within a complex and small-scale WHS.
Theoretical implications
First of all, we emphasized the impact of actual tourism mode and spatial-temporal distribution characteristics on carrying capacity measures and local crowding management (Pikkemaat et al., Citation2020). Tourism carrying capacity management is a priority theme on the agenda of all local governments (Bertocchi et al., Citation2020). In the current capacity management practice, China’s national departments proposed relevant rules for the management of maximum carrying capacity, and scenic spots generally took it as a management tool. However, this study found that on peak tourism days, although the actual number of visitors did not exceed the maximum carrying capacity of the WHS, the number of visitors gathering at stationary points in a short period far exceeded the carrying capacity of stationary points. This result is consistent with previous studies that there are different sustainability dimensions of carrying capacity at different scales and spaces (Saarinen, Citation2006). The maximum carrying capacity is an ideal model (Lindberg et al., Citation1997) but not a perfect management tool (Zacarias et al., Citation2011). More importantly, in this study, we explored the causes of local crowding at stationary points based on tourist spatial-temporal distribution. Tourist activities within attractions are complex and variable, rather than unidirectional linear and uniform movements (Yan et al., Citation2021). Because of the strong attractiveness of stationary points to visitors, they repeatedly and rapidly stay at stationary points, forming dense crowd areas and leading to uneven tourist spatial-temporal distribution. What’s more, accessibility, guide systems, and other elements increase the imbalance of the visitor distribution in the garden (East et al., Citation2017), so that the visitor density at stationary points is always at a high level, eventually leading to local spatial crowding.
Second, most previous studies have explored the relationship between local spatial crowding perception and tourist spatial distribution (Pettebone et al., Citation2013; Pikkemaat et al., Citation2020). But they neglected the effect of visitors’ temporal distribution on crowding. By visualizing tourist spatial-temporal distribution, this study correlated the location of stationary points where local crowding occurs with the dwell time of visitors staying at stationary points, revealing the temporal-spatial characteristics of local crowding at stationary points. In terms of time, with the extension of visitors’ dwell time at stationary points, the decrease rate of both stationary point traffic and spatial crowding index reached more than 50%, indicating that the local spatial crowding effect is negatively correlated with visitors’ dwell time at stationary points. In terms of space, the local crowding effect of stationary points is different for space types with different functions. The different effect implies that spatial function types affect local crowding, and the increase of spatial function may enhance the local crowding effect. Among them, spaces assumed both viewing and access functions are highly susceptible to local crowding. This result extended the findings of Liu et al. (Citation2022) and Huang et al. (Citation2020) on the location of local crowding occurrence.
Third, local spatial crowding affects visitors’ spatial choice and path selection behaviors. The results validated the strategies (Displacement and Product Shift) tourists adopt when they encounter crowding (Shelby et al., Citation1988). This study found that when a crowded space does not satisfy visitors’ travel needs, they tend to adjust their dwell time at crowded sites, avoiding peak periods and spontaneously looking for a more comfortable alternative space, for changing time or space (Kearsley & Coughlan, Citation1999). On this basis, we found that visitors tend to choose counterclockwise paths and building axes with high spatial homogeneity. We also made an in-depth analysis of the structural characteristics of visitors’ preference spaces, which are high accessibility, a large area, with rest and space conversion functions, and rich landscape. These results provide a theoretical basis for the next step of local crowding management.
Finally, this research demonstrated the importance of studying crowding from the perspective of tourist spatial-temporal distribution. Previous studies have mainly focused on the subjective evaluation of perceived crowding in large-scale areas (Dodds & Butler, Citation2019). However, tourist spatial-temporal distribution and digital tools provide insight into local crowding at microscopic scales within attractions (Liu et al., Citation2022). This study proposed the stationary point methodology. First, the method obtains the number of visitors with different dwell times at stationary points through a computer vision algorithm processing the visitor video data recorded by camera equipment for multiple days and periods. Second, the local spatial crowding is verified by the carrying capacity of stationary points and the actual number of visitors, the tourist spatial-temporal distribution is visualized by GIS to determine locations of local crowding, and the local crowding effect within an attraction is quantified by visitor density with different dwell times at stationary points. Third, visitor behaviors under local crowding scenarios are clearly and objectively presented through video playback. Although tourism researchers may pay more attention to visitors’ psychological data, the factual information provided by tracking technology can infer internal rules from objective phenomena and avoid data ambiguity caused by a subjective evaluation. The method, based on objective tracking data, is likely to become common in the future. Its analytical framework can also be extended to other tracking techniques and study areas. For example, in historical cities, although the visitor flow in macro-regions is linear and unidirectional (Nevola et al., Citation2022), visitor behaviors in important attractions are still similar to those of the study area. The macro-region can be divided into micro-functional areas using a GPS heat map to determine visitor concentration areas. Then the stationary point methodology can be used to analyze local crowding at the micro-scale in each hot area.
Managerial implications
The empirical case of the Master of Nets Garden provides practical insights for the study of micro and fine-grained tourism environment, helping to manage the local crowding of WHS, and promoting the effective protection and sustainable development of WHS.
First of all, the management department should pay attention to carrying capacity management of stationary points. The number of visitors at stationary points is generally higher than that at other sites. This study proved that the maximum carrying capacity only reflects the maximum visitor number in the whole scenic spot, but does not solve local crowding issues at stationary points caused by the uneven tourist spatial-temporal distribution. Therefore, the management should adopt the ‘double warning’ mechanism, combining the maximum carrying capacity warning mode and the thermal stationary point warning mode. They should also sell tickets reasonably according to the carrying capacity of ‘hot’ stationary points. In addition, the average visiting time of the garden is 2 hours, so managers can use the booking system of 2 hours or 4 hours in travel peak periods, and charge different prices according to different periods, effectively limiting the visitor numbers.
Secondly, rather than limiting the visitor numbers, the dispersion of tourist time or space would be a better solution, as it could influence tourist behavior without any enforcement (Song et al., Citation2020). According to tourist spatial-temporal distribution characteristics in the garden, the ‘tour diversion’ mechanism of tourist routes is set up to guide visitors to change their tour direction before hot stationary point saturation. In addition, relying on the smart mobile phone platform, the space-time diversion system of garden tourism is constructed. Visitors can learn about the current situation of attractions in time, and choose actively a route with low traffic. Due to the counterclockwise appreciation characteristic of visitors in the garden, it is also possible to set up clockwise reminder facilities at the entrance and other multi-path intersections during peak periods to organize visitor travel order.
Thirdly, the findings help us to better understand visitors’ travel preferences, helping managers to predict where visitors will go next and reveal potential marketing strategies (Mckercher et al., Citation2019). Depending on the spatial structure of visitor preferences, the WHS can improve visitor satisfaction by enhancing the attractiveness of ‘cold’ stationary points to relieve crowding. For example, cultural activities (e.g. live theatrical performances), environmental improvements (e.g. increasing rest facilities and enriching landscape), and the display and sale of cultural products can be added to spaces that are less attractive to visitors. In addition, the garden can develop night tourism, providing visitors with enjoyable and different experiential activities to avoid crowding during peak daytime hours (Musikyan, Citation2016).
Finally, the results of this study also have practical implications for local crowding management in the post-epidemic era. Before the blockade caused by COVID-19, the number of visitors to the garden had been reaching saturation. Restrictions on travel due to the pandemic led to a decrease in the visitor numbers. However, with the effective control of the pandemic, visitor flow has risen again. The number of visitors received from the garden has largely returned to the pre-epidemic level during the peak season, 2022 (China Tourism Research Institute, Citation2022). Based on our current on-site observations in the garden, visitors’ gathering locations, visiting time, and behavioral preferences remain unchanged. Therefore, the results of this study are still applicable to the current environment. However, we compared questionnaire data from 200 on-site visitors during the same period in 2016 and 2022, and found that visitors’ perception of local crowding at stationary points was higher in the post-epidemic period (63.5%) than in the pre-epidemic period (41.7%). We suggest that it may be due to the increased awareness of risk prevention, increased psychological safety distance, and reduced tolerance of density among visitors in the post-epidemic period (Rooij et al., Citation2022), which have lead to the effects of local crowding being more prominent in the post-epidemic period. Therefore, the control of stationary point carrying capacity and the management of local crowding should receive more attention.
Limitations and future research
This study used computer vision techniques to obtain visitor spatial-temporal distribution data to study local crowding. First, it is difficult to obtain quantitative visitor data because of environmental interference. Therefore, we improved the computer vision algorithm to overcome the problem of target recognition. This algorithm is suitable for the CCG, needing to be further tested and optimized in other WHS. Second, the equipment used for this research process is expensive and the locations of stationary points within microsites may be easily located by observation, limiting the generalizability of the method. Future research in macro areas can be combined with other tracking technologies that are easier to access (e.g. GPS, heat maps, mobile phones, or social media) to locate small crowd-gathering areas of macro-region and then explore local crowding in different micro-areas. Finally, the study lacks other variables related to crowding. The research on visitor local crowding in WHS is based on the primary space factor of crowding (Neuts & Nijkamp, Citation2012), taking carrying capacity, visitor number, and density as research indicators, but insufficient consideration of perceived crowding. It may affect the results of this paper to some extent. Future analyses based on objective tracking data and subjective responses in questionnaires are encouraged. Integrating actual and psychological data types of visitors to take advantage of the strengths of each data type, will further enrich and refine applications of the stationary point methodology in crowding studies.
Acknowledgments
The authors would like to acknowledge the support provided by the Master-of-Nets Garden for the installation of the experimental equipment.
Disclosure statement
No potential conflict of interest was reported by the author(s).
Additional information
Funding
Notes on contributors
Shaogang Ding
Shaogang Ding is a Professor of Landscape Architecture in Nanjing Agricultural University and the Director of the Institute of Landscape Planning and Design, Nanjing Agricultural University. Professor Ding proposed and established the stationary point methodology, which has been widely used in the study of Chinese Classical Gardens and other cultural heritage sites. His research interests include tourist behavior, tourism planning, and the protection and development of World Cultural Heritage Sites in China.
Ruishan Zhang
Ruishan Zhang is a Master Degree Candidate of Landscape Architecture in Nanjing Agricultural University. Zhang’s research interests include tourist behavior, tourist management, heritage conservation and tourism.
Yingying Liu
Yingying Liu, Ph.D. Associate Professor, Department of Automation, College of Artificial Intelligence, Nanjing Agricultural University. She optimized computer vision technology for heritage sites. Liu’s research interests include machine vision technology, image processing, pattern recognition, and tourism image.
Pan Lu
Pan Lu received an M.D. from Nanjing Agricultural University. Lu’s research interests include the history and theory of landscape architecture and tourism planning.
Minnan Liu
Minnan Liu, Master, is a Lecturer of Landscape Architecture in Zhongkai University of Agriculture and Engineering. Liu’s research interests include landscape architecture history and theory, and tourist management of World Cultural Heritage Sites in China.
References
- Anderson, J. (1971). Space-time budgets and activity studies in urban geography and planning. Environment and Planning A: Economy and Space, 3(4), 353–368. https://doi.org/10.1068/a030353
- Barnich, M., & Van Droogenbroeck, M. (2011). Vibe: A universal background subtraction algorithm for video sequences. IEEE Transactions on Image Processing, 20(6), 1709–1724. https://doi.org/10.1109/TIP.2010.2101613
- Bertocchi, D., Camatti, N., Giove, S., & van der Borg, J. (2020). Venice and overtourism: Simulating sustainable development scenarios through a tourism carrying capacity model. Sustainability, 12(2), 512. https://doi.org/10.3390/su12020512
- Bruneau, J., Olivier, A. H., & Pettré, J. (2015). Going through, going around: A study on individual avoidance of groups. IEEE Transactions on Visualization and Computer Graphics, 21(4), 520–528. https://doi.org/10.1109/TVCG.2015.2391862
- Cavalheiro, M., Joia, L., & Cavalheiro, G. M. D. C. (2020). Towards a smart tourism destination development model: Promoting environmental, economic, socio-cultural and political values. Tourism Planning & Development, 17(3), 237–259. https://doi.org/10.1080/21568316.2019.1597763
- China Tourism Research Institute. (2022). Annual report on the development of domestic tourism in China (2022-2023). Retrieved December 15, 2022, from http://ct.cn/h-nd-2491.html
- Cros, H. D. (2008). Too much of a good thing? Visitor congestion management issues for popular world heritage tourist attractions. Journal of Heritage Tourism, 2(3), 225–238. https://doi.org/10.2167/jht062.0
- Dai, X. L., Luo, C. H., & Chen, X. J. (2012). The creation of complexity in Chinese garden. Applied Mechanics and Materials, 209-211, 380–383. https://doi.org/10.4028/www.scientific.net/AMM.209-211.380
- Davey, G. (2006). Visitor behavior in zoos: A review. Anthrozoös, 19(2), 143–157. https://doi.org/10.2752/089279306785593838
- Davey, G., Henzi, P., & Higgins, L. (2005). The influence of environmental enrichment on Chinese visitor behavior. Journal of Applied Animal Welfare Science, 8(2), 131–140. https://doi.org/10.1207/s15327604jaws0802_5
- Do, T., Haghani, M., & Sarvi, M. (2016). Group and single pedestrian behavior in crowd dynamics. Transportation Research Record: Journal of the Transportation Research Board, 2540(1), 13–19. https://doi.org/10.3141/2540-02
- Dodds, R., & Butler, R. (2019). The phenomena of overtourism: A review. International Journal of Tourism Cities, 5(4), 519–528. https://doi.org/10.1108/IJTC-06-2019-0090
- Dziedzic, J. W., Da, Y., & Novakovic, V. (2019). Indoor occupant behaviour monitoring with the use of a depth registration camera. Building and Environment, 148, 44–54. https://doi.org/10.1016/j.buildenv.2018.10.032
- East, D., Osborne, P., Kemp, S., & Woodfine, T. (2017). Combining GPS & survey data improves understanding of visitor behaviour. Tourism Management, 61, 307–320. https://doi.org/10.1016/j.tourman.2017.02.021
- Edwards, D., & Griffin, T. (2013). Understanding tourists’ spatial behaviour: GPS tracking as an aid to sustainable destination management. Journal of Sustainable Tourism, 21(4), 580–595. https://doi.org/10.1080/09669582.2013.776063
- Enseñat-Soberanis, F., & Blanco-Gregory, R. (2022). Crowding perception at the archaeological site of Tulum, Mexico: A key indicator for sustainable cultural tourism. Land, 11(10), 1651. https://doi.org/10.3390/land11101651
- Enseñat-Soberanis, F., Frausto-Martínez, O., & Gándara-Vázquez, M. (2019). A visitor flow management process for touristified archaeological sites. Journal of Heritage Tourism, 14(4), 340–357. https://doi.org/10.1080/1743873X.2018.1529179
- European Parliament. (2018). Overtourism : Impact and possible policy responses. Directorate-General for Internal Policies.
- Favaretto, R. M., Dihl, L. L., & Musse, S. R. (2016). Detecting crowd features in video sequences. 29th SIBGRAPI Conference on Graphics, Patterns and Images, SIBGRAPI, pp. 201–208. https://doi.org/10.1109/SIBGRAPI.2016.036
- Ferrari, L., Mamei, M., & Colonna, M. (2014). Discovering events in the city via mobile network analysis. Journal of Ambient Intelligence and Humanized Computing, 5(3), 265–277. https://doi.org/10.1007/s12652-012-0169-0
- Gramann, J. H. (1982). Toward a behavioral theory of crowding in outdoor recreation: An evaluation and synthesis of research. Leisure Sciences, 5(2), 109–126. https://doi.org/10.1080/01490408209512996
- Gramann, J. H., & Burdge, R. J. (1984). Crowding perception determinants at intensively developed outdoor recreation sites. Leisure Sciences, 6(2), 167–186. https://doi.org/10.1080/01490408409513029
- Grinberger, A. Y., Shoval, N., & Mckercher, B. (2014). Typologies of tourists’ time–space consumption: A new approach using GPS data and GIS tools. Tourism Geographies, 16(1), 105–123. https://doi.org/10.1080/14616688.2013.869249
- Gutwill, J. P., & Allen, S. (2010). Facilitating family group inquiry at science museum exhibits. Science Education, 94(4), 710–742. https://doi.org/10.1002/sce.20387
- Hallo, J. C., Beeco, J. A., Goetcheus, C., McGee, J., McGehee, N. G., & Norman, W. C. (2012). GPS as a method for assessing spatial and temporal use distributions of nature-based tourists. Journal of Travel Research, 51(5), 591–606. https://doi.org/10.1177/0047287511431325
- Huang, X., Li, M., Zhang, J., Zhang, L., Zhang, H., & Yan, S. (2020). Tourists’ spatial-temporal behavior patterns in theme parks: A case study of Ocean Park Hong Kong. Journal of Destination Marketing & Management, 15, 100411. https://doi.org/10.1016/j.jdmm.2020.100411
- Jovicic, D. (2019). From the traditional understanding of tourism destination to the smart tourism destination. Current Issues in Tourism, 22(3), 276–282. https://doi.org/10.1080/13683500.2017.1313203
- Jurado, E. N., Damian, I. M., & Fernández-Morales, A. (2013). Carrying capacity model applied in coastal destinations. Annals of Tourism Research, 43, 1–19. https://doi.org/10.1016/j.annals.2013.03.005
- Kearsley, G., & Coughlan, D. (1999). Coping with crowding: Tourist displacement in the New Zealand Backcountry. Current Issues in Tourism, 2(2-3), 197–210. https://doi.org/10.1080/13683509908667851
- Li, A., Mou, N., Zhang, L., Yang, T., Liu, W., & Liu, F. (2020). Tourism flow between major cities during China's national day holiday: A social network analysis using Weibo check-in data. IEEE Access, 8, 225675–225691. https://doi.org/10.1109/ACCESS.2020.3044613
- Li, J. T., Kim, J., & Lee, S. Z. (2009). An empirical examination of perceived retail crowding, emotions, and retail outcomes. The Service Industries Journal, 29(5), 635–652. https://doi.org/10.1080/02642060902720121
- Li, X., Xia, B., Lusk, A., Liu, X., & Lu, N. (2019). The humanmade paradise: Exploring the perceived dimensions and their associations with aesthetic pleasure for Liu Yuan, a Chinese Classical Garden. Sustainability, 11(5), 1350–16. https://doi.org/10.3390/su11051350
- Liang, S., Leng, H., Yuan, Q., Wang, B. W., & Wang, C. (2020). How does weather and climate affect pedestrian walking speed during cool and cold seasons in severely cold areas? Building and Environment, 175, 106811. https://doi.org/10.1016/j.buildenv.2020.106811
- Lindberg, K., McCool, S., & Stankey, G. (1997). Rethinking carrying capacity. Annals of Tourism Research, 24(2), 461–465. https://doi.org/10.1016/S0160-7383(97)80018-7
- Liu, A., & Ma, E. (2019). Travel during holidays in China: Crowding's impacts on tourists' positive and negative affect and satisfactions. Journal of Hospitality and Tourism Management, 41(C), 60–68. https://doi.org/10.1016/j.jhtm.2019.09.008
- Liu, W. B., Wang, B. X., & Yang, Y., Mou, N., Zheng, Y., Zhang, L., & Yang, T. (2022). Cluster analysis of microscopic spatio-temporal patterns of tourists’ movement behaviors in mountainous scenic areas using open GPS-trajectory data. Tourism Management, 93, 104614. https://doi.org/10.1016/j.tourman.2022.104614
- Liu, Y. Y., Chen, S., Ding, S. G., Lu, P., & Sun, Y.-h. (2017). Garden tourist detection based on improved ViBe algorithm. Computer Science, 44(S1), 224–228. https://doi.org/10.11896/j.issn.1002-137X.2017.6A.051
- McCool, S. F., & Lime, D. W. (2001). Tourism carrying capacity: Tempting fantasy or useful reality? Journal of Sustainable Tourism, 9(5), 372–388. https://doi.org/10.1080/09669580108667409
- McKercher, B., Hardy, A., & Aryal, J. (2019). Using tracking technology to improve marketing: Insights from a historic town in Tasmania, Australia. Journal of Travel & Tourism Marketing, 36(7), 823–834. https://doi.org/10.1080/10548408.2019.1580243
- McManus, P. M. (1988). Good companions: More on the social determination of learning-related behaviour in a science museum. Museum Management and Curatorship, 7(1), 37–44. https://doi.org/10.1016/0260-4779(88)90049-0
- McManus, P. M. (1998). Preferred pedestrian flow: A tool for designing optimum interpretive conditions and visitor pressure management. Journal of Tourism Studies, 9(1), 40–50.
- Mehta, R. (2013). Understanding perceived retail crowding: A critical review and research agenda. Journal of Retailing and Consumer Services, 20(6), 642–649. https://doi.org/10.1016/j.jretconser.2013.06.002
- Musikyan, S. (2016). The influence of creative tourism on sustainable development of tourism and reduction of seasonality—Case study of Óbidos [Doctoral thesis]. Polytechnic Institute of Leiria.
- Needham, M. D., Rollins, R. B., & Wood, C. J. B. (2004). Site-specific encounters, norms and crowding of summer visitors at alpine ski areas. International Journal of Tourism Research, 6(6), 421–437. https://doi.org/10.1002/jtr.504
- Neuts, B., & Nijkamp, P. (2012). Tourist crowding perception and acceptability in cities. Annals of Tourism Research, 39(4), 2133–2153. https://doi.org/10.1016/j.annals.2012.07.016
- Nevola, F., Coles, T., & Mosconi, C. (2022). Hidden Florence revealed? Critical insights from the operation of an augmented reality app in a World Heritage city. Journal of Heritage Tourism, 17(4), 371–390. https://doi.org/10.1080/1743873X.2022.2036165
- Petr, C. (2009). Fame is not always a positive asset for heritage equity! some clues from buying intentions of national tourists. Journal of Travel & Tourism Marketing, 26(1), 1–18. https://doi.org/10.1080/10548400802656694
- Pettebone, D., Meldrum, B., & Leslie, C., Lawson, S. R., Newman, P., Reigner, N., & Gibson, A. (2013). A visitor use monitoring approach on the Half Dome cables to reduce crowding and inform park planning decisions in Yosemite National Park. Landscape and Urban Planning, 118, 1–9. https://doi.org/10.1016/j.landurbplan.2013.05.001
- Pikkemaat, B., Bichler, B. F., & Peters, M. (2020). Exploring the crowding-satisfaction relationship of skiers: The role of social behavior and experiences. Journal of Travel & Tourism Marketing, 37(8-9), 902–916. https://doi.org/10.1080/10548408.2020.1763229
- Priority Actions Programme/Regional Activity Centre. (1997). Guidelines for carrying capacity assessment for tourism in Mediterranean coastal areas. PAP/RAC, 5.
- Rapoport, A. (1975). Toward a redefinition of density. Environment and Behavior, 7(2), 133–158. https://doi.org/10.1177/001391657500700202
- Riganti, P., & Nijkamp, P. (2008). Congestion in popular tourist areas: A multi-attribute experimental choice analysis of willingness-to-wait in Amsterdam. Tourism Economics, 14(1), 25–44. https://doi.org/10.5367/000000008783554785
- Rooij, P., Liempt, A., & Bendegom, C. (2022). Should we stay, or should we go? The influence of risk perceptions on revisit intentions to cultural heritage during the COVID-19 pandemic. Journal of Heritage Tourism, 17(4), 431–447. https://doi.org/10.1080/1743873X.2022.2061355
- Russo, A. P. (2002). The “vicious circle” of tourism development in heritage cities. Annals of Tourism Research, 29(1), 165–182. https://doi.org/10.1016/S0160-7383(01)00029-9
- Saarinen, J. (2006). Traditions of sustainability in tourism studies. Annals of Tourism Research, 33(4), 1121–1140. https://doi.org/10.1016/j.annals.2006.06.007
- Schmidt, D. E., & Keating, J. P. (1979). Human crowding and personal control: An integration of the research. Psychological Bulletin, 86(4), 680–700. https://doi.org/10.1037/0033-2909.86.4.680
- Shah, J., Joshi, G. J., & Parida, P. (2013). Behavioral characteristics of pedestrian flow on stairway at railway station. Procedia - Social and Behavioral Sciences, 104, 688–697. https://doi.org/10.1016/j.sbspro.2013.11.163
- Shelby, B., Bregenzer, N. S., & Johnson, R. (1988). Displacement and product shift: Empirical evidence from Oregon rivers. Journal of Leisure Research, 20(4), 274–288. https://doi.org/10.1080/00222216.1988.11969781
- Shelby, B., & Heberlein, T. A. (1984). A conceptual framework for carrying capacity determination. Leisure Sciences, 6(4), 433–451. https://doi.org/10.1080/01490408409513047
- Shen, H., Wang, Q., Ye, C., & Liu, J. (2018). The evolution of holiday system in China and its influence on domestic tourism demand. Journal of Tourism Futures, 4(2), 139–151. https://doi.org/10.1108/JTF-10-2016-0027
- Sherrod, D. (1974). Crowding, perceived control, and behavioral aftereffects. Journal of Applied Social Psychology, 4(2), 171–186. https://doi.org/10.1111/j.1559-1816.1974.tb00667.x
- Shi, B., Zhao, J., & Chen, P. (2017). Exploring urban tourism crowding in Shanghai via crowdsourcing geospatial data. Current Issues in Tourism, 20(11), 1186–1209. https://doi.org/10.1080/13683500.2016.1224820
- Song, H., Kim, M., & Park, C. (2020). Temporal distribution as a solution for over-tourism in night tourism: The case of Suwon Hwaseong in South Korea. Sustainability, 12(6), 2182. https://doi.org/10.3390/su12062182
- Stokols, D. (1972). On the distinction between density and crowding: Some implications for future research. Psychological Review, 79(3), 275–277. https://doi.org/10.1037/h0032706
- Stokols, D., Rall, M., Pinner, B., & Schopler, J. (1973). Physical, social, and personal determinants of the perception of crowding. Environment and Behavior, 5(1), 87–115. https://doi.org/10.1177/001391657300500106
- Sugimoto, K. (2013). Quantitative measurement of visitors’ reactions to the settings in urban parks: Spatial and temporal analysis of photographs. Landscape and Urban Planning, 110, 59–63. https://doi.org/10.1016/j.landurbplan.2012.10.004
- Sugimoto, K., Ota, K., & Suzuki, S. (2019). Visitor mobility and spatial structure in a local urban tourism destination: GPS tracking and network analysis. Sustainability, 11(3), 919. https://doi.org/10.3390/su11030919
- Tarrant, M. A. (1999). Variability of the perceived crowding scale: A research note. Leisure Sciences, 21(2), 159–164. https://doi.org/10.1080/014904099273219
- Tratalos, J. A., Sugden, R., Bateman, I. J., Gill, J. A., Jones, A. P., Showler, D. A., Sutherland, W. J., & Watkinson, A. R. (2013). The conflict between conservation and recreation when visitors dislike crowding: A theoretical and empirical analysis of the spatial distribution of recreational beach users. Environmental and Resource Economics, 55(3), 447–465. https://doi.org/10.1007/s10640-013-9634-2
- United Nations Educational, Scientific and Cultural Organization (UNESCO). (2016). World Cultural Heritage list. Retrieved July 6, 2017, from http://whc.unesco.org/en/list/
- Vaske, J., & Shelby, L. B. (2008). Crowding as a descriptive indicator and an evaluative standard: Results from 30 years of research. Leisure Sciences, 30(2), 111–126. https://doi.org/10.1080/01490400701881341
- Wang, B., Ye, M., Li, X., Zhao, F., & Ding, J. (2012). Abnormal crowd behavior detection using high-frequency and spatio-temporal features. Machine Vision and Applications, 23(3), 501–511. https://doi.org/10.1007/s00138-011-0341-0
- Wang, J. (2016). Contemporary design typology provided by traditional Chinese garden design principles on a site in Chicago’s Chinatown. Department of Landscape Architecture, Ball State University. http://liblink.bsu.edu/catkey/1828347
- Yan, F., Duives, D., Daamen, W., & Hoogendoorn, S. (2021). Data collection methods for studying pedestrian behaviour: A systematic review. Building and Environment, 187, 107329. https://doi.org/10.1016/j.buildenv.2020.107329
- Yao, Q., Shi, Y., Li, H., Wen, J. H., Xi, J. C., & Wang, Q. W. (2021). Understanding the tourists’ spatio-temporal behavior using open GPS trajectory data: A case study of Yuanmingyuan Park (Beijing, China). Sustainability, 13(1), 94. https://doi.org/10.3390/su13010094
- Yao, X. G., Zhang, J. P., & Xu, X. Y., Yan, Y., Sun, S., & Liu, S. (2020). Strategies for improving the microclimate and thermal comfort of a classical Chinese garden in the hot-summer and cold-winter zone. Energy and Buildings, 215, 109914. https://doi.org/10.1016/j.enbuild.2020.109914
- Zacarias, D. A., Williams, A. T., & Newton, A. (2011). Recreation carrying capacity estimations to support beach management at Praia de Faro, Portugal. Applied Geography, 31(3), 1075–1081. https://doi.org/10.1016/j.apgeog.2011.01.020
- Zehrer, A., & Raich, F. (2016). The impact of perceived crowding on customer satisfaction. Journal of Hospitality and Tourism Management, 29, 88–98. https://doi.org/10.1016/j.jhtm.2016.06.007
- Zeng, W., Chen, P., Nakamura, H., & Iryo-Asano, M. (2014). Application of social force model to pedestrian behavior analysis at signalized crosswalk. Transportation Research Part C: Emerging Technologies, 40, 143–159. https://doi.org/10.1016/j.trc.2014.01.007
- Zhang, Y., Li, X., & Su, Q. (2017). Does spatial layout matter to theme park tourism carrying capacity? Tourism Management, 61, 82–95. https://doi.org/10.1016/j.tourman.2017.01.020
- Zhao, S. L., Wang, S. Z., Lee, H. J., & Pai, H. I. (2010). Using cumulative histogram maps in an adaptive color-based particle filter for real-time object tracking. Advanced Materials Research, 121-122, 585–590. https://doi.org/10.4028/www.scientific.net/AMR.121-122.585
- Zheng, W., Huang, X., & Li, Y. (2017). Understanding the tourist mobility using GPS: Where is the next place? Tourism Management, 59, 267–280. https://doi.org/10.1016/j.tourman.2016.08.009
- Zheng, Y., Mou, N., Zhang, L., Makkonen, T., & Yang, T. (2021). Chinese tourists in Nordic countries: An analysis of spatio-temporal behavior using geo-located travel blog data. Computers, Environment and Urban Systems, 85, 101561. https://doi.org/10.1016/j.compenvurbsys.2020.101561
Appendix A
Table A1. Stationary point spatial carrying capacity and their actual number of visitors with different dwell timesTable Footnotea.
Table A2. The spatial crowding index K of different seconds at each stationary pointTable Footnotea.