
 ?Mathematical formulae have been encoded as MathML and are displayed in this HTML version using MathJax in order to improve their display. Uncheck the box to turn MathJax off. This feature requires Javascript. Click on a formula to zoom.
ABSTRACT
In this paper, we introduce the concept of ‘societal emotional environment’: the emotional climate of a society (operationalized as the degree to which positive and negative emotions are expressed in a society). Using data collected from 12,888 participants across 49 countries, we show how societal emotional environments vary across countries and cultural clusters, and we consider the potential importance of these differences for well-being. Multilevel analyses supported a ‘double-edged sword’ model of negative emotion expression, where expression of negative emotions predicted higher life satisfaction for the expresser but lower life satisfaction for society. In contrast, partial support was found for higher societal life satisfaction in positive societal emotional environments. Our study highlights the potential utility and importance of distinguishing between positive and negative emotion expression, and adopting both individual and societal perspectives in well-being research. Individual pathways to happiness may not necessarily promote the happiness of others.
The emotions people express around us influence our well-being. If people around us frequently express joy and gratitude, or anger and anxiety, then these emotions create our ‘emotional environment’. Up to now, emotion regulation research has largely focused on the intrapersonal and interpersonal effects of emotion expression, attempting to answer questions about the well-being of people who express emotions and the quality of interactions of people who express emotions, respectively. Here, we seek to further the understanding of the consequences of emotion expression by examining the possible extrapersonal effects of emotional expression: we ask how the expression of emotions might affect the well-being of people around the expresser. In order to do so, we take a cross-cultural approach and introduce the concept of a ‘societal emotional environment’ (SEE). With data collected from 12,888 participants in 49 countries, we investigate how the SEE varies across countries and cultural clusters. We test a ‘double-edged sword’ model of negative emotion expression, where the expression of negative emotions is predicted to be beneficial for the well-being of the individual expressing negative emotions but detrimental to the well-being of the broader society. We also examine whether those who inhabit SEEs high in positive emotion expression tend to have higher levels of well-being.
Societal emotional environment
People across cultures differ in their overall emotional expressivity (Matsumoto et al., Citation2008) and in their valuation of emotions of different intensity (Tsai et al., Citation2006). For instance, Confucian Asians tend to prefer low arousal positive emotions (e.g., serenity, calmness; Tsai et al., Citation2006) and are more likely to inhibit their expression of emotions (Matsumoto et al., Citation2008; Nam et al., Citation2018; Potter, 1998). Latin Americans, in contrast, tend to prefer high arousal positive emotions (e.g., excitement, elatedness; Ruby et al., Citation2012), and free, frequent, and intensive emotional expression is considered a constitutive feature of Latin American cultures (Garza, Citation1978; Triandis et al., Citation1984). These cultural differences in emotion expression are particularly interesting when one considers societal rankings of life satisfaction: Confucian countries tend to occupy lower positions of these rankings, whereas Latin Americans are typically near the top (Diener et al., Citation1995; Krys et al., Citation2018; cf. Helliwell et al., Citation2019).
We propose that in order to better comprehend societal and individual well-being, positive psychologists may need to study the SEE: the emotional climate in a given society that is constituted by the frequency of expressed positive emotions (what we refer to as the positive societal emotional environment; PSEE) and the frequency of expressed negative emotions (what we refer to as the negative societal emotional environment; NSEE). While various forms of emotional climates have been investigated in positive psychology (e.g., group positive affect; Peñalver et al., Citation2019), organisational psychology (e.g., organisation climate; Bennett, Citation2011), sociology (e.g., cultures of negativity; Wojciszke, Citation2005), education (e.g., emotional environment in a class; Harvey et al., Citation2012), etc., we take a uniquely cross-cultural approach in the current paper and apply the idea of emotional climates to entire societies. Differing emotional climates across societies may help explain why some countries have higher life satisfaction on average compared to other countries.
Individual subjective well-being is typically thought of as involving three components: cognitive evaluations of one’s life (most often life satisfaction), frequent positive emotions, and infrequent negative emotions. In studies on individuals, these three components are recognised as distinct, but mutually reinforcing factors (Busseri, Citation2018). Following this at the cultural level of analysis, we propose that SEE and societal life satisfaction (understood as the average sense of life satisfaction in a given society) constitute non-orthogonal but distinct constructs.Footnote1 Although causality is probably bidirectional, we posit that SEE might influence societal life satisfaction more than societal life satisfaction might influence SEE. Because the expression of emotions is directly observable, it can have a direct impact on the sense of life satisfaction of people around the expresser. In contrast, one’s sense of life satisfaction is not as easily perceptible and may have a more limited impact on the affect of people around (and on affect expression in particular).
Next, we theorise that even though PSEE and NSEE might be related (i.e., some cultures are generally more expressive emotionally than others; Matsumoto et al., Citation2008), they are two distinct phenomena. Various studies suggest that some societies are governed by positivity norms; cultures of indulgence (Hofstede et al., Citation2010), cultures of affirmation (Wojciszke, Citation2005), cultures of smiling (Krys et al., Citation2016) and cultures of maximization (Hornsey et al., Citation2018) may serve as examples. Studies also document that other cultures – cultures of complaining (Wojciszke, Citation2005), cultures of restraint (Hofstede et al., Citation2010), and cultures where smiling is perceived less favorably (Krys et al., Citation2016) – are governed by negativity norms. Importantly, PSEE and NSEE seem to carry divergent consequences for the well-being of people living in them. Previous studies on emotional climate provide evidence that living in a PSEE may facilitate well-being (Bennett, Citation2011), and living in an NSEE may have detrimental effects for well-being (Wojciszke, Citation2005). Research on emotional contagion (Hatfield et al., Citation1993), and on the consequences of positive and negative social interactions (Berry & Hansen, Citation1996; Lincoln, Citation2000) may further support our theorising that SEE may carry consequences for well-being. However, the emotion regulation literature appears to offer a more nuanced perspective when it comes to the consequences of emotion expression for well-being (particularly when it comes to the expression of negative emotions). We provide a brief review of this body of research below.
The intrapersonal and interpersonal consequences of emotion expression
Studies on emotion regulation show that emotion expression in general (without distinguishing between positive and negative emotions) enhances affective, cognitive, and social functioning (e.g., Chervonsky & Hunt, Citation2017; Gross, Citation2014). Research that takes the valence of emotions into account has found positive intrapersonal and interpersonal consequences for positive emotion expression as well (e.g., Chervonsky & Hunt, Citation2017; Nezlek & Kuppens, Citation2008). Expression of negative emotions also appears to have positive intrapersonal effects for the expresser: negative emotional expression helps coping with stressful life-events (Stanton & Low, Citation2012), decreases sympathetic activation of the cardiovascular system (Gross, Citation2014), and improves memory (Johns et al., Citation2008; Richards & Gross, Citation2000). Negative emotion expression may have these benefits for the expresser by reducing distress and facilitating insight (Kennedy-Moore & Watson, Citation2001).
The consequences of expressing negative emotions, however, are more mixed in the interpersonal context. On the one hand, expression of negative emotions solicits support, expands social networks, facilitates intimacy (Graham et al., Citation2008), and, in effect, leads to closer relationships with others (Baker et al., Citation2014; Srivastava et al., Citation2009). On the other hand, expressers of negative emotions are judged as less social, less popular (Sommers, Citation1984), and are liked less (Gross & John, Citation2003). A meta-analysis on the interpersonal effects of emotion expression (Chervonsky & Hunt, Citation2017) confirmed that the expression of negative emotions brings mixed interpersonal consequences (but the overall effect size indicated poor social outcomes in general of small magnitude, d = −.08; in contrast, d = .17 was found for the interpersonal consequences of positive emotion expression).
Taken together, emotion regulation researchers tend to conclude that the advantages of negative emotion expression outweigh its disadvantages (Graham et al., Citation2008; Gross, Citation2014). This reasoning is also popular in folk (Rodriguez, Citation2013) and clinical (Kennedy-Moore & Watson, Citation2001) discourse. Here, we suggest that the picture remains incomplete without also considering the consequences of negative emotion expression for the wider society of the expresser. Surprisingly, these extrapersonal consequences of negative emotion expression have received limited empirical attention in the emotion regulation literature (cf. Locke & Horowitz, Citation1990).
The double-edged sword of negative emotion expression
By adopting a multilevel approach, two seemingly contradictory effects of negative emotion expression on well-being – one from the emotion regulation literature, and the second from studies on cultures and emotional climates – can be combined into a single comprehensive model. We predict that the expression of negative emotions may simultaneously be associated with positive and negative consequences: positive for the expresser, but negative for society. Separating out the individual and societal (or the intrapersonal and extrapersonal, respectively) consequences of negative emotion expression allows for an examination of its potential ‘double-edged’ nature.
At least three other lines of research lend some initial support for our prediction that living in an NSEE may be associated with lower life satisfaction. First, research on emotional contagion documents that the expression of emotional states can lead others to experience the same emotions (Hatfield et al., Citation1993; Kramer et al., Citation2014). Therefore, living in an NSEE may foster negative emotions and impoverish life satisfaction, while living in a PSEE may foster positive emotions and promote life satisfaction. Second, expressed negative emotions can induce stress in observers and stressful stimuli have been shown to lower life satisfaction (Lazarus & Folkman, Citation1984). Third, research indicates that negative social interactions have a potent detrimental effect on well-being (Lincoln, Citation2000); these types of social interactions may be more common in NSEEs, which may lead to lower overall levels of life satisfaction.
The present study
The first goal of the current paper is to describe how the SEE varies across countries and cultural clusters. We attempt to replicate previous research that has found that some cultures are more emotionally expressive than others (e.g., Matsumoto et al., Citation2008), albeit we do so with data from a larger number of countries, and an expanded list of positive and negative emotions. The second goal is to investigate whether individual and societal differences in the degree to which positive and negative emotions are expressed matter for the well-being of individuals and societies. We hypothesize that even if negative emotion expressivity is good for the expresser, being a member of a society where negative emotions are frequently expressed will be associated with lower well-being. To test this hypothesis, we used two-level modelling to compare associations of negative emotion expression with life satisfaction at individual and societal levels of analysis (while also simultaneously comparing associations of positive emotion expression with life satisfaction at both levels of analysis). The two-level modelling let us also explore the cross-level interactions between SEE and expression of emotions on life satisfaction (we had no a priori formulated hypotheses on cross-level interactions).
Method
The current study was part of a larger cross-cultural investigation, which was approved by research ethics committees, of the cultural antecedents of happiness, family well-being, and the valuation of different types of well-being (see also Krys et al., Citation2020). Measures of frequency of experience and frequency of expression of 30 different emotions were included to study a society’s ‘emotional environment’ – we used these data to investigate our current research questions.
Participants and countries
We aimed to collect data in at least 40 countries. At the time of writing, our data set contained 12,888 participants from 49 countries from 10 cultural clusters (Gupta et al., Citation2002; House et al., Citation2004; Mensah & Chen, Citation2013): (1) Anglo (Australia, Canada, Ireland, United Kingdom, USA), (2) Latin Europe (France, Italy, Portugal, Romania), (3) Nordic Europe (Estonia, Iceland, Lithuania, Norway), (4) Germanic Europe (Austria, Germany, Luxembourg, Netherlands, Switzerland), (5) Eastern Europe (Croatia, Czech Republic, Georgia, Greece, Hungary, Poland, Russia, Serbia, Slovakia, Ukraine), (6) Latin America (Argentina, Brazil, Chile, Colombia, El Salvador, Guatemala, Mexico), (7) Sub-Saharan Africa (Ghana, Nigeria), (8) Middle East (Saudi Arabia, Turkey), (9) Southern Asia (Bhutan, Indonesia, Iran, Malaysia, Pakistan), and (10) Confucian Asia (China, Hong Kong, Japan, South Korea, Taiwan).Footnote2
As a rule of thumb, we aimed to recruit 200 individuals in each country (some authors, however, collected more and others collected fewer). A power analysis revealed that a total of 4,201 participants would have been sufficient in this research to obtain a desired power of .80 (for more details, see supplemental online material S1). Overall, 59.6% of participants identified as female, 39.3% as male, 0.4% as other, and 0.7% left the question about gender blank; the mean age of participants was 25.18 years (SD = 9.51). Due to convenience and budgetary restrictions, we mainly collected samples of post-secondary students, but some authors managed to complement their student sample with a general population sample. Table in the supplemental online material S2 contains demographic characteristics by country.
Measures
Participants separately assessed two characteristics of their emotions: frequency of experience and frequency of expression. Distinguishing between emotional experience and expression let us estimate the effect of emotional expression while controlling for emotional experience. Furthermore, because cultures vary in their intensity of emotion suppression/expression (Butler et al., Citation2007; Matsumoto et al., Citation2008; Wong et al., Citation2008), we could use the explicit judgments of emotional expression – averaged for each society separately – to estimate the actual characteristics of a society’s ‘emotional environment’.
The list of emotions we assessed was partially based on Tsai and collaborators’ (2006) Affect Valuation Index (AVI). Eleven items from the AVI were excluded because they were more related to affective arousal and less to emotional valence per se (i.e., strong, idle, aroused, rested, astonished, quiet, surprised, lonely, still, passive, and inactive). Another four items from the AVI that were directly associated with (un)happiness (i.e., content, happy, satisfied, and unhappy) were excluded as they were confounded with other measures that we included that were the main interest in this project (i.e., various forms of well-being). Thus, 15 AVI items were retained (i.e., calm, dull, elated, enthusiastic, euphoric, excited, fearful, hostile, nervous, peaceful, relaxed, sad, serene, sleepy, and sluggish). Next, we added 12 emotional feelings that are not listed in the AVI questionnaire, but which are commonly recognised and/or experienced across cultures: proud, in love, hopeful, respectful, grateful, depressed, bored, embarrassed, ashamed, hateful, angry, and disgusted (some of these feelings are recognised as basic emotions; Ekman, Citation1992). Because we incorporated emotional feelings described in the literature as being especially important in non-Western cultures (e.g., the Confucian triad: proud, embarrassed, respectful), we also included three feelings that are potentially important in dignity cultures (i.e., amused [Krys, Citation2010; Krys et al., Citation2017], self-confident [Scherer et al., Citation1973], and authentic [Smallenbroek et al., Citation2017]) to maintain a balanced approach. Thus, we formed a list of 30 emotional feelings that were sensitive to various cultural contexts and reflected the palette of important feelings for each contemporary society.
Participants rated the frequency of experiencing and expressing these emotions on a 1–9 Likert-type scale. We modified the approach of Kuppens et al. (Citation2008), whose emotion frequency scale ranged from 1 (not at all), through 5 (half the time), to 9 (all the time). Instead, we included the following response options as they refer to exact time periods and leave less room for ambiguity when responding: 1 (never), 2 (a couple of times a year), 3 (a couple of times a month), 4 (a couple of times a week), 5 (once a day), 6 (a couple of times a day), 7 (almost every single hour), 8 (a couple of times an hour), and 9 (all the time).
We grouped the emotion items into those of positive valence (i.e., enthusiastic, excited, elated, euphoric, calm, relaxed, peaceful, serene, amused, proud, in love, hopeful, respectful, grateful, self-confident, and authentic; average Cronbach’s alpha for experience = .90 and expression = .90; reliabilities in each country ≥ .75; see Table S1), and those of negative valence (i.e., sleepy, dull, sad, sluggish, fearful, nervous, hostile, depressed, bored, embarrassed, ashamed, hateful, angry, and disgusted; Cronbach’s alpha for experience = .91 and expression = .89; reliabilities in each country ≥ .81; see Table S1). All four emotion measures showed acceptable evidence of metric invariance across cultural clusters and metric isomorphism across levels of analysis in multilevel confirmatory factor analyses (see supplemental online material S3).
To assess potential consequences of emotional expression, we asked participants to report their subjective well-being. We used the Satisfaction With Life Scale (Diener et al., Citation1985; if available we relied on its previously validated translations; Cronbach’s alpha = .86; reliabilities in each country ≥ .71; see Table S1). Following Vignoles et al.’s (Citation2016) approach, participants rated items on a nine-point Likert-type scale with five labelled points: 1 (doesn’t describe me at all), 3 (describes me a little), 5 (describes me moderately), 7 (describes me very well), 9 (describes me exactly). Multilevel confirmatory factor analyses revealed acceptable evidence of metric invariance across cultural clusters and metric isomorphism across levels of analysis (see supplemental online material S3).
At the end of the questionnaire, we collected information on participants’ sociodemographic background (e.g., parental education, age, and gender); we control for these three sociodemographic variables in some analyses to test the robustness of our findings. Please see supplemental online materials S4 and S5 for a more detailed description of, and a link to, the full questionnaire.
Results
Mapping SEE across countries and cultural clusters
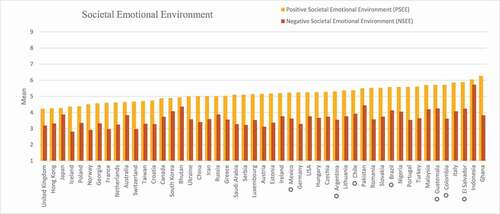
PSEE and NSEE scores were calculated by taking the average self-reported frequency of positive emotion expression and the average self-reported frequency of negative emotion expression, respectively, for each country. PSEE and NSEE scores for all 49 sampled countries are visualized in . Positive emotions appeared to be expressed more frequently than negative emotions across all countries, although this difference seemed to be smaller in some countries than others. There also appeared to be considerable variability in the degree to which positive and negative emotions were expressed across countries. For instance, those in countries with the lowest PSEE scores (e.g., United Kingdom, Hong Kong, Japan) reported expressing positive emotions only around ‘a couple of times a week’ on average, while those in countries with the highest PSEE scores (e.g., Ghana, El Salvador, Italy) reported expressing positive emotions around ‘a couple of times a day’ on average. Moreover, those in countries with the lowest NSEE scores (e.g., Iceland, Norway, Switzerland) reported expressing negative emotions only around ‘a couple of times a month’ on average, while those in countries with the highest NSEE scores (e.g., Pakistan, Bhutan, Guatemala) reported expressing negative emotions around ‘a couple of times a week’ on average. The Indonesian sample had an especially high NSEE scores that was more than four standard deviations from the mean of the rest of the countries. Because it was an extreme outlier, we excluded the Indonesian sample from all subsequent analyses in this paper.Footnote3 Lastly, there are hints in that the SEE might be more similar in countries that belong to the same cultural cluster. For instance, all the Latin American countries that we sampled were on the right side of (i.e., they had relatively high PSEE scores), while all the Confucian countries that we sampled were on the left side (i.e., they had relatively low PSEE scores).
Figure 1. Comparing mean positive societal emotional environment (PSEE) and negative societal emotional environment (NSEE) scores across countries. Countries are arranged from lowest mean PSEE scores (on the left) to highest mean PSEE scores (on the right). Higher PSEE and NSEE scores represent more frequent expression of positive emotions and more frequent expression of negative emotions, respectively. Latin American countries are marked with stars (✪).
To more formally test the veracity of the observations in the previous paragraph, we conducted a mixed-design ANOVA. Cultural cluster (Anglo vs. Latin Europe vs. Nordic Europe vs. Germanic Europe vs. Eastern Europe vs. Latin America vs. Sub-Saharan Africa vs. Middle East vs. Southern Asia vs. Confucian Asia) was included as the between-country factor and valence of emotion expression (positive vs. negative) was included as the within-country factor (see for descriptive statistics). Results revealed a significant effect of cultural cluster, F(9, 38) = 3.88, p = .001, = .479. Countries in the Latin America, Sub-Saharan Africa, and Southern Asia cultural clusters tended to be significantly more emotionally expressive than countries in the Anglo, Nordic Europe, Germanic Europe, Eastern Europe, and Confucian Asia cultural clusters (ps < .05). No other significant differences between cultural clusters were observed. Results also revealed a significant effect of the valence of emotion expression, F(1, 38) = 987.31, p < .001,
= .963, with positive emotions being more frequently expressed in general (M = 5.12, SD = 0.48) than negative emotions (M = 3.62, SD = 0.39). Finally, a significant interaction between cultural cluster and valence of emotion expression was found as well, F(9, 38) = 4.60, p < .001,
= .521. To help unpack this interaction, we calculated the difference between the PSEE and NSEE scores for each country so that we could compare the relative positivity of SEEs across cultural clusters (higher relative SEE scores represent more frequent expression of positive emotions compared to negative emotions; see column 4 of ). In general, the least relatively positive SEEs tended to be in countries in the Confucian Asia, Southern Asia, and Anglo cultural clusters, while the most relatively positive SEEs tended to be in countries in the Latin America, Nordic Europe, Germanic Europe, Latin Europe, Middle East, and Sub-Saharan Africa cultural clusters.
Table 1. Comparing cultural clusters on PSEE, NSEE, relative SEE, and societal life satisfaction
SEE and life satisfaction
Main analyses
To comprehensively investigate the potential effect of emotion expression at both the individual and societal levels while controlling for emotional experience (and sociodemographic characteristics), we conducted multilevel modeling. This allowed us to formally test our hypothesis that the individual-level benefit of expressing negative emotions would be reversed at the societal level. We were also able to examine how emotion expression at the societal level may moderate the effect of individual-level emotion expression through cross-level interaction. Life satisfaction was the criterion variable. Frequency of positive and negative emotion expression, and frequency of positive and negative emotion experience, were included as individual-level predictors and were grand-mean centered. Country-level averages of the frequency of positive emotion expression (PSEE scores) and negative emotion expression (NSEE scores) were centered by the mean of the country-level averages and were included as country-level predictors.Footnote4 The multilevel model was tested following the procedures recommended by Aguinis, Gottfredson and Culpepper (Citation2013). summarizes the results pertaining to all four steps in the model-testing, namely, null model, random intercept and fixed slope model, random intercept and random slope model, and cross-level interaction model. In the null model, the intra-class correlation (ICC) of life satisfaction was .124, meaning that cross-country differences account for about 12.4% of the variability in individuals’ life satisfaction. This value is comparable to those reported in other multilevel studies (see Aguinis et al., Citation2013).
Table 2. Multilevel model predicting life satisfaction from emotional experience and expression at the individual level, and societal emotional environment at the country level
Following the suggestion by Aguinis et al. (Citation2013), we used full information maximum likelihood (FIML) in the estimation so we could compare the relative fit between the random intercept and fixed slope model and the random intercept and random slope model (i.e., Step 2 and Step 3). As shown in , the model in Step 3 fits the data significantly better than the model in Step 2 (deviance of 43,385–43,314 = 71, p < .001), suggesting that there is significant variation in the relations between emotional expression and life satisfaction. In Step 4, we tested the cross-level interaction model, which showed that the interaction effects NSEE × individual-level negative emotion expression and PSEE × individual-level positive emotion expression are significant. These results indicated that at least some of the variation in the relations between individual emotional expression and life satisfaction is influenced by the societal emotional environment.
We also conducted a second analysis where we controlled for sociodemographics. Specifically, we included log transformed GDP per capita (centered by the mean of the country-level averages) as a country-level predictor, and age (grand-mean centered), gender (female = −0.5, male = 0.5), and parental education (both parents having higher education = 1, one parent only = 0, none = −1) as individual-level predictors. Results from these multilevel models are reported in . A slight difference in the null models in and 3 was noted because the model in excluded the sample from China as not all sociodemographic questions were administered to the Chinese participants. Nevertheless, the ICC of life satisfaction in this model was .127, which was highly similar to that in the first multilevel model.
Table 3. Multilevel model predicting life satisfaction from emotional experience and expression at the individual level, and societal emotional environment at the country level, controlling for sociodemographics
Results from both models supported previous findings on the intrapersonal benefits of expressing negative emotions. At the individual level of analysis, expression of negative emotions predicted higher life satisfaction, ps < .001. However, at the societal level, both models showed that living in a society where negative emotions are expressed more often predicted lower life satisfaction, ps < .01. Meanwhile, expressing positive emotions did not predict individuals’ life satisfaction in either model, ps > .10. Living in a society where positive emotions are expressed predicted higher life satisfaction, but this effect appeared stronger when sociodemographics were controlled for in the analysis.
As shown in , the results of both models are similar. The interaction effects between societal emotional environment and individual emotion expression on life satisfaction are plotted in based on the model that controls for sociodemographic variables. As shown in these figures, positive emotion expression became negatively related to life satisfaction in societies with high PSEE, whereas the positive association of negative emotion expression with life satisfaction became significantly stronger in societies with high NSEE.
Figure 2. Interaction between positive emotion expression and positive societal emotional environment (PSEE).
Figure 3. Interaction between negative emotion expression and negative societal emotional environment (NSEE).
Additional analyses
We construe the SEE as the average frequency of expression of positive and negative emotions in a given society. However, one may have concerns that country-level experience of emotions may need to be controlled for in the model. In other words, what is the effect of living in a societal environment where others experience more or less frequent positive or negative emotions, even if they do not express these emotions? For our main analyses, we assume that emotions need to be expressed to create a SEE, but in order to test this alternative reasoning we also carried out additional analyses with country-level frequency of emotional experience included in the models as Level 2 predictors. Although these additional analyses were burdened by problems with multicollinearity and therefore their results should be treated with caution, they still supported our hypotheses about negative emotion expression.Footnote5 Specifically, NSEE remained a significant predictor of lower life satisfaction and negative emotion expression at the individual level also remained a significant predictor of higher life satisfaction. PSEE, however, was not a significant predictor of higher life satisfaction in these additional analyses. For a full discussion on additional analyses, see supplemental online material S6.
Discussion
This paper introduces the concept of ‘societal emotional environment’ (SEE), and it describes the first large-scale study – involving participants from 49 countries – exploring the potential utility of the SEE in well-being studies. The current study hints that the examination of the SEE and its potential societal consequences may be a promising new area of well-being research. Up to now, positive psychologists have mainly studied positive and negative emotions as antecedents of life satisfaction for individuals (e.g., Chang et al., Citation2019; Kuppens et al., Citation2008). Although positive psychology and other fields recognise the concepts of emotional climate (e.g., of organisations, in a classroom) and group-level emotions, country-level characteristics of positive and negative emotionality have not been commonly considered as possible antecedents of societal or individual satisfaction. Our results suggest that the emotions people in our society frequently express, especially negative emotions, might matter for our sense of satisfaction. In the remainder of the discussion section we consider how a PSEE may help explain high levels of life satisfaction in Latin America, and how an NSEE may help us understand the complexity of how emotion regulation influences well-being.
PSEE may help explain high levels of satisfaction in Latin America
Top positions in various rankings of life satisfaction tend to be occupied by Western European and Latin American societies (e.g., Jasielska et al., Citation2018; Minkov et al., Citation2009 ; Veenhoven, Citation2009; also current study), but in contrast to Western European societies, Latin American societies tend to score low to moderate on major country-level predictors of societal well-being. In particular, Latin American countries are in the middle of the open society ranking (Krys et al., Citation2018), they are more collectivistic than individualistic (Minkov, Minkov et al., Citation2017), and they are not the richest societies (World Bank, Citation2017). Thus, none of the important qualities that are typically thought to facilitate societal well-being characterise Latin America.
What Latin American societies are known for, however, is their frequent and free expression of positive emotions (Ruby et al., Citation2012). Some describe high emotional expression, and in particular the expression of positive emotions, as a constitutive feature of Latin American cultures; through vibrant positive emotions Latin Americans connect and reinforce their social connections (Triandis et al., Citation1984). Our study confirmed that Latin American countries rank high on PSEE (see and ). Vibrant, intensive, and expressed positive emotions may make life in Latin America exceptionally satisfactory, and our study lends initial support to this explanation (although PSEE was admittedly not a significant predictor of life satisfaction in every model like NSEE was).
NSEE may bring a new perspective on emotion regulation processes
We replicated previous findings from emotion regulation literature that expressing negative emotions may improve the well-being of the expresser. Crucially, however, we also documented that negative emotion expression by others in one’s societal environment is associated with significantly lower well-being. By expanding our focus beyond the intra- and interpersonal consequences to the extra-personal consequences of emotion expression, we were able to test and find support for our proposed ‘double-edged sword’ model of negative emotion regulation. Depending on the level of analysis, negative emotion expression is simultaneously associated with positives (for the individual) and negatives (for others in society).
Our findings question the idea that expression of emotions is unambiguously beneficial; we show that (negative) emotion expression may carry more than minor negative consequences (c.f., Chervonsky & Hunt, Citation2017). We hope that this nuanced perspective on emotion expression finds its way into the emotion regulation literature, as well as in discourse in clinical, positive, and popular psychology more broadly. Moreover, while some research combines positive and negative emotion expression into one general factor of emotional expressivity (Gross & John, Citation2003; Srivastava et al., Citation2009), our results suggest that there is utility in studying the unique consequences of positive and negative emotion expression as PSEE and NSEE seem to carry different consequences for well-being.
Such complexity is highlighted by the significant cross-level interaction effects between individual emotion expression and SEE on life satisfaction. In particular, we note that in high SEE cultures, individual positive emotion expression is associated with decreased life satisfaction, while individual negative emotion expression is related to increased life satisfaction. These effects were observed when individual emotion experiences were kept statistically constant. SEEs suggest the display rules of emotion, which individuals living in that environment would learn through socialization. In high PSEE cultures, individuals are expected to express positive emotion regardless of their actual emotional experience, so the expression of positive emotion more likely represents an individual’s compliance to the display rule rather than their actual experience. In high NSEE cultures, the expression of negative emotion is more likely to be accepted as a norm, rather than a signal of norm violation (e.g., Hareli et al., Citation2015); consistency between emotional experience and response is likely to benefit an individual’s well-being (e.g., Brown et al., Citation2019).
A new argument in discussions on individual-group discontinuity of well-being
Lastly, this paper may contribute to discussions in positive psychology on individual-group discontinuity in predictors of well-being (Oishi, Citation2012; Steel et al., Citation2018), and to discussions in cross-cultural psychology on cultural isomorphism or homology (Alessandri et al., Citation2017; Fischer et al., Citation2010). For example, although Veenhoven (Citation2009) concluded that individual and societal values regarding well-being tend to be in harmony, other studies show that predictors of country-level life satisfaction and individual-level life satisfaction are different (Krys et al., Citation2018; Okulicz-Kozaryn et al., Citation2014). The current study provides a new example of individual-group discontinuity, with the opposite direction of associations (between well-being and a potential antecedent [i.e., negative emotion expression]) for individual and for country levels of analysis.
Limitations and future research
The current research increases understanding of the potential consequences of the emotional environment on well-being, but we must acknowledge its limitations and the need for further studies. Our findings rely on participants’ self-ratings of their emotion expression (and experience) and well-being; participants were asked to indicate the frequency with which they experience and express specific emotional states over time. Future research that includes different methods of recording such variables (e.g., other-ratings, experience sampling) could potentially strengthen conclusions about the relations found and minimize concerns about the (in)accuracy of retrospective judgments. Other discrete emotions not assessed in the current study (e.g., awe; Koh et al., Citation2019), and/or other aspects of emotional experience/expression beyond emotional valence (e.g., arousal) may lead to novel predictions and could be an important task for future research, as would examining emotional suppression in addition to emotional expression (Cameron & Overall, Citation2018). More refined conceptualization of the emotion measures would be desirable in future research too. Further research is also required to establish the causal role that positive and negative emotional environments may have on life satisfaction; the current research is only correlational. Our research is also limited by the fact that most of the samples consisted mainly of college/university students. Future studies need to cover more countries from regions that were underrepresented in our study (e.g., Africa and the Middle East). Finally, investigating the effect of PSEE and NSEE on other types of well-being (e.g., meaning in life, family well-being; Krys et al., Citation2019a, Citation2019b) could be another fruitful avenue for future research.
Final remarks
Our own happiness, fulfillment, and flourishing sometimes enhance and sometimes oppose the happiness, fulfillment, and flourishing of the people around us. With the current paper, we find partial evidence that the expression of positive emotions may enhance the life satisfaction of people around, with Latin American societies serving as an exemplar. In contrast, we show the ‘transactional’ nature between the well-being of ‘me’ and the well-being of others when negative emotions are expressed. Expression of negative emotions appears to benefit the expresser, but the NSEE it contributes to may detract from the happiness of people around.
Our study is another important argument (Krys et al., Citation2018; Radkiewicz & Skarżyńska, Citation2019) for the utility of adopting a societal (or more generally communal) perspective in the study of well-being. If we want to live in happy societies, in happy local communities, and in happy families, individuals might want to consider how their pathway to happiness impacts the people around them.
Supplemental Material
Download PDF (1,011.2 KB)Disclosure statement
No potential conflict of interest was reported by the authors.
Supplementary material
Supplemental data for this article can be accessed here
Additional information
Funding
Notes
1. Previous large cross-cultural studies have reported country-level averaged frequencies of positive or negative affect, but have treated them as dependent variables (i.e., instances of well-being; Diener, Tay, & Oishi, Citation2013) or approached them as person-level variables only (e.g., Kuppens et al., Citation2008).
2. Additional data from a Bulgarian sample were excluded from the current analyses as emotion measures were not administered in that sample. Also see supplemental online material S5 for exclusion criteria used in data screening.
3. When we re-ran analyses with Indonesian data included, the picture of results remained substantially the same.
4. Our reasoning behind centering decisions is described in the supplemental online material (S6). In supplementary analyses using alternative centering decisions, NSEE remained a significant negative predictor of life satisfaction in every model tested (see Tables S4 to S7 and S9 to S12).
5. Correlations between expression and experience of emotions reached r = .96 for positive emotions, and r = .92 for negative emotions at the country-level of analysis.
References
- Aguinis, H., Gottfredson, R. K., & Culpepper, S. A. (2013). Best-practice recommendations for estimating cross-level interaction effects using multilevel modeling. Journal of Management, 39(6), 1490–1528. https://doi.org/https://doi.org/10.1177/0149206313478188
- Alessandri, G., Cenciotti, R., Łaguna, M., Różycka-Tran, J., & Vecchione, M. (2017). Individual-level and culture-level self-esteem: A test of construct isomorphism. Journal of Cross-cultural Psychology, 48(9), 1328–1341. https://doi.org/https://doi.org/10.1177/0022022117722633
- Baker, L. R., McNulty, J. K., & Overall, N. C. (2014). When negative emotions benefit relationships. In G. S. Parrot (Ed.), The positive side of negative emotions (pp. 101–125). Guilford.
- Bennett, O. (2011). Culture of optimism. Cultural Sociology, 5(2), 301–320. https://doi.org/https://doi.org/10.1177/1749975511401270
- Berry, D., & Hansen, J. (1996). Positive affect, negative affect, and social interaction. Journal of Personality and Social Psychology, 71(4), 796–809. https://doi.org/https://doi.org/10.1037/0022-3514.71.4.796
- Brown, C. L., Van Doren, N., Ford, B. Q., Mauss, I. B., Sze, J. W., & Levenson, R. W. (2019). Coherence between subjective experience and physiology in emotion: Individual differences and implications for well-being. Emotion, 20(5), 818–829. Advance online publication.https://doi.org/https://doi.org/10.1037/emo0000579
- Busseri, M. (2018). Examining the structure of subjective well-being through meta-analysis of the associations among positive affect, negative affect, and life satisfaction. Personality and Individual Differences, 122, 68–71. https://doi.org/https://doi.org/10.1016/j.paid.2017.10.003
- Butler, E. A., Lee, T. L., & Gross, J. J. (2007). Emotion regulation and culture: Are the social consequences of emotion suppression culture-specific? Emotion, 7(1), 30–48. https://doi.org/https://doi.org/10.1037/1528-3542.7.1.30
- Cameron, L. D., & Overall, N. C. (2018). Suppression and expression as distinct emotion-regulation processes in daily interactions: Longitudinal and meta-analyses. Emotion, 18(4), 465–480. https://doi.org/https://doi.org/10.1037/emo0000334
- Chang, E., Chang, O., Li, M., Xi, Z., Liu, Y., Zhang, X., … Chen, X. (2019). Positive emotions, hope, and life satisfaction in Chinese adults: A test of the broaden-and-build model in accounting for subjective well-being in Chinese college students. The Journal of Positive Psychology, 14(6), 829–835. https://doi.org/https://doi.org/10.1080/17439760.2019.1579358 Advance online publication
- Chervonsky, E., & Hunt, C. (2017). Suppression and expression of emotion in social and interpersonal outcomes: A meta-analysis. Emotion, 17(4), 669–683. https://doi.org/https://doi.org/10.1037/emo0000270
- Diener, E., Diener, M., & Diener, C. (1995). Factors predicting the subjective well-being of nations. Journal of Personality and Social Psychology, 69(5), 851–864. https://doi.org/https://doi.org/10.1037/0022-3514.69.5.851
- Diener, E., Emmons, R., Larsen, R., & Griffin, S. (1985). The Satisfaction with Life Scale. Journal of Personality Assessment, 49(1), 71–75. https://doi.org/https://doi.org/10.1207/s15327752jpa4901_13
- Diener, E., Tay, L., & Oishi, S. (2013). Rising income and the subjective well-being of nations. Journal of Personality and Social Psychology, 104(2), 267–276. https://doi.org/https://doi.org/10.1037/a0030487
- Ekman, P. (1992). An argument for basic emotions. Cognition and Emotion, 6(3-4), 169–200. https://doi.org/https://doi.org/10.1080/02699939208411068
- Fischer, R., Vauclair, C.-M., Fontaine, J. R. J., & Schwartz, S. H. (2010). Are individual-level and country-level value structures different? Testing Hofstede’s legacy with the Schwartz value survey. Journal of Cross-cultural Psychology, 41(2), 135–151. https://doi.org/https://doi.org/10.1177/0022022109354377
- Garza, R. (1978). Affective and associative qualities in the learning styles of Chicanos and Anglos. Psychology in the Schools, 15(1), 111–115. https://doi.org/https://doi.org/10.1002/1520-680719780115:1
- Graham, S. M., Huang, J. Y., Clark, M. S., & Helgeson, V. S. (2008). The positives of negative emotions: Willingness to express negative emotions promotes relationships. Personality & Social Psychology Bulletin, 34(3), 394–406. https://doi.org/https://doi.org/10.1177/0146167207311281
- Gross, J. J. (2014). Emotion regulation: Conceptual and empirical foundations. In J. J. Gross (Ed.), Handbook of emotion regulation (pp. 3–20). Guilford Press.
- Gross, J. J., & John, O. P. (2003). Individual differences in two emotion regulation processes: Implications for affect, relationships, and well-being. Journal of Personality and Social Psychology, 85(2), 348–362. https://doi.org/https://doi.org/10.1037/0022-3514.85.2.348
- Gupta, V., Hanges, P. J., & Dorfman, P. (2002). Cultural clusters: Methodology and findings. Journal of World Business, 37(1), 11–15. https://doi.org/https://doi.org/10.1016/S1090-95160100070-0
- Hareli, S., Kafetsios, K., & Hess, U. (2015). A cross-cultural study on emotion expression and the learning of social norms. Frontiers in Psychology, 6, 1501. https://doi.org/https://doi.org/10.3389/fpsyg.2015.01501
- Harvey, S., Bimler, D., Evans, I., Kirkland, J., & Pechtel, P. (2012). Mapping the classroom emotional environment. Teaching and Teacher Education, 28(4), 628–640. https://doi.org/https://doi.org/10.1016/j.tate.2012.01.005
- Hatfield, E., Cacioppo, J., & Rapson, R. (1993). Emotional contagion. Current Directions in Psychological Sciences, 2(3), 96–99. https://doi.org/https://doi.org/10.1111/1467-8721.ep10770953
- Helliwell, J., Layard, R., & Sachs, G. (2019). World happiness report. SDSN.
- Hofstede, G., Hofstede, G., & Minkov, M. (2010). Cultures and Organizations: Software of the Mind. McGraw-Hill.
- Hornsey, M., Bain, P., Harris, E., Lebedeva, N., Kashima, E., Guan, Y., … Blumen, S. (2018). How much is enough in a perfect world? Cultural variation in ideal levels of happiness, pleasure, freedom, health, self-esteem, longevity, and intelligence. Psychological Science, 29(9), 1393–1404. https://doi.org/https://doi.org/10.1177/0956797618768058 Advance online publication
- House, R., Hanges, P., Javidan, M., Dorfman, P., & Gupta, V. (Eds.). (2004). Culture, leadership, and organizations: The GLOBE study of 62 societies. Sage.
- Jasielska, D., Stolarski, M., & Bilewicz, M. (2018). Biased, therefore unhappy: Disentangling the collectivism-happiness relationship globally. Journal of Cross-cultural Psychology, 49(8), 1227–1246. https://doi.org/https://doi.org/10.1177/0022022118784204
- Johns, M., Inzlicht, M., & Schmader, T. (2008). Stereotype threat and executive resource depletion: Examining the influence of emotion regulation. Journal of Experimental Psychology. General, 137(4), 691–705. https://doi.org/https://doi.org/10.1037/a0013834
- Kennedy-Moore, E., & Watson, J. C. (2001). How and when does emotional expression help? Review of General Psychology, 5(3), 187–212. https://doi.org/https://doi.org/10.1037//1089-2680.5.3.187
- Koh, A., Tong, E., & Yuen, A. (2019). The buffering effect of awe on negative affect towards lost possessions. The Journal of Positive Psychology, 14(2), 156–165. https://doi.org/https://doi.org/10.1080/17439760.2017.1388431
- Kramer, A., Guillory, J., & Hancock, J. (2014). Experimental evidence of massive-scale emotional contagion through social networks. Proceedings of the National Academy of Sciences of the United States of America, 111, 8788–8790. https://doi.org/https://doi.org/10.1073/pnas.1320040111
- Krys, K. (2010). May amusement serve as a social courage engine? Polish Psychological Bulletin, 41(2), 67–73. https://doi.org/https://doi.org/10.2478/v10059-010-0009-z
- Krys, K., Capaldi, C. A., Zelenski, J. M., Park, J., Nader, M., Kocimska- Zych, A., … Uchida, Y. (2019a). Family well-being is valued more than personal well-being: A four-culture study. Current Psychology. Advance Online Publication.https://doi.org/https://doi.org/10.1007/s12144-019-00249-2
- Krys, K., Park, J., Kocimska-Zych, A., Kosiarczyk, A., Selim, H. A., Wojtczuk-Turek, A., … &Adamovic, M., & . (2020). Personal life satisfaction as a measure of societal happiness is an individualistic presumption: Evidence from fifty countries. Journal of Happiness Studies, Advance online publication.https://doi.org/https://doi.org/10.1007/s10902-020-00311-y
- Krys, K., Uchida, Y., Oishi, S., & Diener, E. (2018). Open society fosters satisfaction: Explanation to why individualism associates with country level measures of satisfaction. The Journal of Positive Psychology, 14(6), 768–778. Advance online publication.https://doi.org/https://doi.org/10.1080/17439760.2018.1557243
- Krys, K., Vauclair, M., Capaldi, C., Lun, V. M.-C., Bond, M. H., Dominguez-Espinosa, A., … Yu, A. (2016). Be careful where you smile: Culture shapes judgments of intelligence and honesty of smiling individuals. Journal of Nonverbal Behavior, 40(2), 101–116. https://doi.org/https://doi.org/10.1007/s10919-015-0226-4
- Krys, K., Xing, C., Zelenski, J. M., Capaldi, C. A., Lin, Z., & Wojciszke, B. (2017). Punches or punchlines? Honor, face, and dignity cultures encourage different reactions to provocation. Humor, 30(3), 303–322. https://doi.org/https://doi.org/10.1515/humor-2016-0087
- Krys, K., Zelenski, J. M., Capaldi, C. A., Park, J., van Tilburg, W., van Osch, Y., … Uchida, Y. (2019b). Putting the “we” into well-being: Using collectivism-themed measures of well-being attenuates well-being’s association with individualism. Asian Journal of Social Psychology, 22(3), 256–267. https://doi.org/https://doi.org/10.1111/ajsp.12364 Advance online publication
- Kuppens, P., Realo, A., & Diener, E. (2008). The role of positive and negative emotions in life satisfaction judgment across nations. Journal of Personality and Social Psychology, 95(1), 66–75. https://doi.org/https://doi.org/10.1037/0022-3514.95.1.66
- Lazarus, R., & Folkman, S. (1984). Stress, appraisal, and coping. Springer.
- Lincoln, K. (2000). Social support, negative social interactions, and psychological well-being. Social Service Review, 74(2), 231–252. https://doi.org/https://doi.org/10.1086/514478
- Locke, K. D., & Horowitz, L. M. (1990). Satisfaction in interpersonal interactions as a function of similarity in level of dysphoria. Journal of Personality and Social Psychology, 58(5), 823–831. https://doi.org/https://doi.org/10.1037/0022-3514.58.5.823
- Matsumoto, D., Yoo, S. H., & Nakagawa, S., & 37 members of MSCDR. (2008). Culture, emotion regulation, and adjustment. Journal of Personality and Social Psychology, 94(6), 925–937. https://doi.org/10.1037/0022-3514.94.6.925
- Mensah, Y. W., & Chen, H.-Y. (2013). Global clustering of countries by culture – An extension of the GLOBE study. Rutgers University. SSRN. http://ssrn.com/abstract=2189904
- Minkov, M. (2009). Predictors of differences in subjective well-being across 97 nations. Cross-Cultural Research, 43, 152–179. https://doi.org/https://doi.org/10.1177/1069397109332239
- Minkov, M., Dutt, P., Schachner, M., Morales, O., Sanchez, C., Jandosova, J., … Mudd, B. (2017). A revision of Hofstede’s individualism-collectivism dimension: A new national index from a 56-country study. Cross Cultural & Strategic Management, 24(3), 386–404. https://doi.org/https://doi.org/10.1108/CCSM-11-2016-0197
- Nam, Y., Kim, Y.-H., & Tam, K. K.-P. (2018). Effects of emotion suppression on life satisfaction in Americans and Chinese. Journal of Cross-cultural Psychology, 49(1), 149–160. https://doi.org/https://doi.org/10.1177/0022022117736525
- Nezlek, J. B., & Kuppens, P. (2008). Regulating positive and negative emotions in daily life. Journal of Personality, 76(3), 561–580. https://doi.org/https://doi.org/10.1111/j.1467-6494.2008.00496.x
- Oishi, S. (2012). The psychological wealth of nations: Do happy people make a happy society. John Wiley.
- Okulicz-Kozaryn, A., Holmes, O., & Avery, D. R. (2014). The subjective well-being political paradox: Happy welfare states and unhappy liberals. The Journal of Applied Psychology, 99(6), 1300–1308. https://doi.org/https://doi.org/10.1037/a0037654
- Peñalver, J., Salanova, M., Martínez, I., & Schaufeli, W (2019). Happy-productive groups: How positive affect links to performance through social resources. The Journal of Positive Psychology, 14, 377-392. doi: https://doi.org/10.1080/17439760.2017.1402076
- Radkiewicz, P., & Skarżyńska, K. (2019). Freedom, freedom, but what kind of freedom? Intrinsic and extrinsic sense of freedom as predictors of preferences for political community and attitudes towards democracy. Social Psychological Bulletin, 14(3), 1–27. https://doi.org/https://doi.org/10.32872/spb.v14i3.37565
- Richards, J. M., & Gross, J. J. (2000). Emotion regulation and memory: The cognitive costs of keeping one’s cool. Journal of Personality and Social Psychology, 79(3), 410–424. https://doi.org/https://doi.org/10.1037/0022-3514.79.3.410
- Rodriguez, T. (2013). Negative emotions are key to well-being. Scientific American Mind, 24(2), 26–27. https://doi.org/https://doi.org/10.1038/scientificamericanmind0513-26
- Ruby, M., Falk, C., Heine, S., Villa, C., & Silberstein, O. (2012). Not all collectivisms are equal: Opposing preferences for ideal affect between East Asians and Mexicans. Emotion, 12(6), 1206–1209. https://doi.org/https://doi.org/10.1037/a0029118
- Scherer, K. R., London, H., & Wolf, J. J. (1973). The voice of confidence: Paralinguistic cues and audience evaluation. Journal of Research in Personality, 7(1), 31–44. https://doi.org/https://doi.org/10.1016/0092-65667390030-5
- Smallenbroek, O., Zelenski, J. M., & Whelan, D. C. (2017). Authenticity as a eudaimonic construct: The relationships among authenticity, values, and valence. The Journal of Positive Psychology, 12(2), 197–209. https://doi.org/https://doi.org/10.1080/17439760.2016.1187198
- Sommers, S. (1984). Reported emotions and conventions of emotionality among college students. Journal of Personality and Social Psychology, 46(1), 207–215. https://doi.org/https://doi.org/10.1037/0022-3514.46.1.207
- Srivastava, S., Tamir, M., McGonigal, K. M., John, O. P., & Gross, J. J. (2009). The social costs of emotional suppression: A prospective study of the transition to college. Journal of Personality and Social Psychology, 96(4), 883–897. https://doi.org/https://doi.org/10.1037/a0014755
- Stanton, A. L., & Low, C. A. (2012). Expressing emotions in stressful contexts: Benefits, moderators, and mechanisms. Current Directions in Psychological Science, 21(2), 124–128. https://doi.org/https://doi.org/10.1177/0963721411434978
- Steel, P., Taras, V., Uggerslev, K., & Bosco, F. (2018). The happy culture: A theoretical, meta-analytic, and empirical review of the relationship between culture and wealth and subjective well-being. Personality and Social Psychology Review, 22(2), 128–169. https://doi.org/https://doi.org/10.1177/1088868317721372
- Triandis, H., Marin, G., Lisansky, J., & Betancourt, H. (1984). Simpatía as a cultural script of Hispanics. Journal of Personality and Social Psychology, 47(6), 1363–1375. https://doi.org/https://doi.org/10.1037/0022-3514.47.6.1363
- Tsai, J. L., Knutson, B., & Fung, H. H. (2006). Cultural variation in affect valuation. Journal of Personality and Social Psychology, 90(2), 288–307. https://doi.org/https://doi.org/10.1037/0022-3514.90.2.288
- Veenhoven, R. (2009). Well-being in nations and well-being of nations. Social Indicators Research, 91(1), 5–21. https://doi.org/https://doi.org/10.1007/s11205-008-9323-7
- Vignoles, V. L., Owe, E., Becker, M., Smith, P. B., Easterbrook, M. J., Brown, R., … Bond, M. H. (2016). Beyond the ‘East West’ dichotomy: Global variation in cultural models of selfhood. Journal of Experimental Psychology. General, 145(8), 966–1000. https://doi.org/https://doi.org/10.1037/xge0000175
- Wojciszke, B. (2005). The negative social world: The Polish culture of complaining. International Journal of Sociology, 34(4), 38–59. https://doi.org/https://doi.org/10.1080/00207659.2004.11043140
- Wong, S., Bond, M. H., & Rodriguez Mosquera, P. M. (2008). The influence of cultural value orientations on self-reported emotional expression across cultures. Journal of Cross Cultural Psychology, 39(2), 224–229. https://doi.org/https://doi.org/10.1177/0022022107313866
- World Bank (2017). GDP per capita, PPP (current international $). International Comparison Program [Database]. https://data.worldbank.org/indicator/NY.GDP.PCAP.PP.CD