
 ?Mathematical formulae have been encoded as MathML and are displayed in this HTML version using MathJax in order to improve their display. Uncheck the box to turn MathJax off. This feature requires Javascript. Click on a formula to zoom.
ABSTRACT
Poverty exists not only in low and middle-income countries but also in high-income countries. Brunei, a rich country heavily reliant on hydrocarbon in Southeast Asia, is not an exception. Though poverty is not a topic that is politically taboo in Brunei, there are no statistics on poverty in Brunei. Yet, having such statistics would aid the government to achieve the target of zero poverty in 2035. Therefore, this technical paper provides a pioneering estimation of poverty rates in Brunei, utilising published data from ‘Household Expenditure Surveys’ and focusing on the basic need approach. It calculates monthly household poverty rates based on the World Bank’s poverty lines and OECD median income approach. It produces poverty rates based on expenditure and income. The research employs two models: a proportional model and a refined model. The results show declining rates of poverty, regardless of the poverty lines and models.
Introduction
Poverty is a pervasive issue not only in low- and middle-income countries but also in high-income countries, as noted by Atkinson (Citation2019). Ending poverty is a primary concern in development everywhere, as reflected in the first sustainable development goal to eradicate poverty in all its forms (United Nations, Citation2017). However, the poor are often left behind as they lack choices and development opportunities. During times of crisis, they are often the ones who suffer the most, especially with the inability to buy food and other basic needs, as observed by Ananta and Barichello (Citation2012) in Southeast Asia.
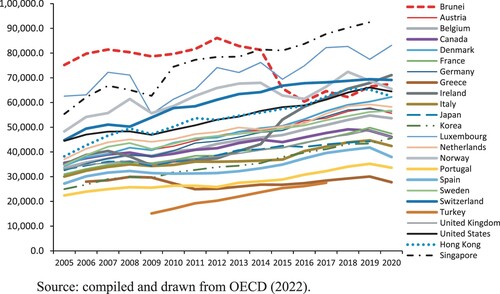
Nevertheless, several high-income countries, such as Singapore, Australia, and Canada, do not disclose poverty statistics (Atkinson, Citation2019). Likewise, Brunei – a Sultanate with the second-highest per capita income and Human Development Index (HDI) in Southeast Asia and the highest per capita Gross National Income (GNI) among OECD countries between 2005 and 2020 () – does not have statistics on poverty. Neither do international institutions such as the United Nations, World Bank, and Asian Development Bank (ADB) produce statistics on poverty in Brunei.
Figure 1. Brunei Per Capita GNI at current value among Selected OECD Countries: 2005–2020, Source: compiled and drawn from OECD (Citation2022).
Demographically, Brunei is distinct in Southeast Asia with just a little higher than 440 thousand people (Department of Economic Planning and Statistics/DEPS, Ministry of Finance and Economy, Citation2022). This makes Brunei the least populated country in Southeast Asia. The population is composed of more males than females, with a sex ratio of 1.113 in 2021. Like many other countries, Brunei has entered its low fertility regime, below replacement level of fertility since the turn of the twenty-first century, and benefitted from high life expectancy (Ahmad, Citation2022). Age-sex population structure has shifted toward an ageing population (Arifin & Ahmad, Citation2023; Azim, Citation2002). Population aged 60 years and above accounted for 10.1 per cent. However, the country's reliance on international migrants, who make up approximately 18.4 per cent of the population in 2021, helps to offset this trend (DEPS, Ministry of Finance and Economy, Citation2022).
Despite efforts to diversify the country's sources of income, Brunei's economy remains heavily dependent on hydrocarbons. The government is very generous to the citizens by providing free health care and education. Gasoline and utilities such as water and electricity are also heavily subsidised. The government also provides a national housing scheme for citizens who need it (Abdullah, Citation2015; Hamdan & Hoon, Citation2019).
In recent years, the country has attempted to gradually shift from a welfare system toward a self-reliant community by empowering people to be less dependent on the government. The welfare system aims to alleviate the hardships of citizens or residents in need to secure an adequate source of income and become economically self-reliant (Ministry of Finance and Economy, Government of Brunei Darussalam, Citation2020). Despite these efforts, the COVID-19 pandemic has led to a sharp increase in the number of Bruneians requiring social assistance, as well as an increase in the number of applicants seeking such assistance (Bandial, Citation2021).
The word ‘poverty’ is not taboo in the Sultanate, as described in Othman (Citation2008). The Sultan has expressed his thoughts on achieving zero poverty in the country. In his ‘titah’ (royal speech) at the opening ceremony of the first meeting of the fourth session of the Legislative Council in 2008, the monarch stated that one of the aspirations of Brunei’s 2035 vision is to achieve zero poverty, which he believes that the country is capable of achieving. The term ‘poverty’ (kemiskinan in the local language) has then been used and discussed in official documents such as meeting reports of the parliament. Furthermore, as an Islamic country, Brunei sees poverty through the lens of social justice (Bashir & Haji Ali, Citation2012).
The statistics on poverty are crucial for the development agenda as it helps to maintain the visibility of the poor, identifies and monitors the poor, and evaluates the effectiveness of relevant institutions and programmes designed to assist the poor (Haughton & Khandker, Citation2009). Hence, the lack of statistics on poverty in Brunei, as argued by Gweshengwe and Hassan (Citation2019), may hamper the achievement of zero poverty in the Brunei Vision of 2035. This paper aims to address this lack of statistics by producing the first statistics on poverty in Brunei using internationally recognised poverty lines. These statistics are expected to provide better information in making public policies on poverty and welfare in Brunei.
Given the various conceptualisations and measurements of poverty (Atkinson, Citation2019; Haughton & Khandker, Citation2009; Sen, Citation2000), this paper focuses on the basic needs approach to calculate poverty rates in Brunei. While there are other approaches, such as the subjective poverty and the capability approach, these fall outside the scope of this paper. By adopting a basic needs approach and producing poverty statistics that can be compared globally, this paper aims to provide a more comprehensive understanding of poverty in Brunei, and facilitate evidence-based policy-making. This paper calculates four statistics on poverty lines using three World Bank poverty lines (World Bank, Citation2020) and one OECD poverty line (OECD, Citation2022). For each poverty line, two estimates of poverty rates are calculated using different measurement models. Ideally, the best method for calculating poverty rates is to work with raw data collected from household surveys, as has been done in other countries such as Malaysia (Nair & Sagaran, Citation2015) and the US (Nelson, Citation2011). However, due to the lack of access to raw data, this paper uses the second-best method, utilising published data from Household Expenditure Surveys conducted by the Department of Economics and Statistics in three rounds (2005, 2010, 2015). Therefore, some assumptions are employed in the calculation of the statistics. The calculated poverty rates are referred to as monthly household poverty rates.
The following section discusses the poverty line measurement in low, middle, and high-income countries, as well as the use of income and expenditure in measuring poverty. Section 3 focuses on data and methods. Section 4 analyses the monthly household income and expenditure distribution. Section 5 calculates the poverty rates. The paper concludes that Brunei's poverty rate has been declining regardless of the concepts and statistics used.
Poverty lines
Setting the poverty line may depend on how poverty is conceptualised. There are several approaches to measuring poverty. The first sees poverty as an inability to fulfil basic needs. The second considers poverty as a lack of political participation and a subjective issue. The third views poverty as capability deprivation. Finally, the fourth approach focuses on escaping poverty as a human right (Atkinson, Citation2019).
This present paper focuses on the first approach, the basic needs approach. This is the most commonly used criterion of the poverty line. Other approaches, while important, are beyond the scope of this paper. The basic need approach is very dominant in measuring and comparing poverty worldwide, especially in low and middle-income countries (Nair & Sagaran, Citation2015). Basic needs are often related to the basic nutritional requirement for an individual to survive, usually related to the daily calorie requirement per person. The World Bank uses this approach for cross-country comparisons, especially among low and middle-income countries. The OECD focuses on 50 per cent of the median disposable household income as the poverty line in high-income countries.
Low and middle-income countries
The cost of the basic need is estimated at 2,100 calories per day per person (Haughton & Khandker, Citation2009). The daily nutritional requirement is then converted to a monetary value. The non-food budget is also taken into account. The summation of food and non-food cost determines the poverty line, under which individuals are considered poor. As it is not easy to determine non-food consumption, the value of daily consumption may be used to set the poverty line.
Therefore, the poverty line refers to the appropriate bundle of goods and services cost. The cost varies by group. A different group may have different tastes in foods and other consumption. For example, people in urban areas may consume more non-food than people in rural areas.
Basic needs are also dynamic, as they change over time, depending on activities, aspirations, and different baskets of goods and services. (Buddelmeyer & Cai, Citation2009; Clarke & Erreygers, Citation2020). Moreover, basic needs vary by age, sex, and daily activities, although most statistics do not reflect such variations. The choice of commodities in the measurement can be debatable, and it changes from time to time to adjust to societal changes and lifestyles.
Therefore, to allow for international comparability, the World Bank has been using ‘One dollar per person per day’ adjusted with purchasing power parity (PPP) in different countries since the early 1990s to determine poverty lines. While these poverty lines have received great attention from those concerned with development issues, there are still limitations to these poverty lines (Booth, Citation2019).
Since 2015, the World Bank has recommended using USD1.90 per person per day to calculate the poverty line in each country after adjusting to the 2011 PPP. This poverty line measures extreme poverty, which is often found in low-income countries. As many countries have developed economically, the World Bank (Citation2020) introduced two other poverty lines in 2018: USD3.2 per capita per day for low-middle-income countries and USD5.5 per capita per day for upper-middle-income countries.
High-income countries
To address poverty in high-income countries, the EU has developed a poverty line to measure the ‘risk of poverty or social exclusion’. People are considered at ‘risk of poverty, after social transfer’ if their disposable income is below 60.0 per cent of the median national household disposable income. They are socially excluded if they are severely materially deprived or live in a household with low work intensity.Footnote1 In contrast, the OECD (Citation2022) uses the poverty line as half of the median household income.
Both the EU and OECD poverty lines are subject to change over time, depending on changes in the country’s income level. The estimated poverty rate resulting from these poverty lines is often referred to as relative poverty. This is distinct from the World Bank poverty line, which remains constant over time, and its variation is merely due to changes in currency rates across time.
Income or consumption
Determining whether to use income or consumption to measure basic needs is a challenging task. Income refers to the potential of spending but excludes transfers from family, community, and state. On the other hand, consumption measurement includes transfer from family, community, and government. However, measuring consumption may not accurately reflect a person’s welfare since a wealthy individual may lead a simple lifestyle. Conversely, a household may be considered poor by income but not by expenditure if transfers from the state, community, and family are taken into account. Measuring the consumption of durable goods such as cars and houses is also complicated as it includes depreciation and imputed rents.
In Brunei, transfers from family, community or civil society, and the government play a crucial role. Therefore, it is necessary to exclude these transfers when estimating poverty, especially those from the state. For instance, suppose we consider a household with three children. According to the criteria set by Majelis Ugama Islam Brunei Darussalam or MUIB (Islamic Religious Council of Brunei Darussalam), their monthly basic needs are BND805. If their household income is only BND500, then they would be classified as poor. However, the state provides BND305 to bridge the gap, so the family is no longer poor. This means that although the household’s income is low, they are not deprived in terms of consumption.
Moreover, the choice between using income or consumption to measure basic needs often depends on the data availability. For example, Indonesia uses consumption since the data are available in its regular national social-economic survey and national labour force survey. Meanwhile, the World Bank employs consumption as a basis to depict living standards. On the other hand, income is a preferred measurement in Malaysia, the EU, and many Latin American and Caribbean countries due to their regular surveys on income (Atkinson, Citation2019). In Brunei, both income and consumption data may be utilised, but considering the significant transfers, expenditure may be a better indicator of people’s welfare.
Another issue to consider when measuring poverty is whether to base the measurement on an individual or household/ family level. In Brunei, which has an extended family system (Hajah Sainah binti Haji Saim, Citation2010), a household/ family level is likely more suitable since household/family members may provide assistance to each other, and living arrangements may determine shared welfare within the household. Additionally, transfer and non-monetary support may take place across households in such a system.
Data and methods
Data
The paper relies on the published data from the Household Expenditure Surveys serving as the database for the empirical analysis, collected by the Department of Economic Planning and Statistics, Brunei Darussalam. The survey is a nationally representative survey repeated every five years. The poverty rates in this study are estimated using data from three surveys conducted in 2005, 2010, and 2015 (Department of Statistics, Department of Economic Planning and Statistics (Citation2008, Citation2013, Citation2019). The latest survey that was supposed to be conducted in 2020/2021 was not available at the time this study was conducted. Moreover, its results may be severely affected by the COVID-19 pandemic.
Data collection covering all four districts was undertaken over a year for the same period, from 1 April to 31 March, for each survey. For example, the survey in 2005 was implemented from 1 April 2005 until 31 March 2006. This duration was selected to capture the seasonal variation due to festive months and to improve data quality. The sample only selected private households and excluded individuals permanently residing in hostels, correctional establishments, military camps, and those living in seasonal dwellings and at their work sites.
In order to select the households for this study, a two-stage stratified random sampling technique had been used, with a response rate of around 79.0 per cent. The first stage involved selecting geographical units with probabilities proportional to their size. In the second stage, systematic random sampling was utilised to select the households. More detailed information about the sampling process can refer to the Department of Statistics, Department of Economic Planning and Development (Citation2008, Citation2013, Citation2019). The published results were presented as weighted figures. The weighted number of households for each survey is as follows 59,900 households in 2005, which increased to 66,000 households in 2010 and 67,966 households in 2015.
The survey was comprehensive in nature and collected various details related to income and expenditure information such as mean and median values of household income and expenditure, income and expenditures brackets, household sizes, number of working persons, age group of household head, the economic activity status of the household head, employment status, occupation type, and highest education. However, the household distribution by income or expenditure brackets for other variables was not publicly available. As a result, this study relies on the published data on the household distribution, average and median monthly household income or expenditure by income or expenditure brackets as presented in and .
Table 1. Monthly Household Income by Income Bracket.
Table 2. Monthly Household Expenditure by Expenditure Bracket.
Methods
The process of measuring poverty involves two sequences: setting up the poverty line, and measuring the poverty rate. As the available published data are on monthly household income/expenditure, the resulting calculation is monthly household poverty lines based on income or expenditure. The poverty rate refers to the proportion of households that are below the poverty line.
Calculation of monthly household poverty lines
To calculate monthly household poverty lines (MHPLs), this study employs four existing standardised poverty lines. Three poverty lines follow the World Bank (Citation2020) criteria: USD1.9 per capita per day for low-income countries (LICs), USD3.2 per capita per day for low-middle-income countries (LMICs), and USD5.5 per capita per day for upper-middle-income countries (UMICs). The USD1.9 is an updated poverty line known as the extreme poverty line. The fourth poverty line follows OECD (Citation2022) criteria for high-income countries, which uses 50 per cent of the median household income as the poverty line. It is worth noting that Brunei is a high-income country, with its per capita GNI in 2020 slightly above the US and Norway (as illustrated in ).Footnote2
Since the available income and expenditure data are at the household level (as shown in and ), the aforementioned poverty lines, which are measured per person per day, need to be converted into per household per month in Brunei dollars (BND). This conversion is conducted for all three poverty lines.
First, the poverty line is converted into Brunei dollars using the currency rate for the corresponding year.Footnote3 Second, the poverty line is multiplied by 30 assuming that a month contains 30 days. Finally, the average number of household members for the respective year is used to multiply the monthly per capita.
In sum, the monthly household poverty lines (MHPLs) are calculated as follows:
(1)
(1) Where MHPLt = Monthly Household Poverty Line at time t (2005, 2010 and 2015), CRt = Currency rate at time t. HMt = mean of household members at time t. Therefore, there are nine MHPLs consisting of three lines for each year.
The fourth poverty line requires information on both median household income and expenditure. This paper, in accordance with OECD, uses 50 per cent of the median national household disposable income as the poverty line. As there is no tax on individual income, the reported income is almost similar to disposable income. At the national level, the difference between median monthly household income and disposable income is negligible, amounting to only BND50. Since the published data on income and expenditure are already expressed in BND and measured at the household per month, no conversion is necessary to set the MHPLs based on the medians.
Estimation of monthly household poverty rates
The monthly household poverty rate (MHPR) is calculated by the so-called headcount index's most straightforward and best-known poverty measurement. Its calculation starts with calculating the number of households whose monthly income or expenditure falls below the poverty line. The headcount is then calculated as the relative share of those falling below the poverty line to the total population.
(2)
(2) Where i refers to income/expenditure brackets 1,2,3, … , 11. Referring to and , i = 1 refers to household with monthly income/expenditure below BND1000, i = 2 to BND1000 - 1999, i = 3 to BND2000 - 2999, … , i = 11 to BND10,000 and over. Yi refers to the mean monthly household income/expenditure for bracket i. N is the number of households, q is the number of poor households, and MHPL is the Brunei monthly household poverty line. The value of α is used to determine the type of poverty measurement, where α = 0 refers to the headcount index (P0), α = 1 refers to the poverty gap (P1), and α = 2 refers to the severity index (P2).
Ideally, the three types of poverty rates should be calculated. Nevertheless, due to limited data, this paper only estimates the headcount index (P0). The poverty rate is then calculated based on the disaggregation of monthly household income and expenditure.
There are two models to estimate the poverty rates using an interpolation approach. Model 1 assumes equal distribution (proportional) at each income or expenditure bracket. Model 2 is refined, incorporating information on the median in each income or expenditure bracket to the first model.
Model 1. When the monthly household poverty line (MHPL) falls in the first income or expenditure bracket (i = 1), the headcount index or poverty rate (hereafter POV) formula is as follows
(3)
(3) Because the minimum value of the first bracket is zero and the maximum interval is 999, for convenience, it is rounded up to 1000, and the poverty rate becomes
(4)
(4) Where p1 is the percentage of households in the first income or expenditure bracket, and t refers to the year.
For an illustration, the monthly household poverty rate calculation uses the converted 2015 MHPL of USD1.9, which is BND494.2 per month per household (). Referring to , this MHPL falls in the first income bracket (< BND1,000). That means the minimum poverty rate is 0 per cent, and the maximum poverty rate is 2.1 per cent. The range of the income bracket is BND1,000. Therefore, the monthly household poverty rate based on the 2015 income is 1.0 per cent, calculated as 2.1 per cent multiplied by (494.2 / 1000).
The formula is slightly different when the poverty rate falls in the next income or expenditure brackets.
(5)
(5) Where pi refers to the percentage of households at bracket i, and t is year.
As shown in , the 2015 MHPL of USD5.5 per capita per day is converted into BND1,430.5 per month per household. indicates that this MHPL falls in the second income bracket (BND1,000 to BND2,000). Therefore, the minimum poverty rate is 2.1 per cent (the lower border of the second income bracket), and the maximum poverty rate is 9.7 per cent. The maximum poverty rate is the cumulative percentage of households from the first and second-income brackets. Then, using EquationEquation 5(5)
(5) , the monthly household poverty rate based on the 2015 income is 2.1 per cent + 7.6 per cent × (1,430.5–1,000) / 1,000 = 5.4 per cent.
Model 2. This model is a more refined estimate that considers the median in each income or expenditure bracket. Median divides 50–50 distribution, meaning 50 per cent falls below the median value and 50 per cent above it within each bracket. When the poverty line is lower than the median of the i bracket, the poverty rate is
(6)
(6) When the poverty line is higher than the median of the i bracket, the poverty rate is
(7)
(7) Where pi refers to the proportion of households at i, and t is year.
To demonstrate the calculation of poverty rates using the refined method, the MHPL of BND494.2 per month per household in 2015 is used. This poverty line falls in the first income bracket (< BND1,000), with a minimum poverty rate is 0 per cent, and a maximum poverty rate is 2.1 per cent using the equal distribution method. The refined model considers the median income of each income bracket. Because the MHPL falls within the first income bracket, we take into account the median first income bracket (BND740). Since the MHPL is lower than the median first income bracket, the minimum poverty rate remains at 0 per cent, but the maximum poverty rate is calculated as = 50 per cent × 2.1 per cent = 1.05 per cent. Therefore, EquationEquation 6
(6)
(6) is used and the calculated monthly household poverty rate by income is 1.05 per cent × (494.2 / 740) = 0.7 per cent.
Using the refined model, we can illustrate the calculation of poverty rate using the 2015 converted MHPL of USD5.5, which is equivalent to the MHPL of BND1,430.5 (). This line falls in the second income bracket (BND1,000 – BND2,000) and the median for this bracket is BND1,496 (), which is higher than the MHPL. The poverty rate at the median income is 2.1 per cent + (0.5 × 7.6 per cent) = 5.9 per cent, which is the highest possible poverty rate estimate since the MHPL is lower than the median second income bracket. Using EquationEquation 6(6)
(6) , the calculated monthly household poverty rate by income is 2.1 per cent + [3.8 per cent × (1,430.5–1,000) / (1,496–1,000)] = 2.1 per cent + 3.3 per cent = 5.4 per cent.
Moreover, the calculation of the MHPL based on OECD criteria relies on the median monthly household income and expenditure presented at . As an illustration, the MHPL in 2015 is BND2,805.5 (). According to , this MHPL falls into the third income bracket (BND2,000 to BND2,999). Using the first proportional model, the monthly household poverty rate estimate (by income) using EquationEquation 5(5)
(5) is 2.1 per cent + 7.6 per cent + 11.7 per cent × (2,805.5–2,000 / 1,000) = 19.12 per cent.
Table 3. National Monthly Household Income and Expenditure (in BND).
With the refined model, the monthly household poverty rate (by income) using the OECD criteria is as follows. Since the MHPL of BND2,805.5 in 2015 falls into the third income bracket, with a median monthly household income of BND2,497, which is lower than the MHPL, we use EquationEquation 7(7)
(7) to estimate the poverty rate. The estimated poverty rate is 2.1 per cent + 7.6 per cent + (0.5 × 11.7 per cent) + [(0.5 × 11.7 per cent) × (2805.5–2,497) / (3,000–2,497)] = 19.14 per cent.
Distributions of monthly household income and expenditure
Household income and expenditure
This section provides an overview of the overall monthly household income and expenditure over three rounds of household expenditure surveys, which serve as the foundation for estimating Brunei’s poverty lines. The surveys reveal that the average monthly household income continuously increased within a decade (2005–2015), as seen in . The mean household income surged by 50.4 per cent during this period or experienced annual growth rate of 4.1 per cent between 2005 and 2015. This growth rate was higher than the annual inflation rate of approximately 1.0 per cent.Footnote4
reveals that in 2005, half of the households earned an income of less than BND3,640 per month, while the other half earned more than BND3,640. In 2010, half of them earned less than BND4,576 per month, indicating an improvement in income distribution. This represented a 4.6 per cent annual increase from 2005 to 2010. In 2015, the median income further increased to BND5,611 per month, indicating continued improvement in income distribution.
It is worth noting that, for the three points in 2005–2015, the mean household income was higher than the median income, with a significant difference between the two. In 2005, the mean income was 28.0 per cent higher than the median, while the difference was smaller for the following years, at 23.9 per cent and 24.9 per cent, respectively. This could indicate an improvement in income distribution during 2005–2010, followed by a slight deterioration during 2010–2015. Nevertheless, the overall trend shows an improvement in income distribution from 2005 to 2015.
As income increased during 2005–2015, the household also spent more (). However, the growth in expenditure was considerably slower than the increase in income. On average, the household expenditure only grew by 0.7 per cent annually within that decade, which was lower than the average inflation rate of about 1.0 per cent, implying that their real expenditure may have decreased. The households spent significantly less than what they earned. Households earned on average BND7,009 per month in 2015, but spent on average of only BND2,923 per month. This may indicate a high savings rate among Bruneian households, although further studies are necessary to confirm this observation. Similar to the trend in income, the mean expenditure increased over time and was higher than its median. On average, households spent BND2,735 monthly in 2005, increasing to BND 2,923 in 2015. However, household expenditure grew slower than the income growth. Half of the households spent less than BND2,075 per month in 2005, and the other half spent more. In 2015, half of them spent less than BND2,205 per month. In other words, based on its median, the household expenditure only increased by BND130 within a decade.
Household income by income bracket
Household distribution and the mean income by income bracket play an important role in estimating the poverty rate. shows the household distribution by income bracket, with an interval of BND1,000, covering 11 brackets ranging from below BND1,000 per month to BND10,000 and above per month. This figure reveals that the percentage of households earning less than BND1,000 per month decreased significantly from 8.4 per cent in 2005, 3.2 per cent in 2010 and further to 2.1 per cent in 2015. Moreover, 3.1 per cent of those in the lowest income bracket in 2005 earned income less than BND500 per month, with an average income of BND338 per month as reported by the Department of Statistics, Department of Economic Planning and Development (Citation2008). This 3.1 per cent could be part of the poor in Brunei based on the World Bank poverty line of USD1.9 per capita per day or BND560.3 per month per household (as seen in ). Thus, the poverty rate in 2005 could be at least 3.1 per cent. The more refined estimate is presented and discussed further in Section 5.
Figure 2. The trend in Household Distribution by Income Bracket: Brunei, 2005, 2010 and 2015, Source: Drawn from .
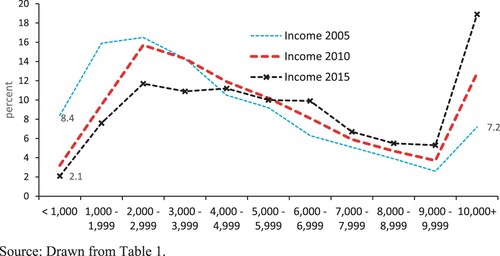
Table 4. The Estimated Brunei Monthly Household Poverty Lines (MHPLs) following World Bank Poverty Lines.
In 2005 the majority of households were concentrated in the three lowest income brackets or income below BND3,000, representing 40.8 per cent of all households. However, there has been a significant decline in this concentration over time, with only 21.4 per cent of households falling into these brackets in 2015. This indicates an improvement in income distribution. The decline in the income bracket of BND1,000 – BND3,999 has varied in speed across the different brackets.
demonstrates an increase in the percentage of households receiving income above BND5,000. The highest income bracket, which includes households earning BND10,000 and above, has seen a substantial increase in percentage, rising from 7.2 per cent in 2005, 12.8 per cent in 2010 and 18.9 per cent in 2015. These may suggest increasing income inequality among the middle and high-income brackets, in contrast to an improvement of income in the lowest three income brackets.
Monthly household expenditure by expenditure bracket
The household distribution by expenditure bracket () takes a different shape compared to the distribution by income bracket. The figure shows that households spending less than BND1,000 monthly accounted for a substantial portion, comprising 18.0 per cent in 2005. However, the proportion of low-spending households declined to 8.9 per cent in 2010, and further to 6.5 per cent in 2015 (). Notably, the percentage of the lowest expenditure bracket was considerably higher than that of the lowest income bracket for each year. Unlike the distribution of income, the highest expenditure bracket did not show the highest percentage, implying that household expenditure might have been more evenly distributed better than household income.
Figure 3. The trend in Household Distribution by Expenditure Bracket: Brunei, 2005, 2010 and 2015, Source: Drawn from .
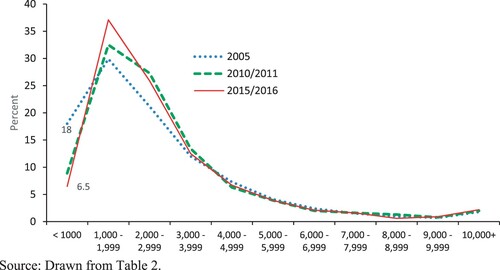
The observed trend suggests that households in low-income brackets may be receiving more social assistance from the state or even from their extended families and/ or community. Alternatively, it is possible that there is under-reporting of expenditure among high-income brackets. These factors should be taken into consideration in future studies.
Calculated monthly household poverty rates
Poverty rates based on poverty lines in low and middle-income countries
presents the calculated MHPLs in Brunei that were derived from the World Bank’s three poverty lines per day per person. These poverty lines were converted into Brunei dollars for the years 2005, 2010, and 2015, which were based on the currency exchange rate during the respective years of the Household Expenditure Surveys. As the currency exchange rate varied over time, the per day per person poverty line expressed in Brunei dollar (BND) changed accordingly.
Based on our calculation, the poverty line that corresponds to the USD1.9-per-day-per-person poverty line was equivalent to BND3.2-per-day-per-person in 2005, as shown in Column 4 of . In 2010, this poverty line declined to BND2.7-per-day-per-person and remained the same in 2015. This change was because of the strengthening BND value against the USD from 2005 to 2010 (Column 2 of ).
This poverty line is then converted into monthly household income or expenditure using EquationEquation 1(1)
(1) as presented in Column 6 of . The USD1.9-per-day-per-person poverty line is calculated to be equivalent to BND560.3-monthly-household in 2005. However, despite an increase in the size of household members (Column 3), the MHPL declined to BND505.5 in 2010. The decline indicates that the impact of BND appreciation, which reduces the monthly household poverty line, is stronger than the impact of rising household size, which increases the monthly household poverty line. The MHPL continued to decline slightly to BND494.2-monthly-household in 2015, despite no change in the currency exchange rate. The decline was because of a slight decrease in household size.
A similar trend can be observed for the other two World Bank poverty lines. The MHPL based on the LMICs was BND943.7 in 2005, and declined to BND832.3 in 2015. Likewise, the MHPL based on UMICs was BND1,621.9 in 2005 and declined to BND1,430.5 in 2015.
In accordance with the common practice of calculating the headcount index of poverty, households that have monthly income or expenditure falling below the poverty line are considered poor. shows the estimated poverty rates in Brunei for the respective years. Although it is very small, extreme poverty still exists based on monthly income, as indicated by the MHPL at USD1.9. However, the rate has substantially declined over time. In 2005, the extreme poverty rate was approximately 4.7 per cent, which is above the global 2030 SDG1 target of 3 per cent (World Bank, Citation2020). Nevertheless, since 2010 the extreme poverty rate has successfully reached even below the SDG1 target, 1.6 per cent in 2010 and further declined to 1.0 per cent in 2015.
Table 5. Estimated Monthly Household Poverty Rates in Brunei based on the World Bank Poverty Lines: Income and Expenditure Approaches.
According to Model 2, the refined model, the estimated extreme poverty rate was lower than that of Model 1 for each year, with a similar trend observed. The rate declined from 3.9 per cent in 2005 to 0.7 per cent in 2015.
The estimated poverty rates based on expenditure also declined over time, according to both Model 1 and Model 2, but were higher than those based on income. This trend may be related to the fact that higher-income households tended to spend less of what they earned. A similar trend is seen when poverty is measured with expenditure. The rates have been declining regardless of the poverty line, though the rates are higher than those measured with income. The extreme poverty rates also decrease over time when measured with expenditure, with the refined model indicating a rate of 2.1 per cent in 2015, which is below the SDG1 target of 3.0 per cent. This suggests that Brunei has already achieved one of the SDGs when measured with expenditure. However, when measured with the UMICs poverty line, the estimated poverty rates were much higher when based on expenditure than on income. In 2015, the rates were 22.5 per cent and 20.3 per cent according to Models 1 and 2, respectively, compared to only 5.4 in both models when measured with income.
Estimated poverty rates based on the poverty line in high-income countries
Using 50.0 per cent of the monthly household median income as the poverty line for high-income countries, the calculated MHPL in Brunei was BND1,820.0 in 2005, and increased to BND2,805.5 in 2015. As shown in , MHPLs calculated with expenditure were lower than those with income because the median household expenditure was lower than the median household income. The MHPLs decreased between 2010 and 2015, when it was measured with expenditure. Therefore, poverty rates were lower when measured with expenditure. Additionally, the poverty rates measured with expenditure were even lower than the UMICs poverty line. As with the earlier calculations, two models were used to calculate the poverty rates – the proportional model and the refined one.
Table 6. Estimated Poverty Rates based on Poverty Line in High-Income Countries: Brunei, 2005, 2010 and 2015
demonstrates a decreasing trend in relative poverty rates in Brunei over time, regardless of whether the rates were calculated based on income or expenditure, proportional or refined, over 2005–2015. Relative poverty rates were consistently higher when measured by income than by expenditure, in contrast to poverty rates based on the World Bank poverty lines. Compared to OECD countries, the relative poverty rate of 19.14 per cent in Brunei in 2015 (Model 2), was almost similar to Romania and Israel (19.3 and 19.5 per cent, respectively) and lower than 27.2 per cent in South Africa, the highest rate among OECD countries in 2015. However, when measured by expenditure, Brunei’s relative poverty of 9.8 per cent in 2015 was comparable to that of Ireland, Slovenia, Switzerland, and Sweden.
Finally, our calculation shows that poverty rates based on household expenditure as indicators used for upper-middle income countries are higher than those using OECD indicators. This may be partly due to the resulting calculation that poverty lines based on the former are higher. However, further research is needed to explore this finding in greater depth.
Conclusion
The paper produces the first statistics on poverty in Brunei. With the World Bank poverty lines, the paper produces 36 statistics on poverty derived from 3 MHPLs for three years based on income and expenditure and two models. With the OECD’s poverty line, it produces 12 statistics on poverty derived from income and expenditure for 3 years and two models. A total of 48 statistics for 3 years or 16 statistics each year will provide a better assessment of the condition of Brunei’s welfare, depending on the targeted population, given the social and political contexts.
The study reveals that, based on poverty lines for low-income countries, as well as low and upper-middle-income countries, the monthly household poverty rates based on expenditure were consistently higher than those based on income. Households in the low-expenditure brackets accounted for higher percentages than those in the low-income brackets, whereas households in the high-expenditure brackets accounted for much lower percentages than those in the high-income brackets. There is a possibility of under-reporting in the low percentages of the high-expenditure brackets.
On the other hand, when using the poverty line for high-income countries, the monthly household poverty rate based on income was always higher than that based on expenditure. The poverty rate for the high-income countries is a relative poverty rate, changing with socioeconomic conditions, different from the poverty rates for low and middle-income countries. Overall, regardless of the measurement, this study found that the poverty rate in Brunei had declined from 2005 to 2015. There are three reasons for the decline: the strengthening BND, a slight decline in household size, and an increase and better coverage of welfare spending may have significantly contributed to this decline. This result could imply that a significant number of households in Brunei has been transitioning toward higher income and expenditure brackets.
It is important to acknowledge that poverty is a complex issue that cannot be accurately captured by one single indicator. Each poverty indicator has its own strengths and weaknesses, and the choice of the indicators should be determined by the specific socio-economic-political conditions of the country. For instance, if the focus is on basic needs, then a poverty line based on low-income countries may be appropriate. Conversely, if the focus is in wider needs of the society, a poverty line based on indicators for upper middle-income countries is better.
Moreover, it may be useful to consider relative income as the indicator of poverty, which may adjust the poverty line to reflect changes in the country’s standard of living. Therefore, the median income or expenditure could be used to determine the poverty line. By employing a range of poverty indicators, the government of Brunei Darussalam can develop a more comprehensive understanding of poverty. This would allow for a more targeted and effective approach to reduce poverty.
Yet, further studies can explore other concepts and measurements of poverty by utilising raw data from household expenditure surveys. The capability approach and multidimensional poverty index, for example, could be employed. Future studies, with the raw data, should disaggregate the poverty rate at least by age and sex of the head of household, while also examining the role of transfer from the state, extended families, and/ or community on household expenditures.
Additionally, to better understand the state of poverty in Brunei, it is necessary to explore perceived poverty among middle-income individuals. Despite the decreasing poverty rate in Brunei, it is still possible for middle-income individuals to experience perceived poverty, partly because of rising aspiration.
While this paper focuses on the technical calculations of poverty in Brunei, further studies should also explore the implications of our estimated statistics. Nevertheless, this paper illustrates how to calculate poverty rates in the absence of access to raw data sets, which may be beneficial for other countries without access to raw data sets. Further studies should also explore the policy implications of our estimated statistics. In particular, it will be useful to understand the kind of policies that can sustain welfare spending along with economic diversification away from heavy dependence on hydro-carbon revenues. Finally, current policies that aim at cultivating an entrepreneurial mind-set should be continued to maintain low and declining poverty rates while ensuring the sustainability of the state budget.
Disclosure statement
No potential conflict of interest was reported by the author(s).
Additional information
Funding
Notes
2 This paper does not apply EU criteria of ‘risk of poverty or social exclusion’, because available published data are not sufficient to calculate the social exclusion.
3 The exchange rates for the respective years were provided from the following UN website https://unstats.un.org‘syb60’T16_Exchangerates
4 This assumed average inflation rate is a conservative estimate. During 2005 and 2015, the annual inflation rate was always below 1.9 percent, except during the depression in 2008 (2.09 percent) and 2009 (1.03 percent). See https://www.statista.com/statistics/526787/inflation-rate-in-brunei-darussalam/#statisticContainer accessed on 28 April 2022.
References
- Abdullah, R. (2015). Poverty and microfinance in Brunei Darussalam. UNISSA Press.
- Ahmad, N. (2022). Demography of Brunei. In O. K. Gin & V. T. King (Eds.), Routledge handbook of contemporary Brunei (1st ed., pp. 61–78). Routledge. https://doi.org/10.4324/9781003020431
- Ananta, A., & Barichello, R. (2012). Poverty and food security in uncertain Southeast Asia. In A. Ananta, & R. Barichello (Eds.), Poverty and global recession in Southeast Asia (pp. 3–22). Institute of Southeast Asian Studies. https://bookshop.iseas.edu.sg/publication/1226
- Arifin, E. N., & Ahmad, N. (2023). Changing faces of Brunei population. In A. Ananta, C. Y. Hoon, & M. Hamdan (Eds.), Stability, growth and sustainability: Catalysts for socio-economic development in Brunei Darussalam (pp. 161–194). ISEAS-Yusof Ishak Institute. https://bookshop.iseas.edu.sg/publication/7834
- Atkinson, A. B. (2019). Measuring poverty around the world. Princeton University Press.
- Azim, P. (2002). The ageing population of Brunei Darussalam: Trends and economic consequences. Asia-Pacific Population Journal, 17(1), 39–54. https://doi.org/10.18356/f356c493-en
- Bandial, A. (2021, November 16). More Bruneians seeking welfare assistance during second wave: MCYS. The Scoop. https://thescoop.co/2021/11/16/more-people-applying-for-welfare-during-second-wave-mcys/
- Bashir, M. S., & Haji Ali, N. N. (2012). Analysis of zakat management in Brunei Darussalam. International Journal of Management Studies, 19(2), 75–102. https://e-journal.uum.edu.my/index.php/ijms/article/view/10373
- Booth, A. (2019). Measuring poverty and income distribution in Southeast Asia. Asian- Pacific Economic Literature, 33(1), 3–20. https://doi.org/10.1111/apel.12250
- Buddelmeyer, H., & Cai, L. (2009). Interrelated dynamics of health and poverty in Australia. IZA Discussion Paper No. 4602. https://www.iza.org/publications/dp/4602/interrelated-dynamics-of-health-and-poverty-in-australia
- Clarke, P., & Erreygers, G. (2020). Defining and measuring health poverty. Social Science Medicine, 244(February 2019), 112633. https://doi.org/10.1016/j.socscimed.2019.112633
- Department of Economic Planning and Development, Ministry of Finance and Economy. (2019). Report of the household expenditure survey 2015/16. Department of Economic Planning and Development, Ministry of Finance and Economy.
- Department of Economic Planning and Statistics /DEPS, Ministry of Finance and Economy. (2022). The population and housing census report (BPP) 2021: Demographic, household and housing characteristics. Department of Economic Planning and Development, Ministry of Finance and Economy.
- Department of Statistics, Department of Economic Planning and Development. (2008). Summary tables of householdeExpenditure survey Brunei Darussalam 2005.
- Department of Statistics, Department of Economic Planning and Development. (2013). Report of the household expenditure survey 2010/11.
- Gweshengwe, B., & Hassan, N. H. (2019). Knowledge to policy: Understanding poverty to create policies that facilitate zero poverty in Brunei Darussalam. Southeast Asia: A Multidisciplinary Journal, 9, 95–104. https://fass.ubd.edu.bn/SEA/vol19/SEA-v19-Gweshengwe.pdf
- Hajah Sainah binti Haji Saim. (2010). Social protection in Brunei Darussalam: Current state and challenges’. In M. G. Asher, S. Oum, & F. Parulian (Eds.), Social protection in East Asia: Current state and challenges, ERIA Research Project Report 2009-9 (pp. 124–156). ERIA. https://www.eria.org/uploads/media/Research-Project-Report/RPR_FY2009_9_Chapter_5.pdf
- Hamdan, M., & Hoon, C. Y. (2019). Brunei Darussalam. In D. Singh, & M. Cook (Eds.), Southeast Asian affairs 2019 (pp. 85–102). ISEAS - Yusof Ishak Institute.
- Haughton, J., & Khandker, S. R. (2009). Handbook on poverty and inequality. The International Bank for Reconstruction and Development/The World Bank.
- Ministry of Finance and Economy, Government of Brunei Darussalam. (2020). Voluntary national review report of Brunei Darussalam. Ministry of Finance and Economy. https://planipolis.iiep.unesco.org/sites/default/files/ressources/brunei_darussalam_vnr_2020.pdf
- Nair, S., & Sagaran, S. (2015). Poverty in Malaysia: Need for a paradigm shift. Institutions and Economies, 7(3), 95–123. https://ijie.um.edu.my/index.php/ijie/article/view/5020
- Nelson, G. (2011). Measuring poverty: The official U.S. Measure and material hardship. Poverty & Public Policy, 3(3), 1–35. http://www.psocommons.org/ppp/vol3/iss3/art5
- OECD. (2022). Poverty rate (indicator). Retrieved April 28, 2022 from https://doi.org/10.1787/0fe1315d-en
- Othman, A. (2008). Brunei target zero poverty. Retrieved from http://sultanate.com/news_server/2008/5_mar_1.html
- Sen, A. (2000). Development as freedom. Alfred A. Knopf.
- United Nations. (2017). Leaving no one behind: Equality and non-discrimination at the heart of sustainable development. United Nations. https://unsceb.org/sites/default/files/imported_files/CEB%20equality%20framework-A4-web-rev3.pdf
- World Bank. (2020). Poverty and shared prosperity 2020: Reversals of fortune. World Bank. https://doi.org/10.1596/978-1-4648-1602-4