
ABSTRACT
The manoeuvring performance of inland vessels is even more crucial than that of seagoing ships due to more complex navigation environment. One of the most effective possibilities to improve ship manoeuvrability is to change the rudder configuration. Twin or even quadruple rudders and high-lift profiles are widely applied to inland vessels. When inland vessels equip with multiple rudders, the interaction effects between the rudders affect the hydrodynamic characteristics of each rudder. This paper presents a study on these interaction effects using two-dimensional Reynolds-averaged Navier–Stokes (RANS) methods. Various twin-rudder and quadruple-rudder configurations with different profiles and spacing among the multiple rudders were studied. RANS simulations were performed with a k − ω SST turbulence model and a pressure-based coupled algorithm. Series of NACA, IFS and wedge-tail profiles were tested. Regression formulas have been proposed for the twin-rudder lift and drag coefficients. Finally, interaction effects on multiple rudder hydrodynamics have been summarised.
Nomenclature
Abbreviations
| QPI | = | The inner rudder of the port side twin-rudder unit |
| QPO | = | The outer rudder of the port side twin-rudder unit |
| QSI | = | The inner rudder of the starboard side twin-rudder unit |
| QSO | = | The outer rudder of the starboard side twin-rudder unit |
| SPSR | = | Single-propeller single-rudder |
| SPTR | = | Single-propeller twin-rudder |
| TPQR | = | Twin-propeller quadruple-rudder |
| TPTR | = | Twin-propeller twin-rudder |
Greek Symbols
| σ | = | Root mean squared error (standard error) of the regression coefficients (−) |
Roman Symbols
| CD | = | Drag coefficient (−) |
| CL | = | Lift coefficient (−) |
| CR | = | Rudder chord length (m) |
|
| = | Drag coefficient at zero angle of attack (−) |
|
| = | Lift coefficient at zero angle of attack (−) |
| DP | = | Propeller diameter (m) |
|
| = | Regression coefficients of the drag coefficients in twin-rudder configurations (−) |
|
| = | Regression coefficients of the lift coefficients in twin-rudder configurations (−) |
| R2 | = | R-squared (coefficient of determination) of the regression coefficients (−) |
| yR | = | Relative position of the rudder to the propeller shaft in a twin-rudder configuration (m) |
| yTR | = | Spacing between the twin rudders of twin-rudder configurations (m) |
| yTU | = | Spacing between the two twin-rudder units of quadruple-rudder configurations (m) |
Superscripts
| S | = | Single rudder |
| TP | = | Port side of a twin-ruder configuration |
| TS | = | Starboard side of a twin-ruder configuration |
1. Introduction
When the area of a single rudder is limited and insufficient to satisfy the manoeuvring requirements, multiple-rudder configurations are applied to inland vessels to enlarge the total rudder area. Examples of multiple-rudder configurations include, but are not limited to, single-propeller twin-rudder, twin-propeller twin-rudder and twin-propeller quadruple-rudder. Nowadays, a large number of newly built inland vessels are equipped with a configuration consisting of twin propellers and twin rudders. Also, a significant number of ships have twin propellers with quadruple rudders. Furthermore, the twin-propeller twin-rudder configuration has also been applied to large seagoing ships in order to enhance its performance in manoeuvring, especially in shallow water.
Apart from the selection of the rudder profile, the rudder properties and the rudder type for each rudder (Liu and Hekkenberg Citation2016), the spacing between rudders needs to be considered as well. This spacing affects the extent to which interaction effects influence the hydrodynamic characteristics, i.e. lift and drag coefficients, of the rudder configuration. Despite this, the hydrodynamic coefficients in a twin-rudder configuration are commonly assumed equal for both rudders although they are actually different for each rudder. The rudder profile may also influence the interaction between rudders in a multiple-rudder configuration. However, it is not explicitly considered in existing empirical formulas used for estimation of rudder force coefficients. Therefore, the study presented in this paper attempts to cover a wide variety of multiple-rudder configurations considering the spacing and the profile.
Traditionally, wind-tunnel tests (Thieme Citation1965; Molland and Turnock Citation2007) or towing tests (Vantorre Citation2001) are being used to study rudder hydrodynamics. New test methods such as particle image velocimetry (PIV) (Felli and Falchi Citation2011; Gim Citation2013) are also being applied nowadays to gain insights into the flow dynamics. Additionally, computational fluid dynamics (CFD) methods, especially those that apply the Reynolds-averaged Navier–Stokes (RANS) equations, are widely being used to study different aspects of rudder design (Van Nguyen and Ikeda Citation2014; Badoe et al. Citation2015; Shen et al. Citation2016). This paper presents RANS simulations for twin-rudder and quadruple-rudder configurations with different spacings and profiles.
A series of CFD computations have been conducted to study the rudder hydrodynamics of multiple-rudder configurations. Section 2 introduces the multiple-rudder configurations considered in this study. Section 3 then presents the applied approach for the computations. Section 4 and Section 5 discuss the impacts of spacing between rudders and the impacts of the rudder profile respectively, for twin-rudder configurations. Section 6 presents the impacts of spacing for quadruple-rudder systems. Section 7 describes the development of a regression model for the lift and drag coefficients of rudders in a twin-rudder configuration. Finally, Section 8 presents conclusions and gives suggestions for future work.
2. Multiple-rudder configurations
For the study presented in this paper, two aspects of twin-rudder and quadruple-rudder configurations were considered: the spacing between the rudders (Section 2.1) and the applied rudder profile (Section 2.2). These aspects influence the hydrodynamic characteristics of the rudders and therefore affect the rudder performance with regard to manoeuvring and propulsion. Section 2.3 presents the rudder configurations investigated in this study. For each rudder, the force conventions are illustrated in . In this paper, counter-clockwise angles are taken as positive.
Figure 1. Rudder force conventions.
2.1. Spacing among rudders
The relative positions of multiple rudders are defined by the lateral spacing between the rudder stocks, which are shown in . For twin-rudder configurations, the spacing between the two rudder stocks (yTR) is normally around the value of the propeller diameter (DP). Additionally, for inland vessels, the rudder chord length (CR) is commonly not much different from DP. Therefore, in this paper, CR is used as the non-dimensional factor for the spacing between rudders. A quadruple-rudder configuration can be regarded as a combination of two twin-rudder units with specified spacing between the two inner stocks (yTU). When yTR and yTU are large enough, no interaction effect is expected.
Figure 2. Conventions of twin-rudder and quadruple-rudder configurations.
2.2. Applied rudder profiles
A rudder profile is the sectional shape of the rudder in two-dimensional (2D). The profile significantly affects the hydrodynamic characteristics. Furthermore, the profile can be symmetric and asymmetric. Three symmetric series including NACA, IFS and wedge-tail were tested. Additionally, rudder thickness was varied in three steps for each profile. The wedge-tail profiles included in this study were derived from conventional NACA profiles. Altogether, 10 different profiles were tested as illustrated in .
Figure 3. Applied rudder profiles for multiple-rudder interaction study.
Profiles of a NACA series are widely applied as ship rudders. They provide sufficient manoeuvring forces with low drag. Another profile series commonly applied is the IFS series, which was intended for ship rudders specifically. In cases where large manoeuvring forces are required, high-lift profiles, for instance, wedge-tail, are used. However, the exact geometries of these high-lift profiles are not publicly available. Flat plate rudders are not included in this research since they cannot provide high lift at large angles. Finally, flapped rudders are excluded since they may be too expensive for an inland ship.
2.3. Test configurations
The tests were divided into three groups. gives an overview of the groups and the test cases. The first group of tests was conducted to purely investigate the impacts of the spacing between twin rudders on the performance of the twin-rudder configuration (Section 4). The second group provided insights into the impacts of the choice of the profile for twin-rudder configurations (Section 5) and the third group focused on impacts of the spacing for quadruple-rudder configurations (Section 6). In total, 70 cases were investigated using RANS simulations, of which the details are presented in the next section.
Table 1. Test configurations to analyse the impacts of the spacing and the profile on multiple-rudder configurations.
3. Applied RANS methods
To have reliable RANS results, the mesh and the solver used in the simulations required careful configuration. The mesh represents the computational domain in a discrete form on which governing equations are solved numerically. In this paper, unstructured meshes were used with structured inflation layers in a 2D rectangular domain. The domain was 90 CR long and 60 CR wide to minimise the influence of the boundaries on the results. The applied boundary conditions were symmetry, velocity-inlet, pressure-outlet and wall as shown in . Additionally, an inner domain was added to refine the meshes around the profile to properly capture the wake field.
Figure 4. Applied mesh topology and boundary conditions. Adapted from Liu et al. (Citation2016).
The simulations were carried out at a Reynolds number of 6 × 10⁶ above which the hydrodynamic characteristics are expected to be independent of the Reynolds number (Ladson Citation1988). Eleni et al. (Citation2012) indicated that the k − ω SST turbulence has a closer agreement with experimental results than the Spalart–Allmaras and realizable k − ε models. Moreover, the k − ω SST model is in general good at simulating the flow through the viscous sub-layer as well as in the wake of the free-stream. Therefore, the k − ω SST model was applied for all simulations in this paper. Accordingly, the non-dimensional first layer height y + was configured to be smaller than 1. illustrates an example of the applied meshes for a twin-rudder configuration. This RANS method was validated with a NACA 0012 profile and applied for single-rudder studies in the authors’ previous work (Liu et al. Citation2016).
Figure 5. Applied unstructured meshes with structured inflation layers.
Uniform inflow velocity was used so that the computations correspond to open-water tests. In practice, the presence of the hull and the propellers will lead to non-uniform inflow. Also, if the rudders are set at a certain angle, the ship attains or already has a yaw rate and drift angle, also affecting the inflow towards the rudders. This will be, to a certain extent, be compensated for by the to the flow straightening effect of the propeller, especially since inland vessel propellers are commonly heavily loaded due to their limited diameter. The effects of propeller thrust on rudder hydrodynamics may also be neglected in the case of single-propeller single-rudder (SPSR) configurations and twin-propeller twin-rudder (TPTR) configurations since the rudder stock is in line with the propeller shaft. For such a case, open-water tests can be considered as a good approximation.
In the case of single-propeller twin-rudder (SPTR) and twin-propeller quadruple-rudder (TPQR) configurations, the effects of propeller slipstream become larger. For SPTR inland vessels on the Rhine, the spacing between the twin rudders (yTR) is commonly smaller than the propeller diameter (DP) and the rudders are, therefore, inside the propeller slipstream according to Quadvlieg (Citation2013). However, when yTR is larger as was investigated in this paper, the rudders move outside of the slipstream and will thus encounter a lower inflow speed. A larger yTR would thus lead to decreased effectiveness of the rudder system. Since the presented study focused on the interaction between twin rudders, this effect was not considered for now but is recommended for further research.
Another effect not included in this study is propeller outflow contraction following from conservation of mass as shown in . Including this would have the rudders in the case of SPTR or TPQR configurations being subject to an attack angle even at zero angle of attack. At high rudder angles, separation may occur earlier. For low rudder angles, however, the lift forces on both rudders per propeller are opposite, so the effectiveness of the total configuration is not that much affected.
Figure 6. Streamline contraction along the propeller disc.
Finally, the present study did not include the effects of asymmetric inflow due to drift and yaw. For twin-propeller configurations, one of the propellers experiences a different inflow and thus produces different outflow if the ship is subject to a non-zero drift angle. Even for a single-propeller configuration, the wake field changes as was shown by Harvald (Citation1983). Due to flow straightening by the propellers, however, the per-propeller rudder system behaviour should not be affected significantly so effects due to yaw and drift can be accounted through changing the outflow speed per propeller accordingly. Still, despite these few deviations from a practical case, effects purely following from rudder interactions in multi-rudder configurations can be observed more clearly if an open water case is investigated as was done in this paper. In further investigations, it is recommended to include effects from non-uniform inflow to investigate how that changes the rudder performance.
4. Impacts of the spacing on twin-rudder hydrodynamics
The spacing between twin rudders (yTR) affects the pressure distribution around the twin rudders and thus changes the hydrodynamic characteristics. To analyse the impacts of yTR on twin-rudder hydrodynamics, single-rudder and twin-rudder configurations, both with a NACA 0018 rudder profile, were tested with yTR between 0.4 CR and 1.0 CR at intervals of 0.1 CR. The range of the test angles of attack was 0° to 35°. illustrates the pressure distributions of twin rudders with different yTR at the angle attack of 10°.
Figure 7. Pressure distributions and stream traces of twin NACA 0018 rudders at an angle of attack of 10° with various yTR, (a) yTR/CR = 0.4., (b) yTR/CR = 0.5., (c) yTR/CR = 0.6., (d) yTR/CR = 0.7., (e) yTR/CR = 0.8., (f) yTR/CR = 0.9., (g) yTR/CR = 1.0., (h) yTR/CR = ∞. This figure is available in colour online.
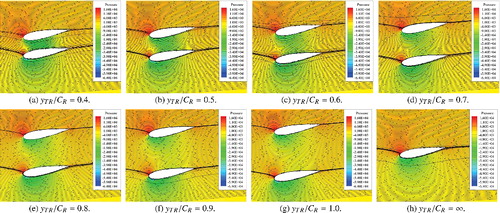
A clear low-pressure region is observed between the twin rudders. For increasing yR, the low-pressure region got weaker and therefore, the pressure difference between the two sides of the port side rudder increased while that of the starboard side rudder decreased, which led to an increase in the port side rudder lift coefficient and a decrease in the starboard side lift coefficient. The pressure at the leading edge of the port side rudder was decreased while that of the starboard side rudder was increased. This phenomenon explains the changes in the drag coefficients of each rudder. compares the lift and drag coefficients of the single rudder and each rudder in the twin-rudder configurations with various yTR.
Figure 8. Lift and drag coefficients of a single NACA 0018 rudder and either side of twin NACA 0018 rudders with various yTR. This figure is available in colour online.
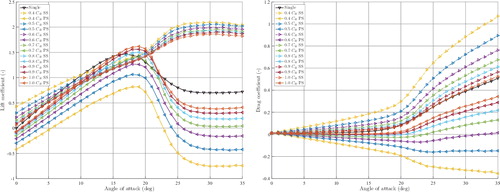
Stall angles of the port and starboard side rudder increase in a twin-rudder system were compared to the stall angle for a single rudder. Especially for the starboard side rudder, the sharp decrease of the lift coefficient after the single-rudder stall angle did not occur. For smaller rudder angles, the lift slopes of both rudders were roughly similar but smaller than that of the single-rudder case. In general, the starboard side rudder yielded higher lift coefficients than the port side rudder. However, for yTR between 0.9 CR and 1.0 CR, the port side rudder yielded a larger lift coefficient than the starboard rudder for angles of attack in the range of 10° to 16°.
The drag coefficient curves of both rudders in the twin-rudder configuration showed an approximately symmetric deviation from the drag coefficient of the single rudder for small angles of attack. The drag coefficients were more sensitive to the change of yTR at larger angles of attack (larger than 15°) because frictional drag is dominant at small angles, while pressure drag is dominant at large angles of attack. Due to the low-pressure region between the rudders in the twin-rudder configuration, the drag coefficient of the port side rudder was negative at certain rudder angles, which means that it was generating thrust. This was compensated for by the starboard side rudder which had a much higher drag coefficient than the single rudder. Due to this difference in drag between the twin rudders, a yaw moment acting on the ship was generated. In general, this moment will be small but it can be significant at angles of attack.
The influence that yTR had on the lift coefficient of the port side rudder () was larger than its influence on the lift coefficient of the starboard side rudder (
). An increase in yTR led to an increase in
and a relatively small decrease of
. Smaller values of yTR led to stronger impacts on the lift coefficients compared to the lift coefficient of the single rudder. shows the total (i.e. sum of the lift and drag coefficients of both rudders) hydrodynamic coefficients of the twin-rudder configuration for different values of yTR. ‘Single’ indicates the coefficients for a single rudder and ‘INF’ corresponds to a twin-rudder configuration with infinite yTR. The hydrodynamic coefficients of the system corresponding to ‘INF’ are twice those of the single rudder system.
Figure 9. Total hydrodynamic coefficients of a single NACA 0018 rudder and twin NACA 0018 rudders with various yTR. This figure is available in colour online.
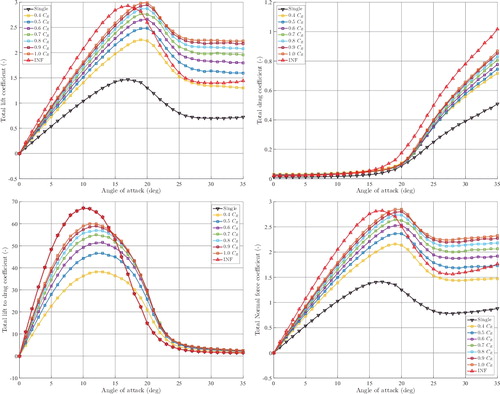
The total lift coefficient and its slope against the attack angle increased when yTR increased. The total drag coefficient slightly decreased for larger yTR at angles of attack smaller than 20° but increased at large angles of attack. The total lift to drag ratios (CL/CD) decreased if yTR became smaller because the lift coefficient decreased faster than the drag coefficient. Furthermore, twin-rudder configurations with a large value of yTR yielded higher normal force coefficients than configurations with smaller yTR. Overall, an increase in yTR leads to an increase in efficiency (i.e. the lift to drag ratio) and effectiveness (the normal force) of the twin-rudder system in open water, with the upper limit of efficiency and effectiveness set by the data corresponding to ‘INF’.
5. Impacts of the profile on twin-rudder hydrodynamic characteristics
The previous section discussed the impacts of spacing between rudders on the hydrodynamic coefficients of a twin-rudder configuration. This section presents the test results of nine profiles from three families as listed in to analyse the effect of the chosen rudder profile on the hydrodynamic coefficients. and show the pressure distribution and stream traces of three selected profile series. In results for thicker profiles, larger interaction effects were occurring because the wake fields of these profiles were larger than those of the thinner profiles.
Figure 10. Pressure distributions and stream traces of twin-rudder configurations with different profiles at an angle of attack of 10° with yTR = 0.5 CR. (a) NACA 0015., (b) NACA 0020., (c) NACA 0025., (d) IFS58 TR15., (e) IFS58 TR25., (f) IFS62 TR15., (g) Wedge-tail 0015., (h) Wedge-tail 0020., (i) Wedge-tail 0025. This figure is available in colour online.
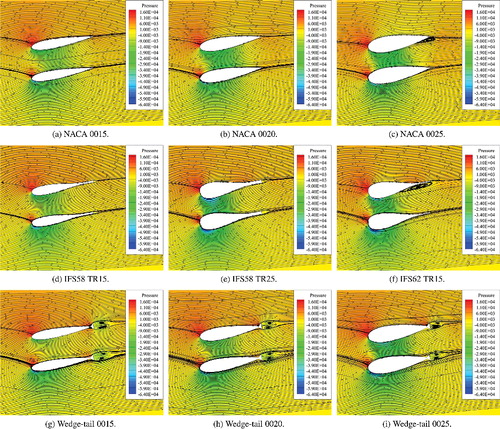
Figure 11. Pressure distributions and stream traces of twin-rudder configurations with different profiles at an angle of attack of 10° with yTR = 1.0 CR. (a) NACA 0015., (b) NACA 0020., (c) NACA 0025., (d) IFS58 TR15., (e) IFS58 TR25., (f) IFS62 TR15., (g) Wedge-tail 0015., (h) Wedge-tail 0020., (i) Wedge-tail 0025. This figure is available in colour online.
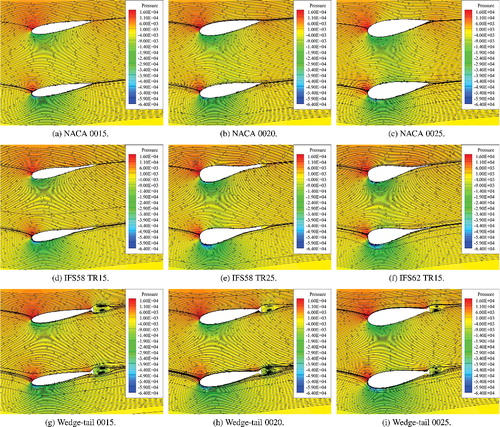
The non-streamlined wedge-tail rudder profiles recovered part of the pressure at the trailing edge and therefore produced larger lift forces at the cost of increased drag. Furthermore, the wedge-tail profile results show larger recirculation than other profiles, which increased the pressure difference between the pressure and the suction side and thus produced larger lift force, but also led to increased drag. Additionally, the pressure distribution around the IFS profiles shows a stronger decrease of pressure at the leading edge, which partly explains their balanced performance in lift and drag.
The hydrodynamic coefficients of the profiles considered are presented in and for yTR values of 0.5 CR and 1.0 CR, respectively. These two spacings were selected because they are the minimum and maximum values of yTR among commonly applied twin-rudder configurations. The angles of attack that were used are in the range of 0° to 35° with intervals of 1°. From and , it was observed that the impacts of yTR on the hydrodynamic characteristics are similar for different rudder profiles: increasing yTR increased the total lift coefficient, the slope of the total lift curves and the total drag coefficient. Thus, the total normal force became larger, which enhances the effectiveness of the twin rudders.
Figure 12. Total hydrodynamic coefficients of various twin rudders with yTR = 0.5 CR. This figure is available in colour online.
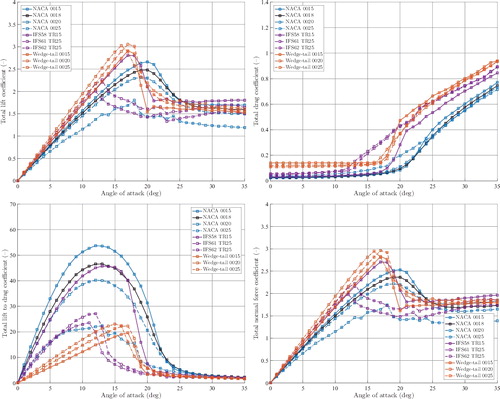
Figure 13. Total hydrodynamic coefficients of various twin rudders with yTR = 1.0 CR. This figure is available in colour online.
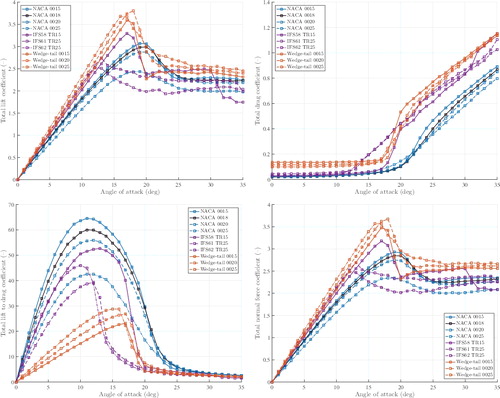
Since the increase in the total lift coefficient was larger than the increase in the total drag coefficient, the total lift to drag ratio got larger which led to an improvement of the efficiency of the twin-rudder system. Of the profiles tested, a wedge-tail profile showed to be most effective. The NACA profile was most efficient and the IFS profile showed that it is balanced in efficiency and effectiveness. The thinner profiles showed better performance than the thicker ones. Overall, well-streamlined profiles (NACA and IFS) performed better than profiles with non-streamlined appendages (wedge-tail) with regard to efficiency, but they performed worse in terms of effectiveness.
6. Impacts of the spacing on quadruple-rudder hydrodynamics
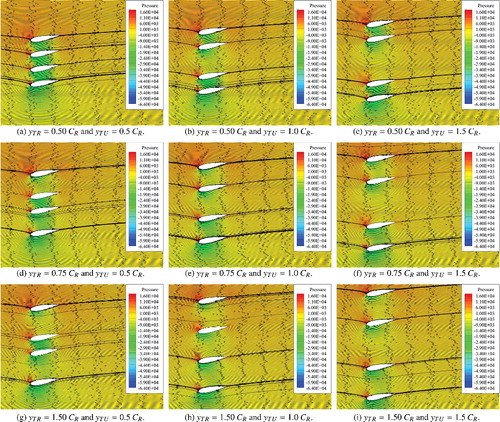
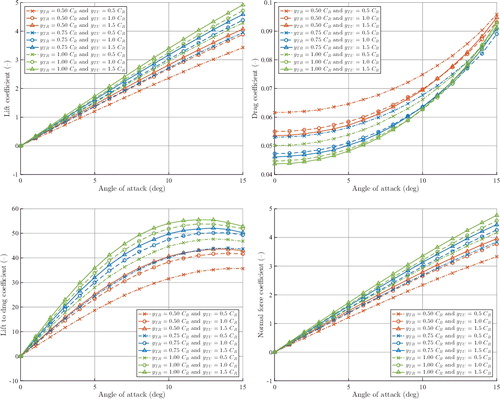
To analyse the interaction effects between the two twin-rudder units in quadruple-rudder configurations, yTR and yTU were varied in three steps as listed in . In total, nine combinations were tested and compared. The angles of attack considered are in a range of 0○ to 15○, which is smaller than the range used for other computations to reduce the computation time. presents the pressure distributions and the stream traces of each case. Similar to what was observed for the twin-rudder system, and increases in yTR and yTU lead to the pressure distribution around each rudder to become more similar to that of a single rudder.
Figure 14. Pressure distribution and stream traces of quadruple-rudder configurations at angle of attack of 10° with different yTR and yTU. (a) yTR = 0.50 CR and yTU = 0.5 CR., (b) yTR = 0.50 CR and yTU = 1.0 CR., (c) yTR = 0.50 CR and yTU = 1.5 CR., (d) yTR = 0.75 CR and yTU = 0.5 CR., (e) yTR = 0.75 CR and yTU = 1.0 CR., (f) yTR = 0.75 CR and yTU = 1.5 CR., (g) yTR = 1.50 CR and yTU = 0.5 CR., (h) yTR = 1.50 CR and yTU = 1.0 CR., (i) yTR = 1.50 CR and yTU = 1.5 CR. This figure is available in colour online.
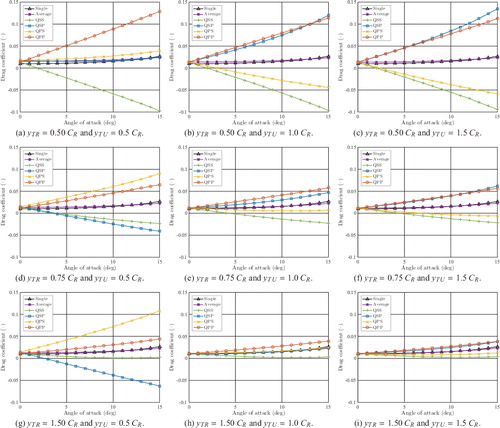
The lift and drag coefficients of each rudder in the quadruple-rudder configurations are compared to those of the single-rudder in and . As shown in , single, average, QSO, QSI, QPI and QPO denote the single rudder, the average coefficient of the quadruple rudders, the outer rudder of the starboard side twin-rudder unit, the inner rudder of the starboard side twin-rudder unit, the inner rudder of the port side twin-rudder unit and the outer rudder of the port side twin-rudder unit, respectively. In accordance with the changes in the pressure distribution, the lift and drag coefficients of each rudder in quadruple-rudder configurations got close to those of the single rudder as spacing among rudders increased.
Figure 15. Lift coefficients of each rudder in a quadruple-rudder configuration compared to the lift coefficient of a single rudder. (a) yTR = 0.50 CR and yTU = 0.5 CR., (b) yTR = 0.50 CR and yTU = 1.0 CR., (c) yTR = 0.50 CR and yTU = 1.5 CR., (d) yTR = 0.75 CR and yTU = 0.5 CR., (e) yTR = 0.75 CR and yTU = 1.0 CR., (f) yTR = 0.75 CR and yTU = 1.5 CR., (g) yTR = 1.50 CR and yTU = 0.5 CR., (h) yTR = 1.50 CR and yTU = 1.0 CR., (i) yTR = 1.50 CR and yTU = 1.5 CR. This figure is available in colour online.
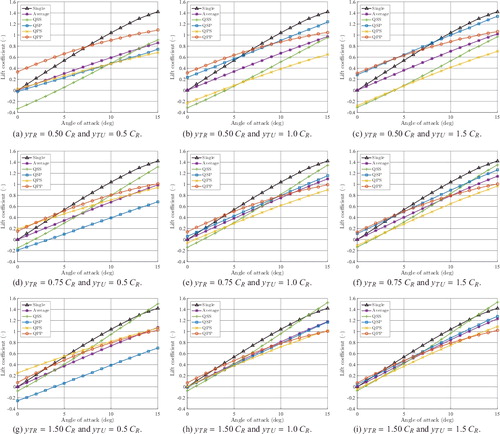
Figure 16. Drag coefficients of each rudder in a quadruple-rudder configuration compared to the drag coefficient of a single rudder. (a) yTR = 0.50 CR and yTU = 0.5 CR., (b) yTR = 0.50 CR and yTU = 1.0 CR., (c) yTR = 0.50 CR and yTU = 1.5 CR., (d) yTR = 0.75 CR and yTU = 0.5 CR., (e) yTR = 0.75 CR and yTU = 1.0 CR., (f) yTR = 0.75 CR and yTU = 1.5 CR., (g) yTR = 1.50 CR and yTU = 0.5 CR., (h) yTR = 1.50 CR and yTU = 1.0 CR., (i) yTR = 1.50 CR and yTU = 1.5 CR. This figure is available in colour online.
The total hydrodynamic coefficients of the quadruple-rudder configurations are compared with each other in . For an equal value of yTR, the quadruple-rudder configuration with the larger yTU value showed larger total CL, but lower total CD. Therefore, total CL/CD and total CN were higher. This is explained by the fact that the two inner rudders (QSI and QPI) are in the low-pressure field that is caused by the two outer rudders (QSO and QPO). When yTU was kept equal, the lift coefficient increased and the drag coefficient decreased as yTR increased. In total, the efficiency and the effectiveness of a quadruple-rudder configuration improved as yTR and yTU got larger.
Figure 17. Total hydrodynamic coefficients of quadruple NACA 0018 rudders with various yTR and yTU. This figure is available in colour online.
7. Regression analysis for twin-rudder hydrodynamic coefficients
In Section 4, the impacts of spacing between rudders in a twin-rudder system was discussed. From the data in , a correlation between the hydrodynamic coefficients of each rudder and those of the single rudder was found. Therefore, a regression study, which is presented here, was conducted in order to develop a prediction method that allows the prediction of the lift and drag coefficients of starboard and port side rudders (,
,
and
) in the twin-rudder configuration based on the single-rudder lift (CSL) and drag (CSD) coefficients.
In practice, the twin rudders on inland vessels should be able to be operated at rudder angles of almost 90°. Because of this, the gap between the twin rudders can be closed to achieve shorter stopping distance than the common reverse engine stopping. Additionally, the rudder stock is commonly located at a quarter of the chord length from the leading edge. Therefore, the practical minimal spacing between twin rudders is 0.5 CR. Because of this, the data related to yTR of 0.4 CR was not used in the regression study.
Considering the impacts of the rudder profile and the spacing on lift and drag coefficients, the regression formulas were given the following format:
(1)
where
concerns the relative position of each rudder in a twin-rudder configuration.
and
were determined from the lift and drag coefficients of single-rudder at angles of attack in the range of 0° and 10°. This range was chosen to minimise the impacts of the strong flow separation around the stall angle. Both rudders in the twin-rudders configuration were positioned at equal distance from the propeller shaft. Therefore,
and
. The applied values of
,
,
and
for single profile were adapted from Liu et al. (Citation2016). Least squares fitting was performed to determine to coefficients in Equation (Equation1
(1) ), using the data presented in . The coefficients of the regression formulas for the lift and drag curves are presented in and , respectively, where R2 is R-squared (coefficient of determination) and σ are root-mean-squared error (standard error) of the regression coefficients.
Table 2. Regression coefficients of the lift coefficients of each rudder in the twin-rudder configurations.
Table 3. Regression coefficients of the drag coefficients of each rudder in the twin-rudder configurations.
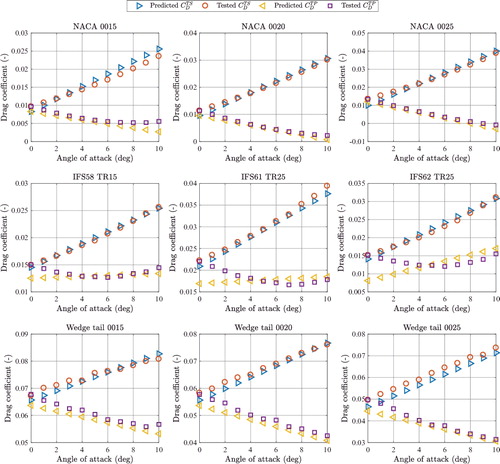
The surface fitting and related residuals of the regression formulas with the coefficients in and are presented in for the NACA 0018 profile as an example. The regression formulas are then used for different profiles at yTR = 0.5 CR and yTR = 1.0 CR and compared with the RANS results in –, respectively. The comparison shows that the equations presented can be used to estimate hydrodynamic coefficients for the profile series considered in this study.
Figure 18. Surface fitting of the lift and drag coefficients of the NACA 0018 profile with different spacing. (a) Surface fitting of the lift coefficient., (b) residuals of the lift coefficient fitting., (c) surface fitting of the drag coefficient. and (d) residuals of the drag coefficient fitting. This figure is available in colour online.
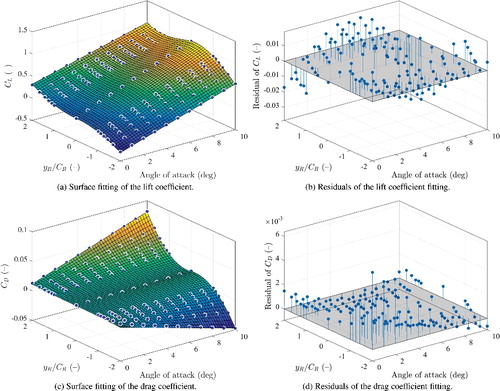
Figure 19. Comparison of predicted and tested lift coefficients of different profiles in the twin-rudder configuration with yTR = 0.5 CR. This figure is available in colour online.
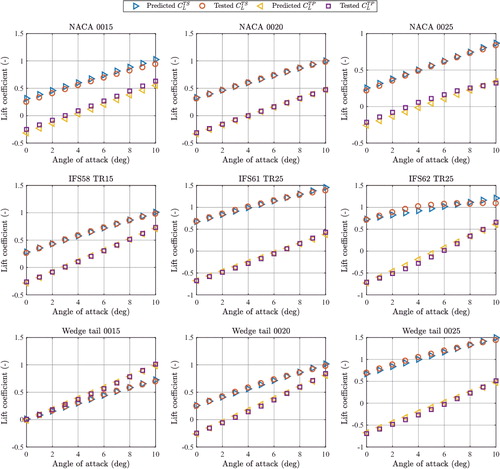
Figure 20. Comparison of predicted and tested drag coefficients of different profiles in the twin-rudder configuration with yTR = 0.5 CR. This figure is available in colour online.
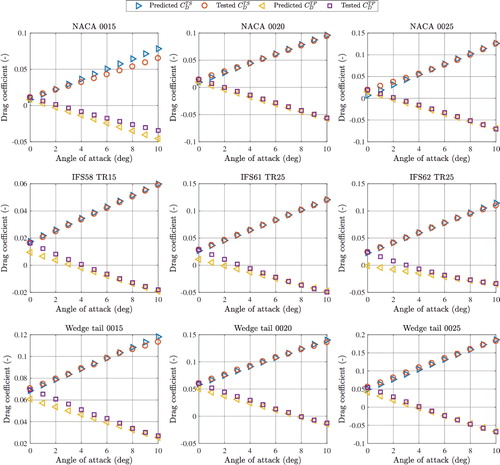
Figure 21. Comparison of predicted and tested lift coefficients of different profiles in the twin-rudder configuration with yTR = 1.0 CR. This figure is available in colour online.
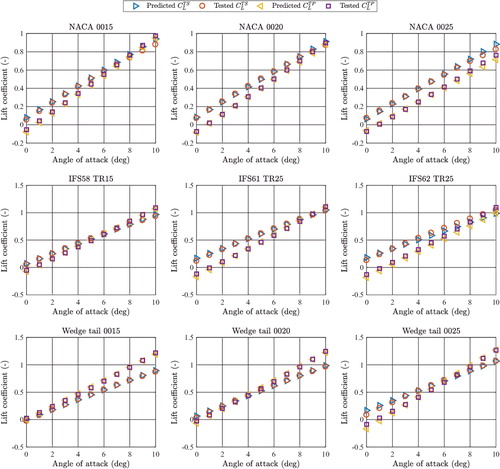
Figure 22. Comparison of predicted and tested drag coefficients of different profiles in the twin-rudder configuration with yTR = 1.0 CR. This figure is available in colour online.
8. Conclusions and recommendations
In this paper, the impacts of the spacing and the profile on twin-rudder and quadruple-rudder configurations were analysed through series of RANS simulations. A regression study was performed to predict lift and drag coefficients of each rudder in twin-rudder configurations using single-rudder hydrodynamic coefficients. The primary conclusions are summarised as follows:
| (1) | For open water, an increase in yTR increases the total lift coefficient, the total drag coefficient, the total lift to drag ratio, and the total normal force coefficient. Therefore, both the efficiency and the effectiveness of the twin-ruder system improve as the rudders are placed further apart. | ||||
| (2) | Different rudder profiles have different hydrodynamic characteristics. However, the profile does not significantly affect the tendency of the impacts of yTR on the twin-rudder hydrodynamics. The significance of the interaction effect is primarily determined by the spacing. | ||||
| (3) | As yTR and yTU increase, the total lift coefficient, the total lift to drag coefficient, and the total normal force coefficients of a quadruple-rudder configuration in open water increase while the total drag coefficient decreases. Therefore, the efficiency and the effectiveness of the quadruple-rudder system improves as yTR and yTU get larger. | ||||
| (4) | Regression formulas for the lift and drag coefficients of each rudder in twin-rudder configurations are proposed in Equation (Equation1 | ||||
The present study included open water tests in 2D in order to specifically study the effect of rudder spacing on the interaction effects between rudders. In practical cases, the rudders are either inside or outside the propeller outflow depending on the spacing. Furthermore, streamline contraction imposed by propeller action also affects the flow around the rudders. In order to enhance the model presented in this paper as well as to obtain better insights into the characteristics of multi-rudders systems, these effects are recommended to be invested in the future.
Acknowledgments
The first author Jialun Liu is financed by the China Scholarship Council under Grant 201206950025.
Disclosure statement
No potential conflict of interest was reported by the authors.
Additional information
Funding
References
- Badoe CE, Phillips AB, Turnock SR. 2015. Influence of drift angle on the computation of hull-propeller-rudder interaction. Ocean Eng. 103:64–77.
- Eleni DC, Athanasios TI, Dionissios MP. 2012. Evaluation of the turbulence models for the simulation of the flow over a National Advisory Committee for Aeronautics (NACA) 0012 airfoil. J Mech Eng Res. 4:100–111.
- Felli M, Falchi M. 2011. Propeller tip and hub vortex dynamics in the interaction with a rudder. Exp Fluids. 51:1385–1402.
- Gim OS. 2013. Assessment of flow characteristics around twin rudder with various gaps using PIV analysis in uniform flow. Ocean Eng. 66:1–11.
- Harvald SA. 1983. Resistance and propulsion of ships. New York (NY): John Wiley & Sons.
- Ladson CL. 1988. Effects of independent variation of Mach and Reynolds numbers on the low-speed aerodynamic characteristics of the NACA 0012 airfoil section. Hampton (VA): Langley Research Center.
- Liu J, Hekkenberg R. 2016. Sixty years of research on ship rudders: effects of design choices on rudder performance. Ships Offshore Struct. 1–18. doi: 10.1080/17445302.2016.1178205
- Liu J, Quadvlieg F, Hekkenberg R. 2016. Impacts of the rudder profile on manoeuvring performance of ships. Ocean Eng. 124:226–240.
- Molland AF, Turnock SR. 2007. Marine rudders and control surfaces: principles, data, design and applications. 1st ed. Oxford: Elsevier Butterworth-Heinemann.
- Quadvlieg F. 2013. Theoretische Berekening van Simulatiemodellen voor Binnenvaartschepen ten Behoeve van Maatgevende Manoeuvres [Theoretical calculations of simulation models for the purpose of inland normative manoeuvres]. Wageningen: Maritime Research Institute Netherlands (MARIN). (in Dutch).
- Shen H, Obwogi EO, Yumin S. 2016. Scale effects for rudder bulb and rudder thrust fin on propulsive efficiency based on computational fluid dynamics. Ocean Eng. 117:199–209.
- Thieme H. 1965. Design of ship rudders (Zur Formgebung von Shiffsrudern). Washington (DC): Shipbuilding Institute, University of Hamburg.
- Van Nguyen T, Ikeda Y. 2014. A numerical study on 3D effects of marine rudder by using CFD. In: 3rd International Symposium of Maritime Sciences. Kobe. p. 95–100.
- Vantorre M. 2001. Stationary and non-stationary open water rudder tests. In: Kijima K, editor. Mini Symposium on Prediction of Ship Manoeuvring Performance; 2001 Oct 18; Tokyo. Tokyo: Japan Marine Dynamics Research Sub-Committee. p. 103–111.