
 ?Mathematical formulae have been encoded as MathML and are displayed in this HTML version using MathJax in order to improve their display. Uncheck the box to turn MathJax off. This feature requires Javascript. Click on a formula to zoom.
ABSTRACT
Gravity-based offshore foundations generally consist of a bottom slab and one or more cylindrical shafts on top of it. The slab geometry can strongly affect the surrounding flow pattern, dynamic wave pressure distribution and further momentary soil liquefaction. In the present study, the effects of the slab geometry and the incoming wave angle to the foundations on the surrounding soil response are investigated. Gravity-based foundations with bottom slabs of cylindrical shape and hexagonal prismatic shape are considered. For the hexagonal foundation, two different incoming wave angles, i.e. propagating to the hexagon corner and the edge, are simulated. The waves are fully nonlinear steep non-breaking waves. The wave-structure interaction is validated against an existing experiment. Soil consolidation behaviour underneath the foundations is investigated. It is found that both the slab geometry and the incoming wave angle can affect the distributions of pore pressure and momentary liquefaction depth in the surrounding soil.
1. Introduction
Offshore foundations are installed in an environment that may encounter steep and nonlinear waves. The wave-induced soil liquefaction around the offshore foundations may cause severe soil and further structure failures. The prediction of the wave-induced soil response and liquefaction risk around the offshore foundation is critical in the engineering design. In the recent years, most of the wave-structure-seabed interaction studies have focussed on the coastal and offshore structures such as breakwaters (Jeng Citation1997; Ulker et al. Citation2010; Ye Citation2012b; Celli et al. Citation2019) and monopile foundations (Li et al. Citation2011; Chang and Jeng Citation2014; Zhang et al. Citation2015; Sui et al. Citation2016; Lin et al. Citation2017; Zhao et al. Citation2017; Zhu et al. Citation2018), but very few literature studies have considered the wave-structure-seabed interaction of gravity-based foundations with more complex three-dimensional geometries. Recently, Li et al. (Citation2018) studied the seabed consolidation and liquefaction around a hexagonal foundation using an integrated wave-structure-seabed interaction model developed in OpenFOAM. Stokes wave theories were applied to model the incoming waves in their work. As an extension to their study, the present work focuses on the investigation of the steep, non-breaking wave-induced soil response and liquefaction risk around gravity-based foundations of different geometries and incoming wave angles. The incoming waves in the present study are fully nonlinear and are modelled by fifth-order stream functions, according to Rienecker and Fenton (Citation1981) and Fenton (Citation1988). The nonlinear wave-structure interaction model is validated by comparing the free-surface elevation and the inline force with the experimental data conducted by Grue and Huseby (Citation2002). The wave-seabed interaction model has been validated in the work of Li et al. (Citation2018) by reproducing the laboratory experiment of Tsai and Lee (Citation1995) of standing wave induced pore pressure under a vertical wall. A good agreement was obtained.
In the present work, gravity-based foundations with bottom slabs of cylindrical shape (a circular foundation) and hexagonal prismatic shape (a hexagonal foundation) are investigated. Fine-grained sandy seabed is modelled. At first, the soil consolidation states in the presence of the foundations in the static water are assessed. The initial effective stress in the soil is calculated. Then, the nonlinear waves are imposed. The nonlinear wave-induced pore pressure and liquefaction depth around the foundations are investigated for the hexagonal and circular foundations. For the hexagonal foundation, two different incoming wave angles with 0 degrees and 90 degrees, i.e. waves propagate to the hexagon corner and to the hexagon edge, are considered. The effect of the incoming wave angle on the liquefaction distribution around the hexagonal foundation is investigated.
2. Mathematical models and the coupling algorithm
2.1. Free surface wave model
The wave domain is governed by the incompressible Navier-Stokes equations including the continuity equation and the momentum equations.(1)
(1)
(2)
(2) where
is the velocity vector with three components in the x,y,and z directions respectively;
is the gravitational acceleration; ρ is the fluid density, p is the pressure and
(in Einstein notation
) is the viscous stress tensor. For Newtonian fluid,
(3)
(3) where μ is the dynamic molecular viscosity
is defined by
(4)
(4) where
[1,2,3].
and
are the velocity components in x, y and z direction respectively.
The equations are solved for the two immiscible fluids, i.e. air and water simultaneously. The fluids are tracked by using a scalar field α. for air and
for water. The distribution of α is modelled by an advection equation
(5)
(5) The last term on the left-hand side is a compression term, which limits the smearing of the interface, and
is a relative velocity which can be referred to Berberović et al. (Citation2009).
Using α, the spatial variation in any fluid property can be expressed through the weighting(6)
(6) Φ is a fluid property, such as μ and ρ.
2.2. Linear elastic structure model
The structure domain is governed by a linear momentum balance equation,(7)
(7) and the isotropic linear elastic strain-displacement relations
(8)
(8) where
is the stress tensor;
is the small strain tensor;
is the structural displacement vector consisting of three coupled components.
is the trace of an square matrix which is the sum of the elements on the main diagonal,
. μ and λ are the Lamé's coefficients of elastic material properties which relate to commonly used Young's modulus E and Poisson's ratio ν. The finite volume-based solution to the coupled equations can be referred to the work of Jasak and Weller (Citation2000) and Li et al. (Citation2018).
2.3. Anisotropic Biot's poro-elastic soil model
The seabed model is based on assumptions that the sandy seabed is horizontally flat, fully saturated, with anisotropic permeabilities in vertical and horizontal directions. The soil skeleton generally obeys Hooke's law with elastic properties, therefore the classical Biot's consolidation equations (Biot Citation1941) can be adopted. For anisotropic soil materials, the orthotropic elastic stress-strain relation can be expressed in a 6 × 6 matrix notation:(9)
(9) where
is the effective stress tensor. In the present work, tension is taken as positive while compression is taken as negative. According to Demirdžić et al. (Citation2000), the 9 independent coefficients
are calculated from Young's modulus
and Poisson's ratio
and shear modulus
. The calculation of the coefficients
can be referred to Li et al. (Citation2018).
The soil domain is governed by a quasi-static momentum balance equation and a mass balance equation based on Darcy's law.
Quasi-static momentum balance equation for the soil mixture is expressed as:(10)
(10) where
is the soil (skeleton) displacement, p is the pore fluid pressure and
is the fourth-order elastic stiffness tensor.
Mass balance equation for the pore fluid is expressed as:(11)
(11) where n is the soil porosity,
is the specific weight of water in soil, and
is the diagonal permeability tensor with values of
,
and
. The bulk modulus of the compressible pore flow
is approximately computed by the formulation Vafai and Tien (Citation1981):
(12)
(12) where
is the degree of soil saturation,
is the bulk modulus of pure water and
is the absolute pore water pressure.
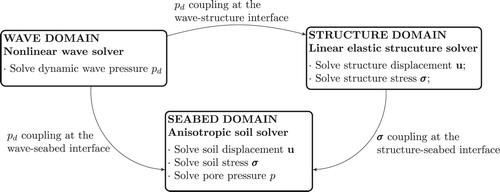
The wave, structure and seabed domains are coupled by the data transfer at the common boundaries. A one-way coupling algorithm is adopted, as illustrated in . The data is transferred in a single direction and the structure and seabed deformations do not alter the wave domain. This is because that the present study is focussed on the steep wave-induced momentary liquefaction, which means the phenomenon that investigated is an instantaneous phenomenon. Therefore, the time-dependent effect of wave-induced structure vibration on the wave and seabed domains and the effect of seabed deformation on the structure and wave domains are neglected.
Figure 1. One-way boundary coupling algorithm of wave-structure-seabed interaction.
3. Model validation
3.1. Validation of nonlinear wave-structure interaction
The present nonlinear wave-structure interaction model is validated against the experiment conducted by Grue and Huseby (Citation2002). Their test of regular steep waves propagating towards a vertical circular cylinder (Figures 3(c,d) in Grue and Huseby (Citation2002)) is reproduced. The free surface elevation and the inline force on the cylinder are compared between the present numerical simulation and the experimental data. The parameter setting for reproducing the experiment is shown in . D is the diameter (characteristic length) of the cylinder, is the water depth,
is the wave crest elevation and k is the wave number. The fully nonlinear stream function wave theory is used in the numerical wave generation. A slip boundary condition is set at the cylinder surface and the seabed. The number of grid points for the free surface is 32 in the present study.
Table 1. Parameters of the steep wave propagation experiment of Grue and Huseby (Citation2002).
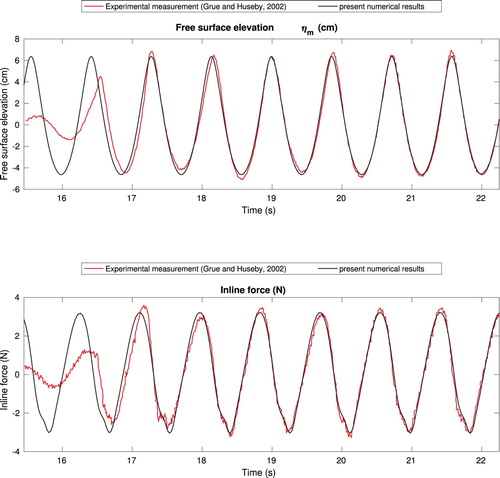
presents the comparison between the numerical results and the experimental measurements. Both the free surface elevation and the inline force are in good agreement (converging to 1–3% discrepancy as the waves develop). The experimental measurement contains second-order spurious waves from first-order wave generation. In the numerical simulation, the second-order spurious waves are avoided in the fully nonlinear stream function wave model, as pointed out by Paulsen et al. (Citation2014).
Figure 2. Validation study of nonlinear wave propagation to a vertical structure by comparing to the experimental data of Grue and Huseby (Citation2002).
3.2. Validation of wave-seabed interaction
The present wave-induced seabed response model has been validated in the work of Li et al. (Citation2018). The experiment performed by Tsai and Lee (Citation1995) of standing wave-induced soil response in the vicinity of a vertical wall was reproduced. It showed that the present numerical results are in good agreement with the measured data.
4. Model application
4.1. Numerical settings
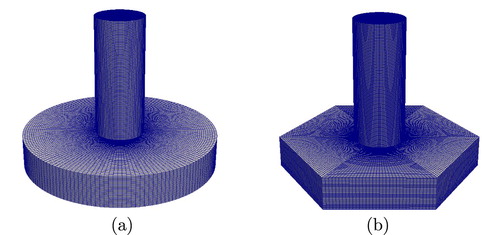
The present work focuses on two types of gravity-based foundations. The geometries of the foundations are shown in .
Figure 3. Geometries and meshes of the structures. (a) Foundation with cylindrical slab and (b) Foundation with hexagonal prismatic slab.
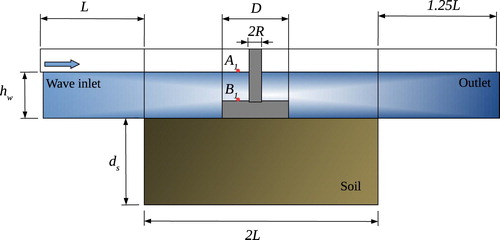
The entire multiphysics numerical system is established in the 3D Cartesian coordinate system. is located at the undisturbed free surface. x positive towards the wave propagation direction, y positive towards the side of the tank, and z positive upwards. The layout of the numerical system is shown in . The wave inlet relaxation zone (Jacobsen et al. Citation2012) is set to be one wave length. The wave outlet relaxation zone is set to 1.25 wave lengths to absorb waves and ensure no reflection from the outlet boundary. The width of the wave tank (distance between the sides of the tank) is set to be two wave lengths.
Figure 4. A sketch of the numerical layout for the wave-structure-seabed interaction model.
gives the parameter settings in the present work. The water depth is , the wave height is
and the wave period is
. According to Le Méhauté (Citation2013), the present wave condition exceeds the modelling ranges of linear wave theory and Stokes wave theory. It should be modelled by using the fifth-order stream function theory (Dean Citation1965; Fenton Citation1988) for the steep non-breaking waves. The Keulegan-Carpenter number (KC number) (Journée and Massie Citation2000) for the simulated condition is 1.70, which is a small value that indicates the drag force which comes from the viscosity is negligible compared to inertial forces. Hence, turbulence modelling is not considered.
Table 2. Parameter settings for wave-structure-seabed interaction modelling in the present study.
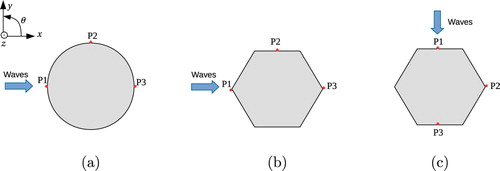
For the hexagonal foundations, two wave angles are considered in terms of waves come towards the hexagon corner (wave angle of 0 degrees) and waves come towards the hexagon edge (wave angle of 90 degrees), respectively. As shown in , three points P1, P2 and P3 around the foundation are identified. The characteristic length of the foundation D is defined as the distance between P1 and P3.
Figure 5. Top views of waves incoming to the circular and hexagonal foundations. (a) circular foundation (wave angle ). (b) hexagonal foundation (wave angle
) and (c) hexagonal foundation (wave angle
).
4.2. Boundary conditions
Boundary conditions for the multiphysics model are specified as follows.
Wave domain:
At the inlet boundary, the velocity is specified as the input wave velocity. At the outlet boundary, the velocity is set to zero. At four sides of the numerical wave tank, the normal gradient of the pressure is set to zero, i.e. . At the atmosphere, the pressure is set to be atmosphere pressure
. At the wave-structure interface and the wave-seabed interface, slip velocity boundary is set since the viscous effects at the walls are negligible.
Structure domain:
The structure transfers the dynamic wave loading to the seabed. At the wave-structure interface, the nonuniform and time-varying dynamic wave pressure is imposed on the structure. At the structure-seabed interface, the instantaneous structural stress is read by the soil solver to compute the compatible time-varying displacement gradient boundary for the seabed.
Seabed domain:
At the wave-seabed interface, the soil has zero effective shear stress while the pore pressure is equal to the dynamic wave pressure. At the structure-seabed interface, it is considered that the structure is impermeable. Thus, the pore pressure has zero normal gradient, according to Darcy's flow equation. At the bottom and lateral boundaries of the seabed, a slip boundary is applied for the soil skeleton. The normal pore pressure gradient is zero.
5. Results and discussions
5.1. Consolidation
Once the structure is placed on the seabed, the gravitational forces will induce the compression of the soil skeleton and the gradual dissipation of the excess pore pressure. The soil consolidation behaviour will further affect the potential risk of wave-induced soil liquefaction (Ulker et al. Citation2010; Sui et al. Citation2017; Zhao et al. Citation2017). Therefore, it is essential to do consolidation analysis before investigating the momentary liquefaction of the seabed around the foundations. In the present work, the consolidation process is simulated for each type of the structure. According to the 1D Terzaghi's consolidation theory, the time for completing 90% consolidation can be expressed as Wang (Citation2017):(13)
(13) where
is the drainage distance of the layer,
is the vertical consolidation time factor for 90% consolidation,
is the consolidation coefficient calculated by
(14)
(14) where
is the vertical permeability and
is the bulk specific weight of the pore water. In the present study, the longest time for reaching the 90% consolidation state is estimated as 3230 s.
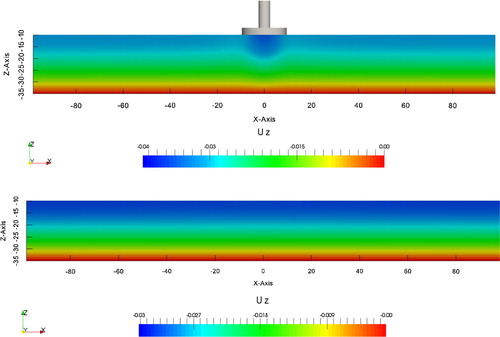
shows the vertical soil displacement after the completion of the consolidation in the presence of the circular foundation. A negative value of
means the soil skeleton is compressed and moving downward. It is seen that around the foundations, the soil skeleton has been largely compressed. Compared to the circumstance without a structure, the presence of the foundation changes the surrounding soil displacement behaviour.
Figure 6. Initial vertical displacement (m) of the seabed after the completion of the consolidation with and without the circular foundation.
presents the distribution of the initial vertical effective stresses in the soil after the consolidation process. A negative value of
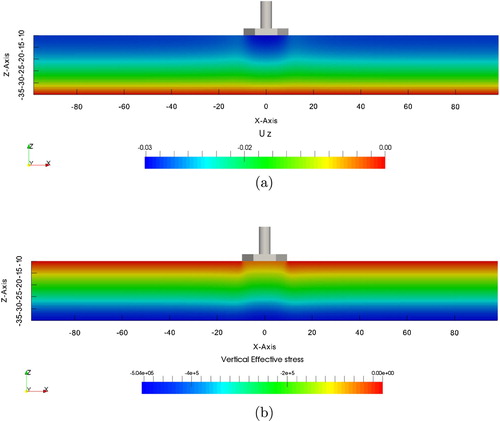
indicates the compression of the soil skeleton. In the long-time consolidation process, the gravity forces gradually transfer to the supporting soil skeleton. It shows that the initial vertical effective stress below the foundation is amplified compared to the far field. Similar soil consolidation behaviour can be observed in the presence of the hexagonal foundation, as shown in (a,b).
Figure 7. Initial vertical effective stress (N/m) in the seabed after the completion of the consolidation with and without the circular foundation.
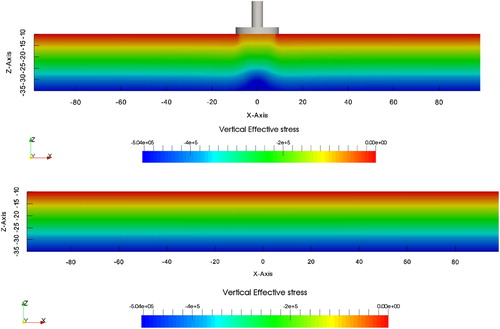
Figure 8. Initial vertical displacement (m) and initial vertical effective stress (N/m) in the seabed after the completion of the consolidation with the hexagonal foundation. (a) Initial vertical displacement (m) of the seabed beneath the hexagonal foundation and (b) Initial vertical effective stress (N/m
) in the seabed beneath the hexagonal foundation.
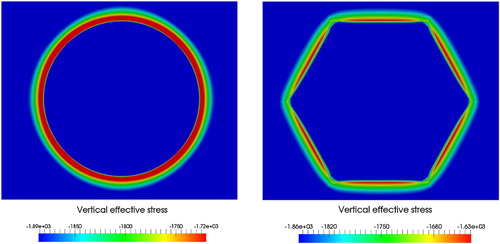
A cross-sectional view of vertical soil effective stress at (0.1 m below the seabed surface) is shown in . It is observed that for the circular foundation, the initial vertical effective stress is evenly distributed in the surrounding soil. However, for the hexagonal foundation, the compressive stress at the corners is higher than that at the edges. This is because that the sharp corners of the hexagon cause stress concentration in the soil. The initial vertical effective stress
at the end of the consolidation process will be used as an initial condition to evaluate the momentary liquefaction risk.
Figure 9. A cross-section of the initial vertical effective stress (N/m) of the seabed after the completion of the consolidation at 0.1 m below the seabed surface (
).
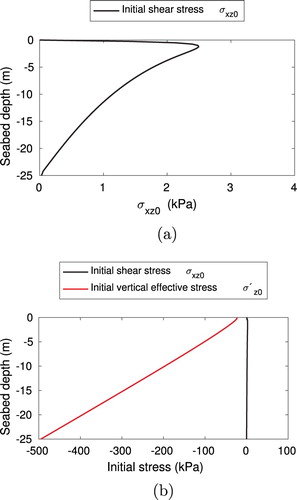
It is worthwhile to mention that the ‘pre-shear history’ of sand may have effect on its liquefaction resistance. Ye et al. (Citation2015) studied the liquefaction risk of the sand with different initial shear stress (
correspond to clockwise shear load). They found that a high initial shear stress ratio (i.e.
/ mean effective stress) can speed up the liquefaction process. However, in the present study, the initial shear stress that is triggered by the consolidation process is negligible compared to the initial vertical effective stress. As shown in , the magnitudes of initial shear stress
and initial vertical effective stress
beneath the corner of the hexagonal foundation are compared. It is observed that the magnitude of
is negligible compared to
, which means that the initial shear stress ratio is very small. Therefore, the effect of ‘pre-shear history’ of sand on the liquefaction analysis is not considered in the present work.
Figure 10. Vertical distributions of initial shear stress and initial vertical effective stress after the consolidation process. It is observed that the magnitude of is negligible compared to
. (a) Initial shear stress
beneath the corner of the hexagonal foundation and (b) Comparing the magnitudes of initial shear stress
and initial vertical effective stress
beneath the corner of the hexagonal foundation.
5.2. Nonlinear wave-induced soil response
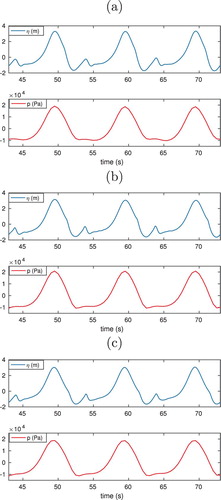
Nonlinear steep waves are imposed on the structure and seabed. presents the time histories of free surface elevation at the location A1 and the corresponding bottom wave pressure at B1. The locations of the points are shown in . It is observed that the interaction between the waves and the foundations triggers strong nonlinearity of free surface elevation. It affects the bottom wave pressure, which shows a similar nonlinear effect.
Figure 11. Time histories of the free surface elevation and the corresponding bottom wave pressure. (a) circular foundation (wave angle ). (b) hexagonal foundation (wave angle
) and (c) hexagonal foundation (wave angle
).
The wave diffraction effect causes various pore pressure distributions at different locations around the foundation. According to Li et al. (Citation2018), the soil beneath the foundation is shielded from the dynamic waves, so that the pore pressure underneath the foundation bottom has relatively small variations. Therefore, liquefaction is less likely to happen under the foundation bottom. The present work focuses on investigating the pore pressure distribution around the foundations. The vertical profiles of transient pore pressure at three typical locations surrounding the foundation are shown in . P1 is at the upstream side of the foundation when waves first hit the surface of the foundations. P2 is at the location of 90 degrees from the upstream. P3 is at the downstream side of the foundation.
Figure 12. Transient pore pressure distribution at two time instants around the offshore foundations. (a) Transient pore pressure distribution around the circular foundation. (b) Transient pore pressure distribution around the hexagonal foundation with 0 degrees incoming waves and (c) Transient pore pressure distribution around the hexagonal foundation with 90 degrees incoming waves.
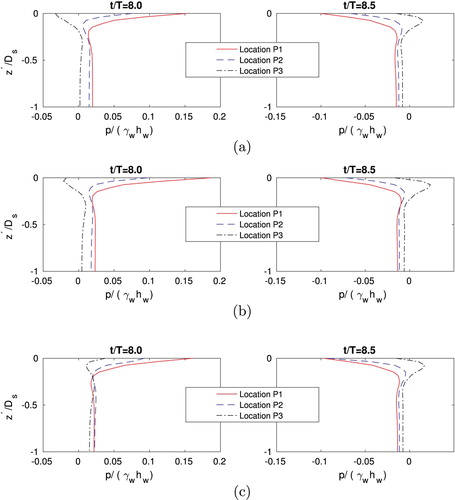
In , vertical pore pressure profiles at time instants of and
are presented. The vertical distance to the seabed surface
is normalised by the seabed thickness
. shows that the magnitude of pore water pressure decreases rapidly from the seabed surface to approximately
. Then, the magnitude remains almost unchanged until to the seabed bottom (
). Comparing between the three curves in each sub-figure, it is observed that the pore pressure profiles at P1 (upstream) has the highest changes from the seabed surface to a depth at
. This indicates that the pore pressure gradient at the upstream of the foundations are generally higher than that at the downstream of the foundations. Therefore, the liquefaction risk at the upstream can be relatively higher. The same phenomenon is found in the work of Lin et al. (Citation2017). Their study showed that the liquefaction depth at the upstream side of the monopile is around 15–20% higher than that at the downstream side. However, this conclusion can only be drawn when the soil consolidation process is not considered. In fact, when the structure is placed on the seabed, the effective stress in the surrounding soil can significantly increase, which further influences the momentary liquefaction depth around the foundation (Ulker et al. Citation2010; Sui et al. Citation2017; Zhao et al. Citation2017).
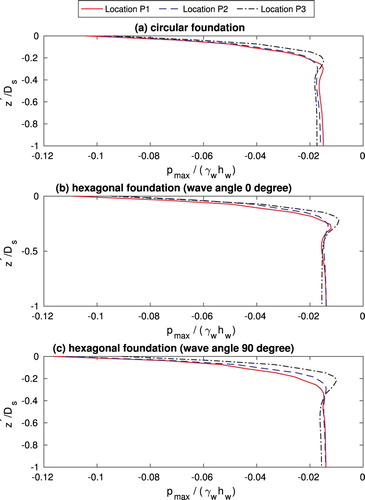
Momentary liquefaction happens periodically under the wave trough. At this moment, upward seepage flows are generated. shows the vertical distribution of the maximum amplitude of negative pore pressure within a wave cycle. It is observed that, when incoming waves are perpendicular to the edge of the hexagonal foundation ((c)), the vertical gradient of the pore pressure is the highest among the three cases. In (b), incoming waves first hit the corner of the hexagon. The pore pressure and vertical pore pressure gradient at location P1 are smaller than that in (c). This is because when waves hit the corner, the change of wave velocity in the wave propagating direction is smaller than when waves hit the edge. In the latter case, when waves hit the edge of the hexagon, the wave velocity component perpendicular to the edge becomes zero, so that the pressure is significantly increased. For the circular foundation, the change of the wave velocity is milder when waves diffract around the circular geometry, so that the pore pressure gradient around the circular foundation is generally smaller than that around the hexagonal foundations.
Figure 13. Vertical distribution of the amplitude of the negative pore pressure.
Based on the discussion above, the upstream of the hexagonal foundations can experience a higher pore pressure gradient than the circular foundation. If the initial effective stress caused by the seabed consolidation process is not considered, the liquefaction risk at the upstream of the hexagonal foundation should be higher than that at the upstream of the circular foundation.
5.3. Liquefaction
So far in the literature, various liquefaction criteria for investigating the momentary liquefaction have been proposed based on the either the effective stress (Okusa Citation1985; Tsai Citation1995), or the excess pore pressure (Zen and Yamazaki Citation1990; Jeng Citation1997). Ye (Citation2012a) performed a comparison study of different liquefaction critera. For the liquefaction analysis considering the seabed consolidation around a marine structure, a modified criterion based on Zen and Yamazaki (Citation1990) is recommended. The criterion is given in Equation (Equation15(15)
(15) ).
(15)
(15) where
is the initial vertical effective stress induced by the gravitational forces from the consolidation process.
Maximum liquefaction depth in a wave cycle around the hexagonal foundations and the circular foundation are presented in . It is seen that for the circular foundation, the liquefaction depth is approximately averagely distributed around the circular foundation. The upstream side has a sightly higher liquefaction depth than the downstream side. The reason is explained in Section 5.2.
Figure 14. Maximum liquefaction depth (m) in a wave cycle around the circular foundation (a) and the hexagonal foundations (b,c).
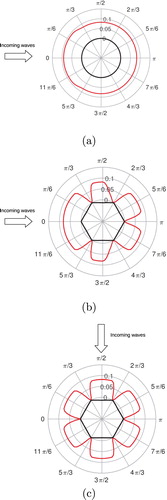
For the hexagonal foundations, the initial soil effective stress around the corners is higher than that around the edges, so that liquefaction is less likely to happen around the hexagon corners, as shown in (b,c). However, when incoming waves propagate towards the hexagon corner ((b)), the high pore pressure gradient can cause notable upward seepage flow. Therefore, liquefaction happens at the upstream corner in (b). When incoming waves propagate to the hexagon edge, as shown in (c), no liquefaction is observed at the hexagon corners.
In the real ocean environment, the waves are nonuniform and non-unidirectional, so that both the corners and edges of the hexagonal foundation can experience liquefaction and therefore need specific protections. Chang and Jeng (Citation2014) studied the seabed protection methodology and suggested to replace the existing layers of the surrounding soil with materials of higher permeability to mitigate the liquefaction risk. It is noted that the process of soil liquefaction can be closely related to scour. In the experiment by Sumer et al. (Citation2007), liquefaction and scour around a monopile were observed in one experiment. As discussed in Whitehouse (Citation1998), since a liquefied bed has almost no shear strength, the sediment can be eroded more easily than a non-liquefied bed. In the engineering practice, gravity-based structures are usually fitted with a skirt to prevent the hydraulic process of scour channels penetrating underneath the structure.
6. Conclusions
The present study has investigated the soil consolidation, steep wave-induced soil response and the momentary liquefaction risk around gravity-based offshore foundations. Two different geometries are considered in terms of a circular foundation and a hexagonal foundation. For the hexagonal foundation, two different incoming wave angles are investigated in terms of waves come towards the hexagon corner and waves come towards the hexagon edge. A 3D FVM-based wave-structure-seabed interaction model has been applied. The nonlinear wave-structure interaction model and wave-seabed interaction model have been validated against existing experimental data. Good agreement has been obtained. An anisotropic poro-elastic model has been applied for the soil analysis. The following conclusions can be drawn from the present study:
The presence of the foundations on the seabed leads to the compression of the soil in the vicinity of the structure during the consolidation process. The initial vertical effective stress in the surrounding soil is increased. The slab geometry of the foundation affects the initial effective stress distribution. For the circular foundation, the initial vertical effective stress is evenly distributed in the surrounding soil. However, for the hexagonal foundation, the geometry triggers stress concentration in the soil around the corners. The compressive stress at the corners is much higher than that at the edges.
Generally, when waves propagate towards the foundations, the pore pressure gradient at the upstream of the foundations is higher than that at the downstream. Therefore, the liquefaction risk at the upstream of the foundation can be relatively higher. This is due to the wave diffraction effect.
For the circular foundation, the liquefaction depth is approximately averagely distributed around the circular foundation, except that the upstream side has a sightly higher liquefaction depth than the downstream side. For the hexagonal foundations, the distribution of the initial soil effective stress from the consolidation process affect the liquefaction zone distribution. The momentary liquefaction is less likely to happen around the hexagon corners due to high initial effective stress.
Wave direction affects the pore pressure and the liquefaction distribution around the hexagonal foundation. When incoming waves propagate towards the hexagon corner, the high pore pressure gradient can cause notable upward seepage flow. Although the initial effective stress at the hexagon corners is high, significant upward excess pore pressure can still trigger liquefaction around the upstream corner. However, when incoming waves propagate
to the hexagon edge, no liquefaction is observed at the hexagon corners.
In the real ocean environment, the waves are nonuniform and non-unidirectional, so that both the corners and edges of the hexagonal foundation can experience liquefaction and therefore need liquefaction protections.
More experimental data is required before a final conclusion can be given. Meanwhile, the present method could be useful as an engineering tool for predicting the wave-induced soil response and momentary liquefaction risk around offshore foundations.
Acknowledgements
This study was supported in part with computational resources provided by the Norwegian Metacenter for Computational Science (NOTUR), under Project No: NN9372K.
Disclosure statement
No potential conflict of interest was reported by the authors.
References
- Berberović E, van Hinsberg NP, Jakirlić S, Roisman IV, Tropea C. 2009. Drop impact onto a liquid layer of finite thickness: dynamics of the cavity evolution. Phys Rev E. 79(3):036306.
- Biot MA. 1941. General theory of three-dimensional consolidation. J Appl Phys. 12(2):155–164.
- Celli D, Li Y, Ong MC, Di Risio M. 2019. The role of submerged berms on the momentary liquefaction around conventional rubble mound breakwaters. Appl Ocean Res. 85:1–11.
- Chang K-T, Jeng D-S. 2014. Numerical study for wave-induced seabed response around offshore wind turbine foundation in donghai offshore wind farm, shanghai, china. Ocean Eng. 85:32–43.
- Dean RG. 1965. Stream function representation of nonlinear ocean waves. J Geophys Res. 70(18):4561–4572.
- Demirdžić I, Horman I, Martinović D. 2000. Finite volume analysis of stress and deformation in hygro-thermo-elastic orthotropic body. Comput Methods Appl Mech Eng. 190(8):1221–1232.
- Fenton J. 1988. The numerical solution of steady water wave problems. Comput Geosci. 14(3):357–368.
- Grue J, Huseby M. 2002. Higher-harmonic wave forces and ringing of vertical cylinders. Appl Ocean Res. 24(4):203–214.
- Jacobsen NG, Fuhrman DR, Fredsøe J. 2012. A wave generation toolbox for the open-source cfd library: openfoam®. Int J Numer Methods Fluids. 70(9):1073–1088.
- Jasak H, Weller H. 2000. Application of the finite volume method and unstructured meshes to linear elasticity. Int J Numer Methods Eng. 48(2):267–287.
- Jeng D-S. 1997. Wave-induced seabed instability in front of a breakwater. Ocean Eng. 24(10):887–917.
- Journée J, Massie W. 2000. Offshore hydromechanics. TU Delft.
- Le Méhauté B. 2013. An introduction to hydrodynamics and water waves. Springer Science & Business Media.
- Li X-J, Gao F-P, Yang B, Zang J. 2011. Wave-induced pore pressure responses and soil liquefaction around pile foundation. Int J Offshore Polar Eng. 21(3):233–239.
- Li Y, Ong MC, Tang T. 2018. Numerical analysis of wave-induced poro-elastic seabed response around a hexagonal gravity-based offshore foundation. Coast Eng. 136:81–95.
- Lin Z, Pokrajac D, Guo Y, Jeng D-s., Tang T, Rey N, Zheng J, Zhang J. 2017. Investigation of nonlinear wave-induced seabed response around mono-pile foundation. Coast Eng. 121:197–211.
- Okusa S. 1985. Wave-induced stresses in unsaturated submarine sediments. Geotechnique. 35(4):517–532.
- Paulsen BT, Bredmose H, Bingham HB, Jacobsen NG. 2014. Forcing of a bottom-mounted circular cylinder by steep regular water waves at finite depth. J Fluid Mech. 755:1–34.
- Rienecker M, Fenton J. 1981. A fourier approximation method for steady water waves. J Fluid Mech. 104:119–137.
- Sui T, Zhang C, Guo Y, Zheng J, Jeng D, Zhang J, Zhang W. 2016. Three-dimensional numerical model for wave-induced seabed response around mono-pile. Ships and Offshore Structures. 11(6):667–678.
- Sui T, Zheng J, Zhang C, Jeng D-S, Zhang J, Guo Y, He R. 2017. Consolidation of unsaturated seabed around an inserted pile foundation and its effects on the wave-induced momentary liquefaction. Ocean Engineering. 131:308–321.
- Sumer BM, Hatipoglu F, Fredsøe J. 2007. Wave scour around a pile in sand, medium dense, and dense silt. Journal of Waterway, Port, Coastal, and Ocean Engineering. 133(1):14–27.
- Tsai C. 1995. Wave-induced liquefaction potential in a porous seabed in front of a breakwater. Ocean Engineering. 22(1):1–18.
- Tsai C-P, Lee T-L. 1995. Standing wave induced pore pressures in a porous seabed. Ocean Engineering. 22(6):505–517.
- Ulker M, Rahman M, Guddati M. 2010. Wave-induced dynamic response and instability of seabed around caisson breakwater. Ocean Engineering. 37(17):1522–1545.
- Vafai K, Tien C. 1981. Boundary and inertia effects on flow and heat transfer in porous media. Int J Heat Mass Transf. 24(2):195–203.
- Wang HF. 2017. Theory of linear poroelasticity with applications to geomechanics and hydrogeology. Princeton University Press.
- Whitehouse R. 1998. Scour at marine structures: a manual for practical applications. Thomas Telford.
- Ye B, Lu J, Ye G. 2015. Pre-shear effect on liquefaction resistance of a fujian sand. Soil Dyn Earthq Eng. 77:15–23.
- Ye J. 2012a. 3D liquefaction criteria for seabed considering the cohesion and friction of soil. Appl Ocean Res. 37:111–119.
- Ye J. 2012b. Numerical analysis of wave-seabed-breakwater interactions [PhD thesis]. University of Dundee.
- Zen K, Yamazaki H. 1990. Oscillatory pore pressure and liquefaction in seabed induced by ocean waves. Soils Found. 30(4):147–161.
- Zhang C, Zhang Q, Wu Z, Zhang J, Sui T, Wen Y. 2015. Numerical study on effects of the embedded monopile foundation on local wave-induced porous seabed response. Math Probl Eng. 2015: Article ID 184621, 13pages.
- Zhao H, Jeng D-S, Liao C, Zhu J. 2017. Three-dimensional modeling of wave-induced residual seabed response around a mono-pile foundation. Coast Eng. 128:1–21.
- Zhu B, Ren J, Ye G-L. 2018. Wave-induced liquefaction of the seabed around a single pile considering pile–soil interaction. Mar Georesour Geotec. 36(1):150–162.