
ABSTRACT
Liquefied Natural Gas (LNG) spills may cause steel to embrittle, leading to the brittle fracture of marine structures due to the cryogenic temperatures. For the integrity assessment of marine steel structures in the event of an LNG spill, first and foremost, an accurate heat transfer analysis is required. This study presents an experimental set-up that allows for thermal-structural analysis of steel structures subject to non-spreading cryogenic spills. A local, non-spreading cryogenic spill was replicated by building a liquid nitrogen (LN2) pool at the central zone of an EH36 steel plate under tensile loading. Six pool boiling tests were conducted on six different specimens. Temperature histories recorded by nine thermocouples are presented and discussed as well as the effect of surface roughness on cooling rates and boiling regimes. Numerical simulations of the experiments, discussed in Part II of this study, resulted in a heat flux curve for EH36 steel-LN2 pool boiling.
Nomenclature
| α | = | thermal diffusivity (mm²/s) |
| cp | = | specific heat capacity (J/kg-K) |
| κ | = | thermal conductivity (W/m-K) |
| λ | = | latent heat of vaporisation |
| q | = | heat flux (W/m2) |
| ρ | = | density (kg/m3) |
| σ | = | surface tension of the liquid (m²/s) |
| T | = | temperature (°C) |
| ΔT | = | temperature difference between cryogenic fluid and steel surface |
| t | = | time (s) |
| υ | = | kinematic viscosity (J/kg) |
| Subscripts | ||
| b | = | boiling |
| g | = | gas phase |
| l | = | liquid phase |
| Acronyms | ||
| CHF | = | Critical Heat Flux |
| DAQ | = | Data Acquisition |
| DBTT | = | Ductile-Brittle Transition Temperature |
| HAZ | = | Heat Affected Zone |
| LN2 | = | Liquid Nitrogen |
| LNG | = | Liquified Natural Gas |
| ONB | = | Onset of Nucleate Boiling |
1. Introduction
Global demand for Liquefied Natural Gas (LNG) as a clean source of energy has been increasing in recent years. LNG transport is mostly performed using LNG ocean carriers (Luketahanlin Citation2006; Horvat Citation2018). Ships are also widely used for the transportation of other liquified gases such as liquefied hydrogen. These liquified gases are cryogenic liquids meaning that they are cooled down below about −150 °C. Liquefied gas leakage from cargo containments or fuel tanks of ships, as well as during bunkering of liquefied gases to vessels or offshore power plants, is a potential risk (Paik et al. Citation2020; Park et al. Citation2020). Such leaks can adversely affect the structural integrity of stiffened steel plates used in ship hulls and offshore structures by embrittling them at cryogenic temperatures (Paik et al. Citation2020). Marine structures tend to develop micro-cracks during the manufacturing process and/or under operation. In the event of a cryogenic spill on such structures, stress concentration at crack tips may initiate a fracture leading to a catastrophic failure.
Numerous studies have been carried out to investigate the risks associated with the spillage of liquefied natural gas. Most of these studies have focused on the behaviour of LNG when spilt on the ground or water, such as rapid phase transition (RPT), deflagration, detonation and subsequent vapour cloud fire or pool fire (Drake et al. Citation1975; Dincer et al. Citation1977; Georgakis et al. Citation1979; Briscoe and Shaw Citation1980; Opschoor Citation1980; Ermak et al. Citation1982; Goldwire et al. Citation1983; McRae et al. Citation1984; Morgan et al. Citation1984; Rodean et al. Citation1984; Gavelli et al. Citation2008; Sun et al. Citation2013; Sun et al. Citation2014; Sun et al. Citation2015; Zhang et al. Citation2015; Sun et al. Citation2017; Horvat Citation2018; Kumar et al. Citation2021). On this account, knowledge about the structural performance of steel members subject to the spillage of cryogenic liquids is limited. A few studies in recent years have investigated the structural behaviour of steel at low temperatures (Berejnoi and Ipiña Citation2015; Majzoobi et al. Citation2016; Bruchhausen et al. Citation2017; Paik et al. Citation2017; Nam et al. Citation2018; Li et al. Citation2019; Paik et al. Citation2020). These studies confirmed the risk of ductile-to-brittle fracture transition in steel at cryogenic temperatures, which might lead to disastrous structural failures in LNG carriers and offshore structures. However, they have not performed any heat transfer analysis, which is a challenging and crucial part of the coupled thermal-stress analysis of structures in the event of an accidental LNG release. An accurate heat transfer analysis is essential to obtain the right temperature field for a correct integrity assessment of such structures, in part because the mechanical properties of steel are significantly affected by temperature. Besides, the temperature field is required to estimate the thermal stresses due to the local cooldown of the structure. The present study has been carried out to provide further insight into the modelling of the heat transfer phenomenon in the coupled thermal-stress analysis of steel structures locally affected by accidental spills of liquefied gases.
The paper is presented in two parts. Part I, reported herein, covers the experimental study which includes six pool boiling tests on EH36 steel plates using LN2 as the cryogenic liquid. The computational modelling of the pool boiling tests is given in Part II, where an in-depth heat transfer analysis is carried out to scrutinise the uncertainties involved in the finite element thermal analysis of the problem. The primary reason for conducting the pool boiling tests was to understand the structural response and the fracture behaviour of unstiffened steel plates in cryogenic temperatures. Therefore, in addition to the temperature histories, the reaction forces of the specimens were measured during the pool boiling tests. The thermal analysis is reported herein, and the structural study including the details of fatigue crack development and fracture initiation will be discussed in another paper in the near future. Currently, there is no framework for experimental investigation of the thermal-structural performance of steel structures subject to cryogenic spills. The experimental set-up presented in this study may provide a guide for future studies in the field.
Several heat flux curves for LN2 have been reported in the literature (Dabiri Citation1986; Liu et al. Citation2015; Barron and Nellis Citation2017; Nguyen et al. Citation2020; Nguyen et al. Citation2020) with considerable differences relative to each other. The experimental results of this study are used in Part II to investigate the accuracy of these heat flux curves for numerical heat transfer analysis of steel-LN2 pool boiling tests. The investigations in Part II have resulted in a proposed new heat flux curve for LN2.
2. Experimental set-up
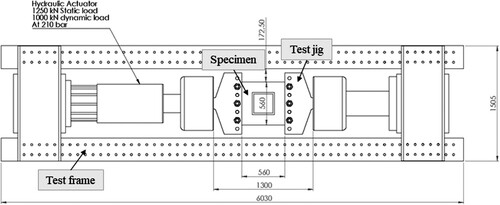
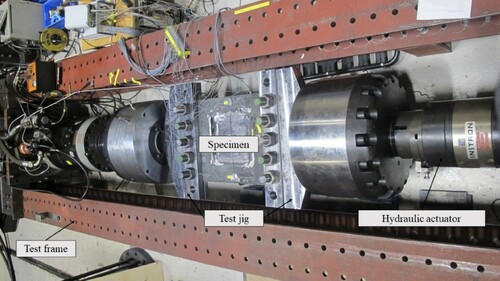
Six pool boiling tests were conducted on six unstiffened EH36 steel plates each with a thickness of 8 mm and subject to tensile stresses. The test set-up was aimed to replicate a non-spreading local LNG spill scenario. For this purpose, a local LN2 pool was built on each specimen () to cool the central zone of the plates down to cryogenic temperatures. The left and right edges of the specimen had five holes each with 49 mm diameter. The holes were made to bolt each specimen to a test jig () that held the specimen during the pool boiling tests. The test jig, designed and fabricated exclusively for the current study, was connected to a hydraulic actuator, outlined in , which applied an initial tensile load of 100 kN to each specimen before commencing the pool boiling tests. In order to study the structural and fracture behaviour of the steel plates in the event of a cryogenic spill, the thermal-structural experiments were continued until a cleavage fracture occurred in the specimen. Hence, the terms ‘pool boiling test’ and ‘thermal-structural experiment’ are used interchangeably in this paper. To model the cracks appearing in marine structures, a through-thickness artificial crack was machined at the centre of each specimen () from which fatigue cracks were developed by cyclic loading.
Figure 1. Specimen and container dimensions together with the location of thermocouples.
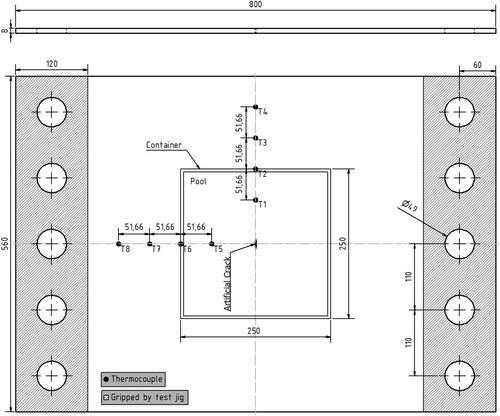
Figure 2. Test jig connected to the specimen by 10 bolts.
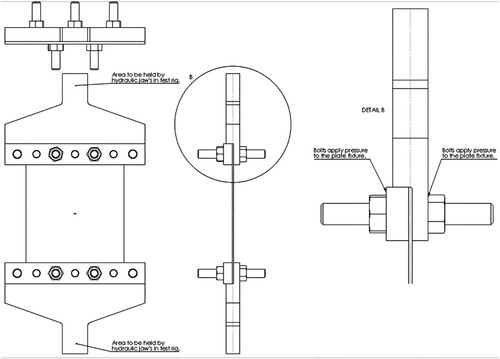
Figure 3. Hydraulic actuator (unit: mm).
2.1. Cryogenic liquid
For the pool boiling tests, it was easier and most importantly safer to use LN2 rather than LNG. Besides, the thermophysical properties of nitrogen (N2) and methane (CH4) are somewhat similar (). These similar properties result in comparable heat flux curves for LN2 and LNG ( (from Part II and Wuersig et al. Citation2009)). Therefore, LN2 is often employed to simulate the heat transfer to LNG with a fair approximation.
Figure 4. Heat flux curves for LNG and LN2.
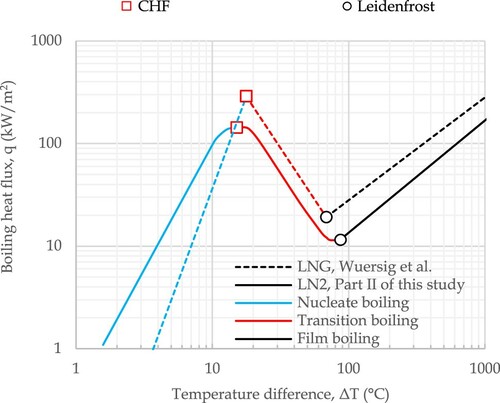
Table 1. Nitrogen and methane thermophysical properties at atmospheric pressure (Angus et al. Citation1978; Beaton and Hewitt Citation1989; Friend et al. Citation1989; Nguyen et al. Citation2020).
Three different boiling regimes – film boiling, transition boiling and nucleate boiling – are divisible in for both LN2 and LNG. During a pool boiling test, the temperature difference between the pool bottom surface and the cryogenic liquid (ΔT), determines the heat flux to the liquid pool from the pool bottom surface (top surface of the steel plate in this study). When the test starts, the surface temperature is much higher than the liquid boiling point, and a vapour film develops between the surface and LN2. The vapour bubbles are produced quick enough to keep a continuous vapour film that covers the whole or a large area of the surface. The film has a lower thermal conductivity compared to the liquid. Therefore, the film acts like an insulation layer and results in a lower heat transfer coefficient compared to the other two boiling regimes. The vapour generation rate decreases with time as the temperature difference drops during the film boiling until the continuous film breaks and turns into segments of discrete films. This is the start of the transition boiling regime. The transition point between the film boiling and transition boiling is called the Leidenfrost point. During the transition boiling, the heat flux increases radically as the liquid can touch the plate surface. The film segments shrink over time as the surface temperature decreases. The growing contact area between the surface and the liquid results in a rising heat flux during this regime. Eventually, the film segments will disappear and that is when nucleate boiling initiates with distinctive isolated bubbles. The transition point between the transition boiling and nucleate boiling is termed the Critical Heat Flux (CHF) point. During the nucleate boiling regime, bubbles leave the surface before they can merge on the surface. Consequently, a substantial area of the plate surface is in direct contact with the liquid. During the nucleate boiling, further reduction of the temperature difference causes the heat flux to lessen until the bubble formation stops at some point and free convection takes place. This point is termed Onset of Nucleate Boiling (ONB), the lowest temperature difference at which bubble formation can take place.
2.2. Equipment and specimen preparation
The test specimens were cut from carbon steel, EH36 (NVE36 or VLE36/S335J2+N), according to DNV-OS-B101 (DNV Citation2009). EH36 steel is a high-strength steel that has a lower ductile-brittle transition temperature (DBTT) compared to normal carbon steels. EH36 steel is widely used for ship and offshore structures exposed to the Arctic environment. As shown in , the specimens were 800 and 560 mm in length and width, respectively, with 8 mm thickness. This thickness was adopted to comply with the maximum capacity of the hydraulic actuator and to provide a plane stress condition. In total, six specimens were prepared. Two specimens were cut parallel to the steel plate rolling direction. Another two were cut perpendicular to the plate rolling direction. For the last two specimens, butt welding was used to fuse together two half-sized plate pieces (400 mm × 560 mm) to examine the influence of the weld and heat-affected zone (HAZ) on the thermal-structural response of steel plates to cryogenic spills. No post-welding treatment was performed on the weld beads to maintain the original welding shape as it is in actual ship and offshore structures. The description of all specimens is given in , and shows two of the six specimens.
Figure 5. Geometries of the specimen and artificial crack: (a) plane specimen (b) welded specimen.
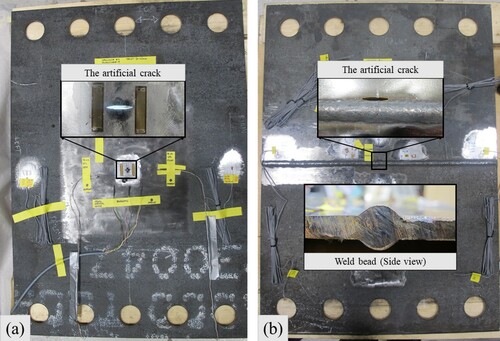
Table 2. Label of specimen.
2.3. Thermocouple set-up
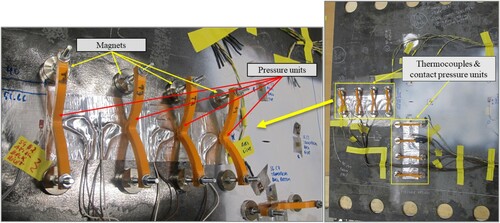
As depicted in and , four thermocouples were located along both vertical and horizontal centrelines of each specimen in order to measure the temperature gradient in the two directions. In case of a thermocouple failure on one of the centrelines, its counterpart on the other centreline could provide the data for estimating the missing temperature history. The thermocouples were attached to the bottom surface of the specimens to avoid direct contact with the cryogenic liquid. The temperature gradient through the plate thickness was assumed negligible.
Figure 6. Thermocouples configuration and contact pressure units on the specimen’s bottom surface.
To specify an appropriate thermocouple type for the experiments, type K and type T thermocouples were inspected. . shows thermocouple type K with 1 mm casing, thermocouple type T with 3 mm casing, the data acquisition (DAQ) unit with a sufficiently wide linearisation range to support both type K and T at low-temperature levels, and the cryogenic capsule. The preliminary analysis for the thermocouples was performed at two temperature points: ambient temperature and −196 °C inside the cryogenic container. After the analysis, type T was selected for the experiments as it had far better performance than type K. The casing size for type T thermocouples was reduced to 1 mm from 3 mm to reduce their thermal mass and achieve a better bond with the specimens.
Figure 7. (a) Thermocouple type K, (b) thermocouple type T, (c) QuantumX DAQ module, and (d) cryogenic capsule.

Each thermocouple was attached to the plate surface in three steps. First, a thermal compound was used to make a thin layer between the surface and the thermocouple. Without the thermal compound, the required bond between the thermocouples and the surface could be lost, or the thermocouple could fall off during the tests as the bond is very sensitive to wetness, dirt and pollution. The thermal compound is designed to achieve the best thermal conduction where surface roughness may affect the thermocouple accuracy. Then, the thermocouples were covered and sealed by aluminium tape to protect them from external frost caused by the low temperatures surrounding the specimens. It should be noted that the aluminium tape is thin and highly conductive. As noted earlier, there was a risk of losing sufficient bond between the thermocouples and the surface. Hence, external pressure was applied to each thermocouple using a 3D printed pressure unit, exclusively designed for this research (). The design aimed to provide sufficient contact pressure without thermal effects. No thermocouples were placed near the plate centre due to the existing crack and deformations around the crack during the tests.
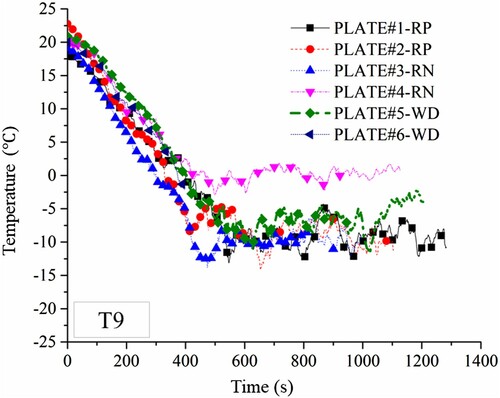
In addition to the eight thermocouples attached to each specimen surface, an additional thermocouple, T9, was located in the air, 20 mm below the bottom surface. T9 measured the ambient temperature near the test set-up.
3. Cryogenic liquid container
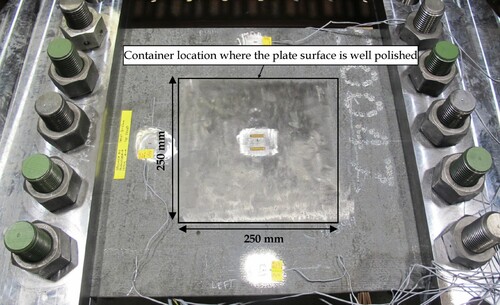
shows the container in a trial test before conducting the thermal-structural experiments. The container with the dimensions of 250 mm × 250 mm × 70 mm was made of four thin aluminium plates (5 mm thick). The aluminium plates were insulated with closed-cell foam to prevent heat flux to the pool from the ambient air through the container walls. Thermally conductive and non-corrosive silicone with excellent adhesion was used to fix the aluminium plates in place and to prevent LN2 leakage. Additionally, aluminium tape was applied on the edges for protecting silicone from direct contact with the cryogenic liquid. The artificial crack hole was also sealed by the aluminium tape. The functionality of the container was evaluated in the trial test, and no LN2 leakage was detected. Also, the performance of three calibrated type T thermocouples was assessed in the trial experiment. After the container and thermocouples successfully passed the trial test the main tests (pool boiling tests) were conducted. For the main tests, the top surface of the specimens where the container was located was polished ().
Figure 8. Container set-up in a trial test (the same set-up used in the main tests).
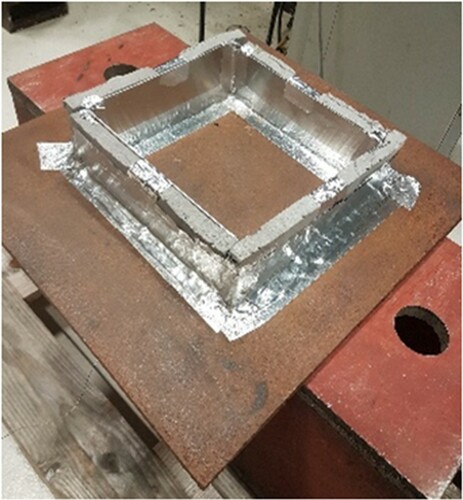
Figure 9. Container location in the main tests (container was not yet installed).
4. Pool boiling tests (main tests)
Each pool boiling test was conducted after an initial 100 kN tensile load was applied to the specimen by the hydraulic actuator. During the test, the container was charged with liquid nitrogen several times to avoid complete vaporisation of LN2. Thermal tensile stresses were induced by the contraction of cold areas which were partly restrained by the surrounding warmer areas. With the temperature reducing in the specimens, the tensile stresses gradually increased while the steel fracture toughness simultaneously declined. This combination eventually led to the cleavage fracture of the specimens, and the test was deemed completed. It should be noted that the two edges of the specimen in the test jigs, which were fixed by the hydraulic actuator unit, had no displacement during the tests. This fixed boundary condition introduced additional tensile stresses in the specimen which contributed to the brittle crack initiation and propagation. In a few cases, when the specimen contraction was not enough to cause a fracture, an additional tensile load was applied by the hydraulic actuator to achieve the fracture and to obtain the data required for the structural investigation. The test set-up is illustrated in .
Figure 10. Test set-up (test ended, and the container was removed). Note the horizontal plane is presented vertically.
5. Results and discussion
shows the temperature histories for all specimens recorded by T1 – T8 thermocouples. Temperature variations at T1 and T5 located inside the bool boundaries are predominantly induced by the heat flux to the liquid pool, and the conductive heat transfer through the specimen has a small effect on them. In contrast, temperatures at T2– T4 and T6–T8 that are situated at and outside the pool boundaries are mainly, not totally, ruled by the conductive heat transfer through the specimen, governed by the steel thermal diffusivity (α=κ/ρcp). Despite the differences between the specimens, they all show similar temperature histories at the location of each thermocouple located at and outside the pool boundaries (T2– T4 and T6–T8). These similar temperature histories suggest that plate rolling direction, welding and HAZ have insignificant effects on the thermal diffusivity of the steel.
Figure 11. Thermocouple temperature as a function of time for the different tests.
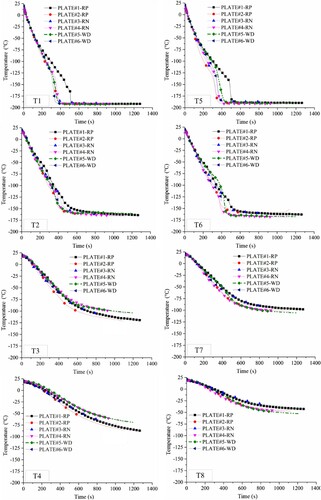
All specimens experienced very similar temperature variations at both T1 and T5 locations except PLATE#1-RP. This inconsistency could stem from the uncertainties associated with LN2 boiling and heat flux to the liquid pool. One of the parameters that may affect heat flux to the liquid pool is surface roughness. The effect of surface roughness on the boiling curve of liquid nitrogen has not been sufficiently studied in the literature (Bombardieri and Manfletti Citation2016), especially for steel-LN2 pool boiling. The top surface of the steel plate in contact with the liquid nitrogen was polished for all specimens (see ) except for PLATE#1-RP. Although T1 and T5 temperature histories for all specimens demonstrate the three typical boiling regimes, PLATE#1-RP with a rough surface exhibited a different cooling rate.
According to T1 data, at large superheat temperature differences (ΔT>134 °C), when the boiling tests begin, the cooling rate is nearly the same for all of the specimens. As the temperature difference lessens over time and approaches the Leidenfrost point (ΔT ≈ 87 °C), the cooling slows down for all specimens, but this cooling rate reduction is more intense for specimen #1, causing its temperature history to deviate from those of other specimens. For specimens #2 to #6, transition boiling initiate from t ≈ 250 s, when the cooling accelerates, while it is delayed to t ≈ 325 s for specimen #1 with a rough surface. However, the Leidenfrost point is not affected by the surface roughness and remains unchanged around 87 °C. The slower cooling of specimen #1 indicates a lower heat flux for the rough surface around the Leidenfrot point. Some time after the transition boiling initiation, an abrupt drop in the temperature is observed for all specimens due to a significant rise in the heat flux. This occurred at t ≈ 310 s (ΔT ≈ 69 °C) for the polished specimens and later at t ≈ 500 s (ΔT ≈ 33 °C) for the rough specimen as the slower cooling for specimen #1 has continued beyond the Leidenfrost point, into the transition boiling. The abrupt temperature reduction for specimen #1 is quicker than that for other specimens. This suggests that higher surface roughness results in larger heat flux near the CHF point. These findings are consistent with Berenson report (Berenson Citation1962), where the heat flux curves from copper-pentane pool boiling tests are compared for a mirror-finish surface and a rougher surface polished with Emery 320-grit paper.
For the polished specimens, the transition boiling regime lasts up to t ≈ 340 s, when a reduction in the cooling rate takes place (ΔT ≈ 15 °C). At this time (340 s), corresponding to CHF, the maximum cooling rate occurs. The information noted above for the polished specimens is used in the numerical study (Part II ) to develop a heat flux curve for EH36 steel-LN2 pool boiling (the curve is given in ).
The temperature histories measured by T1 and T5 eventually flatten out for all specimens, indicating a steady-state heat transfer. The steady-state temperature for different specimens varied from −191 °C to −196 °C at T1 and from −185 °C to −191 °C at T5 (). The slightly higher temperature at T5 was probably caused by the heat supply from the grip parts of the hydraulic actuator. This heat supply can be estimated from a comparison between the temperatures measured by T4 and T8. Although these thermocouples were located at the same distance from the plate centre, they showed a temperature difference of approximately −45 °C to −12 °C at the end of the tests for different specimens (). There is no abrupt change in the cooling rate at the thermocouple spots outside the pool boundaries (T3, T4, T7 and T8). The first and final temperatures measured by each thermocouple are listed in .
Table 3. Initial and final temperatures measured in the tests.
The temperature data from T9 that was used to measure the ambient temperature near the test set-up are plotted in . The ambient temperature variations are similar for almost invariably all specimens. The small differences between the ambient temperature histories might be induced by the initial ambient temperature, the liquid pool depth, and the vaporisation rate.
Figure 12. Ambient temperature histories measured by T9.
6. Conclusions
In order to replicate a local, non-spreading cryogenic spill, pool boiling tests were carried out on six rectangular EH36 steel plates. Each plate had a four-sided LN2 pool on its top surface. The specimens had different rolling directions, and two of them were fabricated by welding together two half-sized steel plates. All specimens were polished on the top surface except for one. Eight thermocouples recorded the temperature variations along the plate centrelines during the experiments. On the basis of the temperature histories, the following conclusions are made:
The temperature variations at and outside the pool boundaries, largely caused by the conductive heat transfer through the plate, were found to be similar for different specimens. Consequently, it is inferred that the thermal diffusivity of the specimens was not considerably affected by the plate rolling direction, welding and HAZ.
From the temperature histories of the polished specimens, Leidenfrost and CHF were estimated to occur around temperature differences of 87 and 15 °C, respectively. This information will be used to develop a heat flux curve for EH36 steel-LN2 pool boiling in Part II of this study.
Surface roughness was found to have a negligible effect on the Leidenfrost point. For large superheat temperature differences (ΔT>134 °C), the cooling rate was not noticeably influenced by surface roughness. However, a slower cooling was noted for the unpolished specimen around the Leidenfrost point followed by a higher cooling rate close to the CHF point. These findings suggest that an increase in the roughness results in a heat flux curve lower around the Leidenfrost point and higher in the vicinity of the CHF point. A similar trend has been reported in the literature for copper-pentane pool boiling with mirror-finish and Emery 320-grit polished surfaces.
Due to the significant influence of surface roughness on the temperature histories and the boiling of LN2 observed in this study, further investigation appears necessary to better understand the effect of surface roughness on the thermal behaviour of steel structures subject to cryogenic spills.
Disclosure statement
No potential conflict of interest was reported by the author(s).
Additional information
Funding
References
- Angus S, Armstrong B, de Reuck KM. 1978. International thermodynamic tables of the fluid state. 5. methane. Elmsford, NY: Pergamon Press Inc. Related Information: Chemical data series No. 16.
- Barron RF, Nellis GF. 2017. Cryogenic heat transfer. Boca Raton, FL: CRC press.
- Beaton CF, Hewitt GF. 1989. Physical property data for the design engineer. New York, NY: Hemisphere Publishing.
- Berejnoi C, Ipiña JP. 2015. Analysis of size and temperature effects in the ductile to brittle transition region of ferritic steels. Eng Fract Mech. 148:180–191.
- Berenson P. 1962. Experiments on pool-boiling heat transfer. Int J Heat Mass Transfer. 5(10):985–999.
- Bombardieri C, Manfletti C. 2016. Influence of wall material on nucleate pool boiling of liquid nitrogen. Int J Heat Mass Transfer. 94:1–8.
- Briscoe F, Shaw P. 1980. Spread and evaporation of liquid. Prog Energy Combust Sci. 6(2):127–140.
- Bruchhausen M, Holmström S, Lapetite J-M, Ripplinger S. 2017. On the determination of the ductile to brittle transition temperature from small punch tests on grade 91 ferritic-martensitic steel. Int J Press Vessels Pip. 155:27–34.
- Dabiri A. 1986. Liquid nitrogen cooling considerations of the compact ignition tokamak. Fusion Technol. 10(3P2A):521–526.
- Dincer AK, Drake EM, Reid RC. 1977. Boiling of liquid nitrogen and methane on water. The effect of initial water temperature. Int J Heat Mass Transfer. 20(2):176–177.
- DNV. 2009. DNV-OS-B101 Metallic Materials.
- Drake EM, Jeje AA, Reid RC. 1975. Transient boiling of liquefied cryogens on a water surface: I. nitrogen, methane and ethane. Int J Heat Mass Transfer. 18(12):1361–1368.
- Ermak D, Koopman R, McRae T, Hogan W. 1982. LNG spill experiments: Dispersion, RPT, and vapor burn analysis.
- Friend DG, Ely JF, Ingham H. 1989. Thermophysical properties of methane. J Phys Chem Ref Data. 18(2):583–638.
- Gavelli F, Bullister E, Kytomaa H. 2008. Application of CFD (fluent) to LNG spills into geometrically complex environments. J Hazard Mater. 159(1):158–168.
- Georgakis C, Congalidis J, Williams GC. 1979. Model for non-instantaneous LNG and gasoline spills. Fuel. 58(2):113–120.
- Goldwire H Jr., Rodean H, Cederwall R, Kansa E, Koopman R, McClure J, McRae T, Morris L, Kamppinen L, Kiefer R. 1983. Coyote series data report LLNL/NWC 1981 LNG spill tests dispersion, vapor burn, and rapid-phase-transition. Volume 1.[7 experiments with liquefied natural gas, 2 with liquid methane, and one with liquid nitrogen].
- Horvat A. 2018. CFD methodology for simulation of LNG spills and rapid phase transition (RPT). Process Saf Environ Prot. 120:358–369.
- Kumar R, Rohilla L, Das AK. 2021. Understanding interfacial behaviour during boiling of nitrogen from liquid-liquid contact plane. Int J Heat Mass Transfer. 165:120661.
- Li Y, Shterenlikht A, Ren X, He J, Zhang Z. 2019. CAFE based multi-scale modelling of ductile-to-brittle transition of steel with a temperature dependent effective surface energy. Mater Sci Eng, A. 755:220–230.
- Liu Y, Olewski T, Véchot LN. 2015. Modeling of a cryogenic liquid pool boiling by CFD simulation. J Loss Prev Process Ind. 35:125–134.
- Luketahanlin A. 2006. A review of large-scale LNG spills: experiments and modeling. J Hazard Mater. 132(2-3):119–140.
- Majzoobi G, Mahmoudi A, Moradi S. 2016. Ductile to brittle failure transition of HSLA-100 steel at high strain rates and subzero temperatures. Eng Fract Mech. 158:179–193.
- McRae T, Goldwire H Jr., Koopman R. 1984. Analysis of large-scale LNG/water RPT explosions. Livermore, CA: Lawrence Livermore National Laboratory, UCRL-91832.
- Morgan D Jr., Morris L, Chan S, Ermak D, McRae T, Cederwall R, Koopman R, Goldwire H Jr., McClure J, Hogan W. 1984. Phenomenology and modeling of liquefied natural gas vapor dispersion.
- Nam W, Hopperstad OS, Amdahl J. 2018. Modelling of the ductile-brittle fracture transition in steel structures with large shell elements: a numerical study. Mar Struct. 62:40–59.
- Nguyen L-D, Kim M, Choi B, Chung K, Do K, Kim T. 2020. An evaluation of vaporization models for a cryogenic liquid spreading on a solid ground. Int J Heat Mass Transfer. 146:118848.
- Nguyen L-D, Kim M, Chung K. 2020. Vaporization of the non-spreading cryogenic-liquid pool on the concrete ground. Int J Heat Mass Transfer. 163:120464.
- Opschoor G. 1980. The spreading and evaporation of LNG-and burning LNG-spills on water. J Hazard Mater. 3(3):249–266.
- Paik JK, Kim KJ, Lee JH, Jung BG, Kim SJ. 2017. Test database of the mechanical properties of mild, high-tensile and stainless steel and aluminium alloy associated with cold temperatures and strain rates. Ships Offshore Struct. 12(sup1):S230–S256.
- Paik JK, Lee DH, Noh SH, Park DK, Ringsberg JW. 2020. Full-scale collapse testing of a steel stiffened plate structure under axial-compressive loading triggered by brittle fracture at cryogenic condition. Ships Offshore Struct. 15(sup1):S29–S45.
- Park S-I, Kim S-K, FREng JKP. 2020. Safety-zone layout design for a floating LNG-fueled power plant in bunkering process. Ocean Eng. 196:106774.
- Rodean H, Hogan W, Urtiew P, Goldwire H Jr., McRae T, Morgan D Jr.. 1984. Vapor burn analysis for the Coyote series LNG spill experiments. Livermore, CA (USA): Lawrence Livermore National Lab.
- Sun B, Guo K, Pareek VK. 2014. Computational fluid dynamics simulation of LNG pool fire radiation for hazard analysis. J Loss Prev Process Ind. 29:92–102.
- Sun B, Guo K, Pareek VK. 2015. Dynamic simulation of hazard analysis of radiations from LNG pool fire. J Loss Prev Process Ind. 35:200–210.
- Sun B, Guo K, Pareek VK. 2017. Hazardous consequence dynamic simulation of LNG spill on water for ship-to-ship bunkering. Process Saf Environ Prot. 107:402–413.
- Sun B, Utikar RP, Pareek VK, Guo K. 2013. Computational fluid dynamics analysis of liquefied natural gas dispersion for risk assessment strategies. J Loss Prev Process Ind. 26(1):117–128.
- Wuersig G-M, GL JGA, Benjamin Scholz G, Maritime LSM. 2009. Effects of enveloping pool fires on LNG tank containment systems. Proceedings of the GasTech conference: AbuDhabi, UAE.
- Zhang X, Li J, Zhu J, Qiu L. 2015. Computational fluid dynamics study on liquefied natural gas dispersion with phase change of water. Int J Heat Mass Transfer. 91:347–354.