
ABSTRACT
Electrical and wind propulsion, together with energy stored in batteries and renewable energies harnessed onboard, can lead the way towards zero-emission ships. This study compares wind propulsion solutions and battery storage possibilities for a RoRo ship operating in the Baltic Sea. The ship energy systems simulation model ShipCLEAN is used to predict the performance of the zero-emission ship in real-life operating conditions. The study showcases how ships can be transferred from a conventional, diesel-powered to a zero-emission ship. For the zero-emission ship, all energy needed for auxiliaries and propulsion is taken from renewable sources onboard or from batteries. Challenges and opportunities, as well as necessary adaptions of the route and logistics, are discussed. Results of the study present which wind propulsion technology is the most suitable for the example RoRo ship, and how the installation of suitably sized battery packs for zero-emission operation affects the cargo capacity of the ship.
1. Introduction
| Nomenclature | ||
| AWA | = | Apparent wind angle [deg] |
| B | = | Beam [m] |
| CET | = | Central European time (UTC+1) [-] |
| CMEMS | = | Copernicus Marine Environment Monitoring Service [-] |
| DOF | = | Degree of freedom [-] |
| DWT | = | Deadweight [t] |
| GHG | = | Greenhouse gas [-] |
| HFO | = | Heavy fuel oil [-] |
| Loa | = | Length over all [m] |
| MDO | = | Medium density oil [-] |
| T | = | Draft [m] |
| TSS | = | Traffic separation scheme [-] |
| TWA | = | True wind angle [deg] |
| TWS | = | True wind speed [kn] |
| WASP | = | Wind-assisted propulsion [-] |
Climate change is arguably one of the most significant challenges of our time, and it is the main effect caused by emissions and has already become a critical situation for society. Today, most ships are powered by fossil fuels, and their combustion is responsible for the emission of pollutant gases such as NOx and SOx and about 3% of the total global CO2 emissions. Decarbonisation of our activities or the reduction of greenhouse gas (GHG) emissions and CO2 is necessary in order to achieve the long-term goal to keep the increase of the global average temperature to 1.5°C maximum compared to pre-industrial levels by the end of the century.
Global trade is one of the pillars of the modern world, where shipping stands for about 80–90% of the total cargo volume. Forecasts of the world’s transportation needs in 2050 show that it will double the current level. At the same time, shipping must become more energy-efficient and, before 2050, reduce its contribution to the emission of greenhouse gases to 50% of the level in 2008 (IMO Citation2018). In the last decade, new technology and innovations that use renewable energies have been introduced in the shipping industry. These energy sources have been incorporated mainly as a complementary technology, hybridising traditional fossil fuel-powered systems, see e.g. Atkinson et al. (Citation2018), Kim and Yaakob (Citation2016), Lan et al. (Citation2015), Liu et al. (Citation2018), Talluri et al. (Citation2018), and Traut et al. (Citation2014). There are also examples of projects which substitute fossil fuels completely (Bøckmann Citation2015; Juliá et al. Citation2020).
This paper is a sequel to the authors’ previous papers, which present the development, validation, and verification of the ship performance prediction model ShipCLEAN (Tillig et al. Citation2017, Citation2018, Citation2020; Tillig and Ringsberg Citation2019, Citation2020; Juliá et al. Citation2020; Lu and Ringsberg Citation2020). It presents the further development of the ShipCLEAN simulation model with emphasis on how electrical and wind-assisted propulsion in combination can work in actual operating conditions. The study’s objective is to present realistic showcases how, e.g. RoRo ships can be transferred from a conventional, diesel-powered ship to a wind – and battery-assisted ship, and finally, to a zero-emission ship. The results from the simulations of showcases pinpoint challenges and opportunities as well as necessary adaptions of the route and logistics. It also presents which wind propulsion technology and energy generation system are most suitable for the example RoRo ship.
2. ShipCLEAN – a generic energy systems model
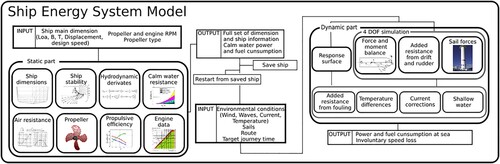
The ShipCLEAN model is an integration of two main simulation models, a generic ship energy systems model to predict the fuel consumption under operational conditions with very limited required input of the ship’s characteristics, and a transport economics model used to estimate costs and income of the journey. Tillig (Citation2020) presents a detailed presentation and summary of the ShipCLEAN model; see for an overview of the complete model. The component-based design provides the opportunity for component or system optimisation. The unique combination of a generic operational power prediction and an economic model provides the possibility to investigate alternatives in transport logistics, fleet sizes, ship dimensions, and ship propulsion concepts at a very early stage of a project, i.e. as soon as the transport task is known. It can be used to project newbuilding, analyze retrofitting, and for decision-making when existing ships are to be used on a new trade. Thus, the model is targeted at designer/project teams interested in new buildings and new trades, and ship operators that want to improve the utilisation of their ships.
Figure 1. Overview of the ShipCLEAN model (Tillig Citation2020) (This figure is available in colour online.).
2.1. The 4DOF performance prediction module
The main part of the 4DOF performance prediction module in ShipCLEAN remained unchanged from how it is presented in Tillig (Citation2020). Changes were only applied in the sail force optimisation, where a formal optimisation algorithm has replaced the analytic, stepwise reefing algorithm from previous versions. The main advantage is an increase in computation speed and numerical solution stability of the model. Further, a grid-based algorithm is implemented to find suitable starting points and ensure to achieve a global optimum after optimisation. For suitable conditions (i.e. downwind), this algorithm even allows for negative rpm or angle of attack, i.e. the sail acts more as a rudder than a propulsor. Since large rudder angles are one main problems for sailing cargo ships, this can significantly improve the performance.
2.2. Route optimisation
In recent years, weather routing and speed optimisation have become an industry standard in marine transport. Route optimisation can be used to both, reduce fuel consumption and structural loads and fatigue (Wang Citation2020). Using ShipCLEAN as a performance prediction model, Li et al. (Citation2020) developed a dynamic voyage prediction tool to include variable predictions, observations, and ice navigation in the routing.
Compared to classic routing problems, the prerequisites in the current study are slightly different, especially concerning two areas: (i) the open sea legs are very short (less than 200 nm, see Section 3.2) and, (ii) the ship might be fully sailing (i.e. without consuming energy for propulsion) with higher speeds than required to match the fixed arrival time. This means that the routing options are limited; thus, the routing algorithm does not have to be very sophisticated but that the target speed of the vessel in propulsion/assisted propulsion mode is variable for each route option. A variable target speed requires a constant simulation of the remaining route to estimate the speeds in pure sailing mode and compute the required target speed. To simplify the algorithm, a static grid approach is used together with the shortest path function for weighted grids in Matlab (Mathworks Citation2020). For pure sailing mode, the elapsed time between two nodes is set as the weight, in assisted propulsion mode, the required propulsion energy is set as the weight. The target speed for each leg between two nodes is set based on the distance between the nodes, the maximum achieved speed in pure sailing mode from the target node and the remaining distance from the target node.
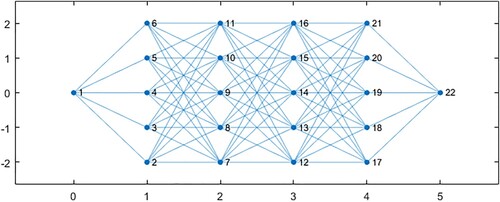
A grid consisting of columns (spaced in 10 nm intervals along the rhumbline) and rows (spaced in 5 nm intervals perpendicular to the rhumbline) is created. During the optimisation, the ship must move to the next column but could go to any point in this column, i.e. change row. The shortest route would be to stay at one row and follow the rhumbline, however, due to wind conditions it might be favourable to follow a longer route. The power consumptions of all possible intermediate routes are evaluated. Naturally, the combination with the least total power consumption is selected as the optimal route. An example grid with four columns (excluding the start and endpoints) and five rows is presented in .
Figure 2. Example grid for route optimisation: 10 nm distance between columns and 5 nm distance between rows (This figure is available in colour online.).
3. Study case
3.1. Ship specifications
The case study ship for this study is a RoRo ship operating in liner traffic in the Baltic Sea. The main dimensions of the ship are presented in (Svenska Orient Linien Citation2020). The ship has a single propeller and a single rudder.
Table 1. Main dimensions of the study ship.
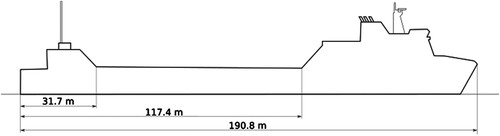
presents the profile view of the RoRo vessel, showing the free deck area of almost 86 m in length between the forward and aft superstructure of the ship. This deck space is usually covered with lanes for cars and trucks. However, with suitable foundations and roofing, it could be used for installing sails and solar panels. Apart from the installation of sails and the electric motor, the ship’s design remains unchanged except the rudder area, which was increased by 50% to ensure good maneuverability and better performance under sail.
Figure 3. Profile view of the case study RoRo ship (This figure is available in colour online.).
3.2. Route and weather
For this study, the actual route and time schedule of the diesel-powered study ship is applied and the zero-emission ship is expected to keep the same schedule and follow the same route. In this section, the route, time schedule and weather along the route are presented.
The ship operates on weekly liner traffic in the Baltic Sea, starting on Mondays, 2100 CET in Oulu (Finland) and reaching Lübeck (Germany) on Fridays, 1600 CET. Intermediate stops are in Kemi (Finland), Tuesdays 0500–1300 CET and Husum (Sweden), Wednesdays 0600–1200 CET. The return trip starts in Lübeck, Fridays at 2200 CET and arrives in Oulu on Mondays 1300 CET, without any intermediate stops. An overview of the route is presented in . Open sea passages, i.e. areas where route optimisation can be applied, are marked with small letters. For the study and route optimisation, the route is divided into four legs, which are presented with details in . To evaluate the required ship speed, on each leg, 1 h is reserved for harbour maneuvers.
Figure 4. Route overview with open sea passages (small letters) and points for wind statistics (capital letters) (This figure is available in colour online.).
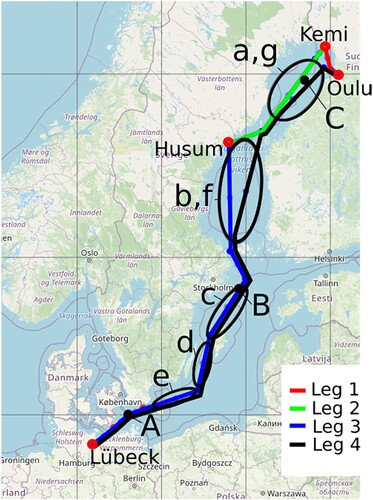
Table 2. Route details.
Leg 1 is entirely represented by channels; thus, it is treated as a fixed path. Since this leg is only 60 nm it is not crucial for the battery sizing. For the study, sails are used on this leg. The legs 2–4 have open sea passages with fixed intermediate points (TSS or channels), on which route optimisation is applied. A summary of these passages, including their lengths and widths of the routing grid, is presented in . Between Bornholm and Lübeck the traffic is restricted to different TSS with minimal space in between. Thus, this part does not have any open sea passages.
Table 3. Summary of open sea passages.
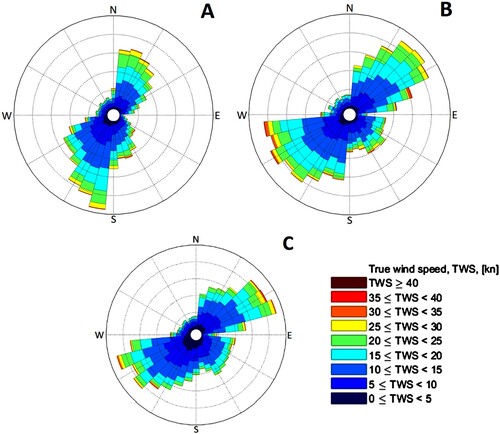
The environmental conditions are updated every 6 h and retrieved from the Copernicus Marine Environment Monitoring Service (CMEMS), in terms of wind speed and direction as well as wave height, direction, and peak frequency. The Jonswap spectrum is used for the waves and the spectral parameters are estimated using the wind fetch at the geographical point in question. For the long-term predictions, weekly journeys for three years (2016–2018) are simulated. Wind statistics for the three-year period on three points along the route (shown as ‘A’, ‘B’ and ‘C’ in ) are visualised as wind scatter plots in .
Figure 5. Wind scatter plots for three points (A, B and C in ) along the route (10 m above sea level) (This figure is available in colour online.).
4. Propulsion and energy production
4.1. Wind propulsion
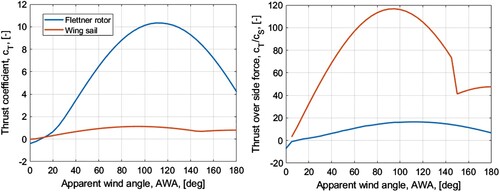
The ship concept’s main propulsion is wind energy, i.e. sail. This section presents the potential of wind propulsion for such a RoRo vessel and compares two sail technologies: Flettner rotors and fixed, symmetrical Wing sails. The lift and drag coefficients of both, the Wing sail and the Flettner rotor, depend on the trim of the sails. The trim parameters are the angle of attack for Wing sails and the spin ratio (i.e. the ratio of circumferential speed of the cylinder’s surface and inflow speed) for the Flettner rotor. To compare the two sail types, one must first compare the achievable (maximum) thrust coefficients as well as the thrust over side force at the same trim for each sail type while neglecting aerodynamic interaction effects, as presented in .
Figure 6. Maximum thrust coefficients (left) and thrust over side force (right) for Wing sails and Flettner rotors (This figure is available in colour online.).
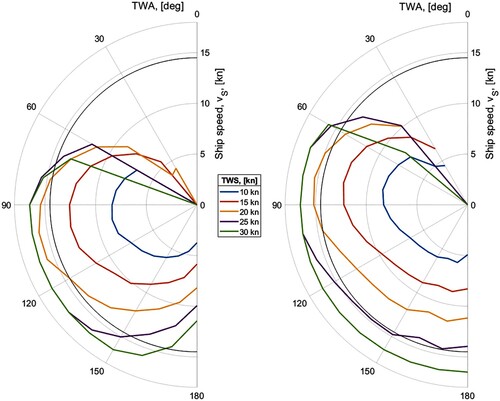
To compare the sail types in terms of performance on the RoRo ship, presents the polar diagrams of the achievable ship speeds in different wind speeds. In this study, the ship is equipped with four Flettner rotors (5 × 30 m) or four Wing sails (12 × 77 m). A direct comparison of the performance is difficult due to the large difference in lift coefficients between the Wing sails and the Flettner rotors. Here, the sail area of the Wing sail is sized to give similar ship speeds in 20 kn wind when integrated over 180 degrees wind angle. The calculations in are performed assuming a maximal fetch for the wave height estimation of 60 nm, thus limiting the waves to about 2.5 m height in 30 kn of true wind speed.
Figure 7. Polar diagrams of achievable ship speeds in full sailing mode. 4 × 150 m2 Flettner rotors (left) and 4 × 550 m2 Wing sails (right) (This figure is available in colour online.).
Apart from the achievable performance, the cost, room for installation and shading of possible solar panels are major criteria for sail selection. While the Flettner rotors are only 5 × 30 m in planform, the Wing sails have a trapezoid planform with a span of 77 m and a chord length of 12 m at the base. Thus, while a single Flettner rotor might shade about 20% of the deck area available for solar panels, a single Wing sail can shade more than 40%.
4.2. Battery-powered electric propulsion and energy system
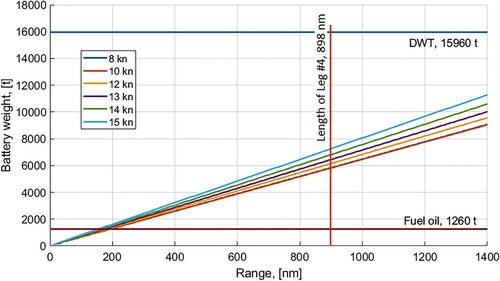
For battery-powered ships, the most imminent question is a range, both required and achievable range. In this study, it is believed that the weight of the engine system for electric propulsion, including all systems, is equal to the weight of the classic propulsion system using a diesel engine. However, the fuel oil is replaced with batteries, i.e. the fuel oil weight of 1260 t is subtracted from the required battery weight to evaluate the lost payload. The battery packs chosen for this study have a weight of 30.55 t and a capacity of 3612 kWh, each (Corvus Energy Citation2020). In operation, 60% of the battery capacity is utilised.
This study focuses on a conversation of the existing ship, i.e. the main dimensions and displacement is kept constant. Any additional weight from the batteries will thus decrease the deadweight. A design condition with a headwind of 16 kn and 1.5 m high head-waves is defined. Continuous consumption of 2000 kW for auxiliaries, i.e. HVAC, cargo handling, steering, navigation, and lights are added. presents the resulting weight of the required battery capacity. For the longest leg (Leg 4), which is also travelled with the highest speed, about 7000 t (230 batteries) of battery would be required. This would mean that almost half of the deadweight is lost to the batteries, if the ship encounters the conditions assumed, i.e. 16 kn headwind with corresponding waves. Compared to the diesel-powered ship, the payload would be reduced by 5740 t.
Figure 8. Required battery weight for different speed and ranges (This figure is available in colour online.).
4.3. Hybrid propulsion
The propulsion systems presented in the previous sections are combined into a hybrid wind-/electric propulsion system. With such a system, it is possible to run the ship with a fixed target speed since the electric propulsion can (most of the time) cover the lack of power that the ship in pure wind propulsion might have. presents the required propulsion power from the propeller/electric motor for the wind-assisted ship with the sail arrangements discussed above, at 14.5 kn speed. The arrangement with Flettner rotors is shown to the left and with the Wing sails to the right. The propulsion power is limited to 7000 kW, which results in the fact that the ship cannot keep the desired speed in headwind stronger than 20 kn and corresponding waves assuming an unlimited fetch (5 m). This power limit is equal to the available propulsion power of the diesel-powered ship.
Figure 9. Required propulsion power in wind-assisted propulsion mode: 14.5 kn ship speed with Flettner rotors (left) and Wing sails (right) (This figure is available in colour online.).
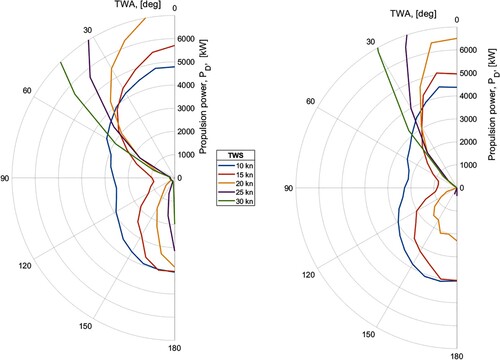
From a comparison of the two polar plots, it can be stated that the Wing sails require less propulsion power in most sailing conditions, which means they are more efficient in wind-assisted propulsion mode and their size could be reduced. The reason for the Wing sails to be more efficient in wind-assisted propulsion mode is: (i) the ship speeds are higher than in pure sailing mode, thus the apparent wind is more forward and the higher lift to drag ratio of the Wing sails is beneficial, (ii) the Wing sails have a lower drag in fully depowered/reefed trim, i.e. the required power in headwind conditions is lower, and (iii) the large area and higher pure drag of the Wing sails give more thrust in dead downwind conditions. The spikes/jumps in the required power for the Wing sails set up at 20 kn TWS and about 160 TWA show the region where the sail shifts from operating in a wing mode to fully separated drag mode. The huge differences in required power show the need for an approach to size the installed battery which accounts for the actual conditions and not only one design point, as is presented in Section 5.
5. Statistical approach using long term operational simulations
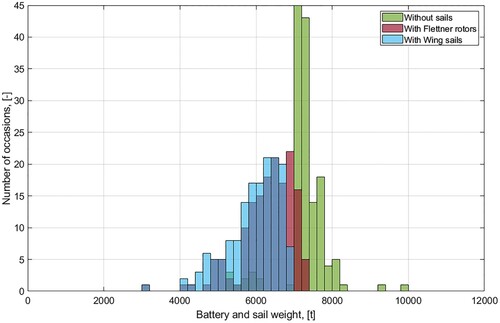
In Section 4, the achievable performance in different wind conditions and required battery weight for different ranges were discussed. However, in realistic operation, the conditions will vary in between journeys but also during a journey. Thus, a single design point for the sizing of the batteries is not suitable. Instead, a statistical approach is required. Since Leg 1 is very short and the ship operates at very low speeds, it is not critical for the battery sizing and excluded in this study. In this study, 156 journeys, i.e. three years of operation (2016–2018) were simulated using hindcast wind and wave information. The results are presented as a histogram of the required battery weight to complete the journey on schedule. It is assumed that the batteries can be fully charged/exchanged during the time in the harbours. The sail weight is included in the battery weight for the wind-assisted ship propulsion (WASP) version. As in Section 4, the total power consumption includes 2000 kW continuous auxiliary consumption. It must be noted that this consumption adds up to 126,000 kWh on Leg 4 and thus would require 59 batteries with a weight of 1800 t which is already more than the fuel oil capacity of the diesel-powered ship.
presents the results to complete the full journey, i.e. the required installed battery weight to complete all legs, assuming that the batteries can be fully charged/exchanged during the stopovers. In summary, to keep the schedule 90% of the time, 7730 t batteries would be needed without sails, 7090 t with the Flettner rotor set up and 6690 t with the Wing sail set up. These relatively low savings from the wind propulsion is due to the high ship and low wind speeds along the route. These battery weights mean that the payload is reduced by 6470 t without sails, 5830 t with the Flettner rotor arrangement and 5430 t with the wing sail setup.
Figure 10. Required battery weight to complete the full journey on time (This figure is available in colour online.).
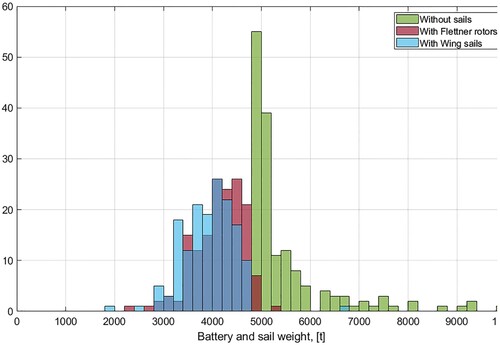
One option to reduce the required installed battery weight is to reduce ship speed. Here, it is assumed that two ships are used instead of one and ship speed is reduced by 50%. It must be kept in mind that this increases the required energy for the auxiliaries on Leg 4–252,000 kWh, which would require 3600 t batteries. presents the results for the reduced ship speeds. To complete 90% of the journeys on time, 6780 t of batteries would be needed without sails, 4740 t with the Flettner rotor set up and 4520 t with the Wing sail set up.
Figure 11. Required battery weight to complete the full journey on time, reduced ship speed (This figure is available in colour online.).
6. Conclusions
This study presented a fossil-free operated RoRo vessel, propelled by wind and battery-electric motors. It was shown that the ship can fully sail under some circumstances. The auxiliary power consumption becomes a huge part of the total consumption on board a wind-assisted ship with a large sail area, i.e. a ship that can fully sail at common service speeds. A long-term study showed that the ship can operate without emissions and keep its tight schedule and a large part of its original deadweight and hence payload.
In terms of battery weight, it was shown that, keeping the current schedule, about half of the deadweight of the ship would be needed for batteries if the ship shall be able to keep the schedule in 95% of the time. Since the ship’s operational and commercial data (i.e. payload, actual load, and draft during operation) are not available to the authors, it cannot be concluded if this would require a large reduction of the transported cargo or if the ship is operating partly loaded already today.
It is concluded that a statistical approach to the design of the battery and propulsion systems using actual weather data for the desired route is required to find appropriate battery sizes due to the huge differences in required power in different wind conditions.
With a power consumption of up to 830,000 kWh, it is not reasonable to assume that the batteries could be charged during the short harbour times in the ship’s schedule. Thus, it must be concluded that a battery system on a fully electric ship in liner traffic and tight schedule must be exchangeable, e.g. by having containerised batteries that could be stacked in the lower car deck and exchanged using trailers. A flexible battery system would also open the possibility to vary the battery weight depending on the expected conditions and thus to transport more cargo on journeys with favourable sailing conditions.
This study did not research any other renewable power source except for a hydro turbine that is running if the sails deliver more thrust than needed to propel the ship. Regarding the large auxiliary power consumption, it must be concluded that more renewable power sources must be exploited on board a fossil-free operated ship, e.g. through wind turbines or solar panels.
Two sail types, Flettner rotors and Wing sails, were compared. One main difference between these sail types is the achievable thrust coefficient, and thus the required sail area. The Wing sails were shown to be more than 3.5 times larger than the Flettner rotors, to achieve similar speeds over a range of 180 degrees true wind angles in full sailing mode. However, the Wing sails proved to be more efficient in wind-assisted propulsion mode. Regarding the performance, the Wing sails have advantages in headwinds, while the Flettner rotors show better performance in reaching and downwind conditions. A combination of the two sail types on the same ship was not studied but can be very interesting for future projects. Finally, due to the above differences, a direct comparison, or a statement which of the sail technologies would be better suited is not possible without: (i) constraints on costs, height, or deck space, or (ii) a study on different sail sizes to find the maximal achievable performance of the route. It must also be concluded that wind propulsion alone cannot stand for the propulsion on routes with such a tight schedule. Wind-powered ships would require a different logistics system, with flexible arrival and journey times.
Finally, it might seem logistically and economically unreasonable to install 7000 t batteries in a RoRo ship and there will appear several problems to overcome, e.g. hazards, fire or risks of flooding. This study showed that, from a naval architecture point of view, zero-emission liner traffic is possible while keeping the same schedule as today and keep the main part of the deadweight available for cargo. Further studies about hazards and the economics (especially actual loading conditions) of the ship could bring such project closer to reality.
Disclosure statement
No potential conflict of interest was reported by the author(s).
Additional information
Funding
References
- Atkinson G, Nguyen H, Binns J. 2018. Considerations regarding the use of rigid sails on modern powered ships. Cogent Engineering. 5(1):1–20. doi:10.1080/23311916.2018.1543564.
- Bøckmann E. 2015. Wave propulsion of ships. Doctoral thesis (2015:16). Norwegian University of Science and Technology, Trondheim, Norway.
- Corvus Energy. 2020. Corvus Blue Whale. [Online]; [accessed 2021 August 6]. https://corvusenergy.com/products/corvus-blue-whale/.
- IMO. 2018. (Online); [accessed 2021 August 6]. http://www.imo.org/en/OurWork/Environment/PollutionPrevention/AirPollution/Pages/GHG-Emissions.aspx.
- Juliá E, Tillig F, Ringsberg JW. 2020. Concept design and performance evaluation of a fossil-free operated cargo ship with unlimited range. Sustainability. 12(16):6601–6623. doi:10.3390/su12166609.
- Kim TK, Yaakob O. 2016. Adaptation of wind power for ship essential service system onboard. Journal of Transport System Engineering. 1(3):8–19.
- Lan H, Wen S, Hong YY, Yu DC, Zhang L. 2015. Optimal sizing of hybrid PV/diesel/battery in ship power system. Appl Energy. 158(1):26–34. doi:10.1016/j.apenergy.2015.08.031.
- Li Z, Ringsberg JW, Rita F. 2020. A voyage planning tool for ships sailing between Europe and Asia via the Arctic. Ships Offsh Struct. 15(1):10–19. doi:10.1080/17445302.2020.1739369.
- Liu P, Bose N, Chen K, Xu Y. 2018. Development and optimization of dual-mode propellers for renewable energy. Renewable Energy. 119(1):566–576. doi:10.1016/j.renene.2017.12.041.
- Lu R, Ringsberg JW. 2020. Ship energy performance study of three wind-assisted ship propulsion technologies including a parametric study of the Flettner rotor technology. Ships Offsh Struct. 15(3):249–258. doi:10.1080/17445302.2019.1612544.
- Mathworks. 2020. Matlab Documentations. [Online]; [accessed 2021 August 6]. https://www.mathworks.com/help/matlab/.
- Svenska Orient Linien. 2020. M/V Tavastland. [Online]; [accessed 2021 August 6]. https://www.sollines.se/en/sol-continent-line/fleet/mv-transpaper.
- Talluri L, Nalianda DK, Giuliani E. 2018. Techno-economic and environmental assessment of Flettner rotors for marine propulsion. Ocean Eng. 154(1):1–15. doi:10.1016/j.oceaneng.2018.02.020.
- Tillig F. 2020. Simulation model of a ship’s energy performance and transportation costs. Doctoral thesis (New series, no. 4750). Chalmers University of Technology, Gothenburg, Sweden.
- Tillig F, Ringsberg JW. 2019. A 4 DOF simulation model developed for fuel consumption prediction of ships at sea. Ships Offsh Struct. 14(S1):S112–S120. doi:10.1080/17445302.2018.1559912.
- Tillig F, Ringsberg JW. 2020. Design, operation and analysis of wind-assisted cargo ships. Ocean Eng. 211(1):1–23. doi:10.1016/j.oceaneng.2020.107603.
- Tillig F, Ringsberg JW, Mao W, Ramne B. 2017. A generic energy systems model for efficient ship design and operation. IMechE, Part M, Journal of Engineering for the Maritime Environment. 231(2):649–666. doi:10.1177/1475090216680672.
- Tillig F, Ringsberg JW, Mao W, Ramne B. 2018. Analysis of uncertainties in the prediction of ships’ fuel consumption - from early design to operation conditions. Ships Offsh Struct. 13(S1):S13–S24. doi:10.1080/17445302.2018.1425519.
- Tillig F, Ringsberg JW, Psaraftis HN, Zis T. 2020. Reduced environmental impact of marine transport through speed reduction and wind assisted propulsion. Transportation Research Part D: Transport and Environment. 83(1):1–17. doi:10.1016/j.trd.2020.102380.
- Traut M, Gilbert P, Walsh C, Bows A, Filippone A, Stansby P, Wood R. 2014. Propulsive power contribution of a kite and a flettner rotor on selected shipping routes. Appl Energy. 113(1):362–372. doi:10.1016/j.apenergy.2013.07.026.
- Wang H. 2020. Development of voyage optimization algorithms for sustainable shipping and their impact to ship design. Doctoral thesis (New series no 4726). Chalmers University of Technology, Gothenburg, Sweden.