Abstract
This study presents habitat maps from two years in which precipitation was extreme – 2000 was one of the driest years while 2010 was one of the wettest years in the Carpathian Basin. The study area is in northern Hungary, beside the River Ipoly, in the municipality of Drégelypalánk, with a smaller proportion in Hont and Ipolyvece. Its extent is 621.5 hectares. During the field survey habitat polygons were recorded using a hand-held GPS device, with aerial photographs helping to identify the exact location. Processing of the data, establishment of a database of the mapped area, and editing of maps were performed using ESRI ArcView GIS 3.2 and ESRI ArcGIS 10.0. The maps, at a scale of 1:15,000, show vegetation and habitats of the study area. They display changes occurring within habitats, in habitat types determined by their nature, composition and changes that occurred along their polygon borders. Large vegetation changes caused by the changes in precipitation over the time period can be tracked with the maps which display habitat changes. The area of wetlands increased significantly, whilst areas of meadow and marsh decreased and in their place new complex aquatic habitat forms appeared. The number of habitat complexes also increased because of the presence of water linked to habitat types and fragments. In the humid period, a sustained floodplain groundwater-level increase was observed that resulted in a mosaic appearance in habitats, but led to species degradation.
1. Introduction
As a result of global climate change, an intensification of climate extremes can be observed in recent decades in Europe (CitationAlcamo et al., 2007), resulting in more frequent periods of drought and flood in the Carpathian Basin (CitationBartholy & Pongrácz, 2005, Citation2006, Citation2007). These changes suggest that if the observed trends persist, extreme hydrological conditions (e.g. low water) will become more common, particularly in sensitive areas (CitationKoncsos & Szabó, 2003; CitationNováky, 1991). The effect of climate change is a key issue concerning the water management of the area. A significant change in the water balance of an area affects its water supply (CitationNováky, 1991; CitationNováky, Pachner, Szestay, & Miller, 1985), and has an impact on the flora and fauna of wetlands, on the composition of the ecosystem, and generates significant economic and social change (CitationLáng, Csete, & Jolánkai, 2007; CitationNováky, 1991).
Rainfall data have been recorded since 1901 in Hungary (CitationOrszágos Meteorológiai Szolgálat, 2011). Measurements show that from the beginning of the twentieth century the national average annual rainfall has decreased (CitationBartholy & Pongrácz, 2005, Citation2006). The year 2000 was the driest in the measured period (CitationBartholy & Pongrácz, 2005, Citation2006; CitationOrszágos Meteorológiai Szolgálat, 2011). However, after the year 2000, increased annual rainfall was measured several times. The year 2010 was the wettest year in the past 110 years (CitationOrszágos Meteorológiai Szolgálat, 2011).
Habitat maps presented in this study display the effect of climate and rainfall changes in terms of vegetation (Main Map 1, Main Map 2). Mapping was conducted in the two most extreme years, 2000 which was the driest, and 2010 which was the wettest. The investigated vegetation and habitat types are flood-basin areas along the river that are known to react the most sensitively to environmental changes (in this case to the change in water supply) (CitationBorhidi, 2003; CitationSimon, 2000).
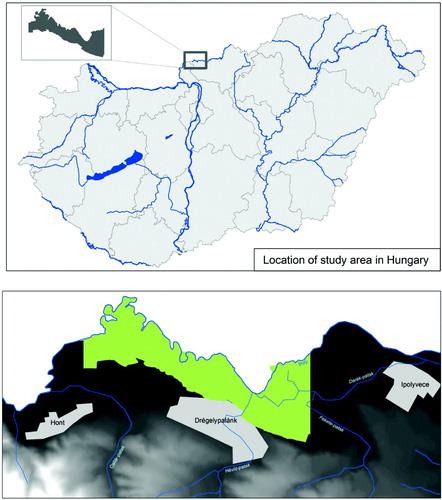
The study area is in northern Hungary, along the River Ipoly, in the municipality of Drégelypalánk, with small areas in Hont and Ipolyvece (). Its extent is 621.5 hectares. Water, marsh and meadow vegetation areas along the River Ipoly are the most precious flora, while original forests are present only in fragments. During intensification of agriculture the majority of meadows were drained and ploughed. The remaining parts are very valuable; most of them are protected or proposed for protection (CitationFüri, 1996; CitationKovács and Máthé, 1967; CitationHrivnák, Ot'ahelová, Cvachová, 1997; CitationMaglocký and Feráková, 1993). Regular flooding, mowing and protection against eutrophication are important for their existence. Meadows examined in Drégelypalánk were extremely rich in the number of species and in rare plant communities. Primary marsh and high sedge meadows are to be found here, and sedge reeds and stocks are also present, as well as floating euhydrophyte communities.
Figure 1. Location of the region of Drégelypalánk (mapped area) in Hungary.
Based on habitat maps from 2000 and 2010 we can assess whether extreme precipitation effects on vegetation and habitat transformation can be determined and if a change is detected, then what kind of vegetation and habitat types are affected and in what way.
2. Methods
Habitat mapping in the study area was completed until 2000. Mapping in this year was coordinated by Danube-Ipoly National Park and Ipoly Union, within the habitat recording framework of nature conservation. The habitat map for 2010 was connected to a project, titled ‘Standardized GIS-based environmental monitoring development of the catchment area of River Ipoly’, with the aim of testing the processes, environmental influences and impacts in the catchment area. This is aimed at establishing which information is essential for protection-based decisions of authorities (CitationVerrasztó, 2010).
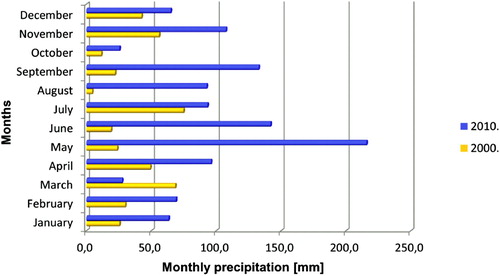
The habitat maps presented here demonstrate extreme climate and precipitation effects on environmental processes. They are relevant because they provide an opportunity to examine local effects of global changes. Habitat maps were investigated together with meteorological data (), and in this way changes in vegetation correlated with meteorological parameters can be explored, and the detailed action of extreme precipitation could be described.
Figure 2. Monthly precipitation of the study area in 2000 and 2010.
Field recording was performed in 2000 and 2010. Experiments extended in all three aspects (spring, summer and autumn) of vegetation during the study. Recordings were performed at the end of April, first half of May, mid-July and mid-September in 2000 and 2010. (‘Averages’ of date recordings were represented in the maps. Thus the low-lying habitats – which were under water during spring, while transformed into mosaics of water-marsh habitats during summer/autumn period – formed water-marsh habitats and not as standing water covered areas.) Aerial photographs were taken in order to make a preliminary differentiation of vegetation units in the study area. For the exact field location of habitat polygons a hand-held GPS device was used. The General National Habitat Classification System (CitationFekete et al., 1997) was applied to classify the habitats. Parallel with habitat mapping dominant species were recorded which were indicating species of the habitat polygons. Coverage of each plant species dominance and mass relations were recorded as well. Data processing, database creation and preparation of maps were carried out using ESRI ArcView GIS 3.2 and ESRI ArcGIS 10.0 software.
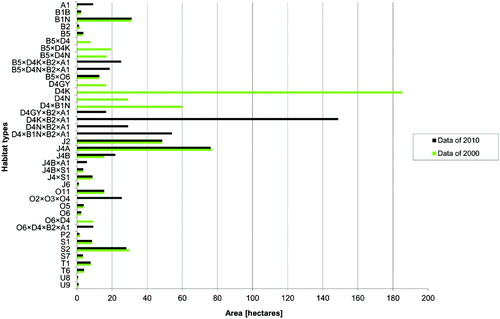
In the study area, 140 habitat polygons from 31 habitat types (in 2000) and 152 habitat polygons from 32 habitat types (in 2010) were recorded ( and ). Usually each habitat polygon belongs to only one habitat type (e.g. B5). However, there were habitat polygons that had more than one habitat type. The main reason for this was that some habitat polygons consisted of mosaics of habitats; these habitat polygons were classified as habitat complexes in the following manner: B5 × D4N × B2 × A1. The results are presented in . Certain habitat categories were separated if mowing had been performed (e.g. D4K), if the habitat was degraded (e.g. D4GY), or if only a single species dominated the area (e.g. B1B, B1N).
Table 1. Habitat types represented on the habitat maps according to the categories of the General National Habitat Classification System.
Table 2. Comparison of habitat data; the habitat types were classified according to the categories of the General National Habitat Classification System.
Whilst editing the habitat maps it was important to clearly track and evaluate changes in habitat types. The two habitat maps were coloured according to the same key in order to make changes obvious, and to determine which habitat polygons had changed. Accordingly, it was important to make sure that the 40 different habitat types could be clearly identified, therefore distinctive colours and fill symbols were used. The type of coloration indicates the complexity of habitats. In the case of ‘simple’ habitats different colours were applied (e.g. A1, B2, B5, J2, etc.). For habitats where the base habitat is the same (e.g. B1) but they are still marked (e.g. B1B, B1N), two a different layers with two different colours were applied: a basic colour for the lower and another colour for the upper layer with a different filling mode (e.g. B1B/B1N, J4A/J4B, etc.). For combined habitats the filling mode indicates how many times the composition is (e.g. in the case of double composition the filling mode of the top layer is a thick broken line while it is a continuous thin line in the case of triple composition). When colouring the double complex habitats (e.g. B5 × O6) the combined habitat colours were used. In the case of triple and quadruple combination habitats (e.g. B5 × D4N × B2 × A1), combined colours were only partly used – on the level of colour groups – if blue and green coloured habitats combined then blue and green colours are included in the legend.
The detailed scale of the maps helped because small habitat polygons that could not be properly displayed at a smaller scale were visible. The diagram and the change map ( and ) next to the habitat maps helps the precise interpretation of the changes and a quantitative comparison of the data of habitat types in the mapped area. Reliability of the changes shown by the maps is based on the exact field survey supported by aerial photographs, a GPS device, and the same method of habitat recording in 2000 and 2010, according to the General National Habitat Classification System.
Figure 3. Change map of the study area.
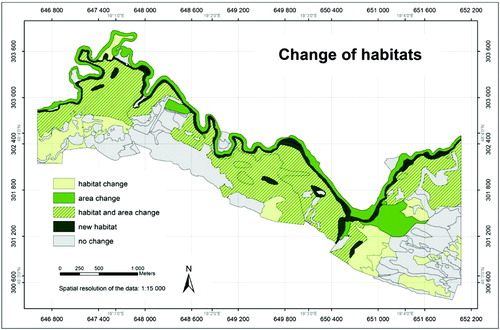
Figure 4. Aerial distribution of habitat types in 2000 and 2010.
3. The habitat maps
Examination of the impact of environmental changes on vegetation is extremely important. Vegetation and habitat mapping are essential tools for any baseline survey and subsequent monitoring. From their information content, an accurate image can be gained of the intensity, nature and direction of processes which occurred in the examined area (e.g. degradation or convergence to the natural state, nutrient enrichment, desiccation, elevated ground water level and appearance of invasive species). These maps are an important basis for ecological research, giving assistance for conservation and other interventions, conservation planning, improving environmental status and long-term preservation (CitationLopez-Garcia & Vega Guzman, 2010).
The maps clearly show a significant difference in the characteristics of the habitats between the two examined periods. Changes were found in the coverage of habitats and in characteristic habitat types of some habitat polygons. The number and extent of wetlands increased significantly between 2000 and 2010. The number of habitat polygons in the euhydrophyte (A1) habitat category increased from 1 to 7, while their surface area increased from 0.09 to 9.16 ha (; ). If the wetlands (A and B habitats and their complexes) are considered as a whole, the results show they were present in the dry period (2000) in 31 polygons (154.88 ha), while they were present in 60 polygons (366.71 ha) in the rainy period (2010), i.e. they dominated 59% of the examined area in 2010. There was a significant change in the area and composition of habitat complexes as well. In 2000, eight different two-habitat-type complexes were represented, while on the map from the year 2010 there were 12 different complexes shown, in several cases with three- or four-habitat types. In total only three categories (J4B × S1, J4 × S1, B5 × O6) were presented in both years, so the majority of complexes changed, and their area increased from 137.09 to 356.49 ha. The map prepared for the wetter year (2010) clearly shows that the aquatic vegetation (A1) in the low-lying treeless habitats appeared almost everywhere (e.g. B5 × D4K × B2 × A1, B5 × D4N × B2 × A1, D4K × B2 × A1, D4 × B1N × B2 × A1). A significant change occurred in the low-lying meadows (D4) as well as in aspects of their subtypes. Homogenous areas of these habitats appeared only in 2000, covering 231.14 ha. They then changed completely, and they were present only in complexes in 2010. Areas of J4B habitat and the number of habitat polygons have also increased considerably. Among the O habitat categories, the O2 × O3 × O4 complex appearance in 2010 was also due to water effects.
According to the maps, vegetation changed significantly between the two years, with a change from extremely dry (2000) to extremely wet conditions (2010). In the two years vegetation showed very large differences, and demonstrated large environmental changes. The area of wetlands increased significantly. Areas of meadows and marsh decreased and in their place new complex aquatic habitat forms appeared. The number of habitat complexes also increased because of the presence of water linked to habitat types and fragments. The extent of forest polygons did not change substantially but there was an increase in the proportion of bushy areas, which may be a result of natural succession. In the aftermath of permanent water coverage new habitat types appeared on the surface of river drift. These habitat types are dominated by ruderal, or pioneer, weed species.
4. Conclusion
The importance of this work is emphasized by the fact that before the year 2000 there were no habitat records for these areas. With the help of the habitat maps the direction of transformation, quality and scale of the habitat types can be determined and changes can be assessed with relevant statistical calculations from information in the databases developed from this work. Changes in vegetation during the period between the two mapping dates were observed and the impact of extreme rainfall on vegetation could be detected. It can be seen that there are habitats that remain unchanged despite changes in precipitation patterns but there are habitats which respond sensitively. The time required for transformation of habitats is different and entirely dependent on habitat types. Marsh and riverside areas are extremely sensitive to water, and for their transformation only a year is enough, while the development of scrub takes several years. Accordingly, how permanent the long-term changes of different habitats are also depend on habitats. Changes of the scrub-woodland habitat polygons are considered constant since the extensive polygons are not likely to start to decline again, but wetlands can transform easily even from year to year. Therefore in the next dry period the areas completely flooded and significantly affected by water are expected to transform, whilst changes of the forest and the scrub polygons will be preserved. Changes in precipitation patterns have a significant effect on the groundwater level from environmental background factors. In the wet period sustained floodplain groundwater-level increase was observed that resulted in the mosaic appearance in habitats, but led to species degradation. Rare aquatic species proliferated, but at the same time a significant decrease was observed in the number of rare species of drier areas, while some species disappeared from the area. These species were preserved in the form of propagules in the soil surviving poor environmental conditions that can then be re-proliferated among more favourable environmental factors.
Overall, it has been emphasized that multi-disciplinary research using this type of map could be carried out on other vegetation communities. With examination of the vegetation habitats of the mapped areas combined with other data (meteorological, hydrological and soil), causal relationships between environmental characteristics and vegetation may be discovered. In addition, these maps provide important information for decisions about the use, management, and conservation planning of the area, as well as the importance of long-term monitoring studies.
Software
Data processing, database establishment and map editing were performed by ESRI ArcView GIS 3.2 and ESRI ArcGIS 10.0 software. Maps were compiled in the Unified National Projection System of Hungary.
Supplemental Material - Map
Download PDF (6.9 MB)Acknowledgements
This work was supported by the Danube-Ipoly National Park, Ipoly Union and Middle-Danube-Valley Inspectorate for Environmental Protection, Nature Conservation and Water Management, which carried out ‘Standardized GIS-based environmental monitoring development of the catchment area of River Ipoly’ (HUSK 0801/2. 1. 2/0162 project).
The study was also assisted by ‘BELVIZ-INFO system’ made by Geoview Systems Ltd. in order to ‘develop an inland water system capable of producing an inland water frequency and endanger map, based on the analysis of individual inland water formation mechanisms’ (GOP-1.1.1-08/1-2008-0025 project). We would like to thank the Editor in Chief and reviewers as their constructive comments and suggestions helped the higher-level preparation of the manuscript and the maps.
References
- Alcamo , J. , Moreno , J. , Nováky , B. , Bindi , M. , Corobov , R. Devoy , P. J. N. 2007 . Climate change 2007: Impacts, adaptations and vulnerability. In M. L. Parry, O. E. Canzione, J. P. Palutikof, P. J. van den Linden, & C. E. Hanson (Eds.) Contribution of Working Group II to the Fourth Assessment Report of Intergovernmental Panel on Climate Change , 541 – 580 . Cambridge , , UK : Cambridge University Press .
- Bartholy , J. and Pongrácz , R. 2005 . Tendencies of extreme climate indicates based on daily precipitation in the Carpathian Basin for the 20th century . Időjárás , 109 : 1 – 20 .
- Bartholy , J. and Pongrácz , R. 2006 . Comparing tendencies of some temperature and precipitation on global and regional scales . Időjárás , 110 : 35 – 48 .
- Bartholy , J. and Pongrácz , R. 2007 . Regional analysis of extreme temperature and precipitation indices for the Carpathian Basin from 1946 to 2001 . Global and Planetary Change , 57 : 83 – 95 .
- Borhidi , A. 2003 . Magyarország növénytársulásai , Budapest : Akadémiai Kiadó .
- Fekete, G., Molnár, Zs., & Horváth, F. (Eds.) (1997). A magyarországi élöhelyek leírása, határozója és a Nemzeti Élöhely-osztályozási Rendszer. Nemzeti Biodiverzitás-monitorozó Rendszer II. Budapest: Magyar Természettudományi Múzeum.
- Füri , A. 1996 . A Duna-Ipoly Nemzeti Park létesítése. Ipoly füzetek , Balassagyarmat , , Hungary : Ipoly Unió Környezetvédelmi és Kulturális Egyesület .
- Hrivnák , R. , Ot'ahelová , H. and Cvachová , A. 1997 . “ Prehľad rastlinných spoločenstiev vôd a močiarov (tr. Lemnetea, Potametea, Phragmiti-Magnocaricetea) navrhovanej ramsarskej lokality Poiplie ” . In Poiplie , Edited by: Urban , P. and Hrivnák , R. 109 – 111 . Banská Bystrica , , Slovakia : SAŽP .
- Koncsos, L., & Szabó, Cs. (2003). Entwicklung ein physikalisches, numerisches Hochwasserabflussmodell. Symposium: Lebensraum Fluss-Hochwasserschutz, Wasserkraft, Ökologie (pp. 192–203). Wolgau, Oberbayern
- Kovács , M. and Máthé , I. 1967 . Die Vegetation des Inundationsgebietes der Ipoly . Acta Botanica Hungarica , 13 : 133 – 168 .
- Láng , I. , Csete , L. and Jolánkai , M. 2007 . A globális klímaváltozás: Hazai hatások és válaszok. A VAHAVA jelentés , Budapest : Szaktudás Kiadóház .
- Lopez-Garcia , J. and Vega Guzman , A. 2010 . Vegetation and land use 2009 Monarch Butterfly Biosphere Reserve, Mexico . Journal of Maps , 2010 : 665 – 673 .
- Maglocký , Š. and Feráková , V. 1993 . Red list of ferns and flowering plants (Pteridophyta and Spermathophyta) of the flora of Slovakia . Biologia, Bratislava , 48 : 361 – 385 .
- Nováky , B. 1991 . Climatic effects on runoff conditions in Hungary . Earth Surface and Landforms , 16 ( 7 ) : 593 – 601 .
- Nováky , B. , Pachner , Cs. , Szesztay , K. and Miller , D. 1985 . “ Water resources ” . In Climate impact assessment. Scope’ , Edited by: Ausubel , J. H. , Kates , R. M. and Berberian , M. Vol. 27 , 187 – 214 . New York : Wiley .
- Országos Meterológiai Szolgálat . 2011 . “ Előrejelzési és Éghajlati Főosztály, É ” . E. O. H. M. S. W. F. & Climate Department . C. A. D. ‘Precipitation datas’. Hungarian Meteorological Service (Országos Meteorológiai Szolgálat) – Weather Forecasting and Climate Department (Elörejelzési és Éghajlati Föosztály) – Climate Analysis Division (Éghajlati Elemzö Osztály)
- Simon , T. 2000 . A magyarországi edényes flóra határozója , Budapest : Tankönyvkiadó .
- Verrasztó , Z. 2010 . Környezeti monitoring vizsgálatok az Ipoly vízgyűjtőjén (célkitűzések és általános tájékoztatás) . Tájökológiai Lapok , 8 ( 3 ) : 535 – 561 .