Abstract
Here we present results from a mapping project on the distribution of glacial end moraine zones in NW Russia, covering an area from the Baltics in the west (30°E) to Taymyr Peninsula and Byrranga mountains (120°E) in the East. Several previous studies have been made in the area, but none have mapped end moraine zones in a uniform way over the whole field area. We suggest that our mapping of moraine distribution in NW Russia, covering an area of about 7 million km2 is the most consistent to date.
Much of the mapped area lies north of 60°N and is thus outside coverage of the high-quality Shuttle Radar Topography Mission digital elevation model. We have been using a new digital elevation data-set consisting of digitized Russian topographic maps (scales 1:100,000 and 1:200,000), combined with optical remote sensing data to map moraine zone distribution.
The mapped moraines in this study are largely in agreement with recent reconstructions of former ice sheet extent in the area. However, several previously undocumented moraines have been identified and our results show that the last glacial maximum Scandinavian ice sheet probably extended further east into Russia than previously thought. In other areas, we also add considerable more detail on former ice sheet extent.
1. Introduction
NW Russia comprises a vast sector of northern hemisphere Quaternary glaciations and large outstanding questions concerning glaciation history still remain to be solved. Throughout the Pleistocene, marine ice sheets from the Barents- and Kara Seas have inundated northern Russia and interacted with terrestrial ice sheets from Scandinavia (CitationKjær et al., 2006, p. 26; CitationLarsen et al., 2006, p. 31) This interplay was complex both from an ice sheet dynamical and climatological perspective (CitationKjær et al., 2006, p. 26; CitationKnies, Kleiber, Matthiesen, Müller, & Nowaczyk, 2001, p. 29; CitationLarsen et al., 2006, p. 31; CitationSvendsen et al., 2004, p. 56). Given the geography of Northern Russia with major rivers draining northwards, the Scandinavian-, Barents- and Kara Sea ice sheets dammed vast lakes during different glacial stages. These lakes in turn may have provoked complex perturbations in regional, and possibly global, atmospheric circulation (CitationKrinner et al., 2004, p. 30; CitationLarsen et al., 2006, p. 31; CitationLyså, Jensen, Larsen, & Fredin, 2011, p. 35; CitationMangerud et al., 2004, p. 36).
There is a paucity of consistent glacial geological data in the investigated area due to its' sheer size and difficult fieldwork logistics. Only a decade ago, this led to widely contrasting views on the mode and history of ice sheets in NW Russia, ranging from ideas of vast coalescing ice sheets (CitationGrosswald & Hughes, 2002, p. 14; CitationHughes, 1998, p. 20), to restricted asynchronous ice sheet expansion (CitationAstakhov et al., 1999, p. 3; CitationLarsen et al., 1999, p. 32). Several of these discrepancies were resolved through large research projects (e.g. QUEEN and PONAM) at the end of the 1990s, and are summarized by CitationSvendsen et al. (2004), where ice sheet limits and chronology of the Saalian (Moscovian) and Weichselian (Valdaian) glaciations are detailed. Albeit the study of CitationSvendsen et al. (2004), was based on fieldwork evidence and a comprehensive literature review that includes Russian literature, little original mapping was performed using optical remote sensing data augmented by digital elevation models (DEMs). Usually, mapping based on remote sensing in Russia has targeted specific areas or scientific questions (CitationAlexanderson et al., 2001, p. 1; CitationNikolskaya, Astakhov, Mangerud, Matiouchkov, & Svendsen, 2002, p. 44; CitationPunkari, 1995, p. 47). In other areas of the world, ice sheet scale mapping of glacial geology and end moraine zones have proved valuable in deciphering the glaciation history, for example in North America (CitationPrest, Grant, & Rampton, 1968, p. 46; CitationSharpe, Sharpe, & Harris, 2010, p. 51), South America (CitationGlasser et al., 2008, p. 13), Scandinavia (CitationKleman, Hättestrand, Borgström, & Stroeven, 1997, p. 28), the British Isles (CitationClark et al., 2004, p. 9; CitationEvans et al., 2005, p. 11), and other parts of Russia (CitationBarr & Clark, 2009, p. 6; CitationHättestrand & Clark, 2006, p. 17). In this study, we have attempted to improve documentation of glacial end moraine zones in NW Russia with the moraine map covering 30°E to 120°E. When considered alongside the publications of CitationBarr & Clark (2009) and CitationHättestrand & Clark (2006) this work ensures that the whole of northern Russia is covered with ice sheet scale mapping of ice marginal landforms.
2. Methods
Glacial end moraines and ice proximal deposits were mapped through on-screen digitization from Shuttle Radar Topography Mission (SRTM) and ViewFinder Panorama (VFP) (Citationde Ferranti, 2012, p. 12) DEMs, and Landsat ETM+ optical satellite imagery. Moraines were visually identified and digitized as polylines in an ArcGIS file geodatabase. Two operators (Fredin and Rubensdotter) independently performed mapping, passing over the area at least two times at varying scales. Moraines were classified into the following three classes: (1) large moraines and ice marginal zones with a distinct morphology; (2) smaller moraines, still with distinct morphology; and (3) landforms with morphology resembling moraines, but shape or setting that makes their origin uncertain. The datasets generated by the two operators were then compared, with a approximately 90% correlation. The bulk of the two datasets could thus be merged without problem, while outliers mapped by only one operator were scrutinized by both operators and were either deleted or classified as uncertain. Several moraines in the Severnaya Dvina, Vychegda, Vaga and Vologda areas were checked during one field season.
The SRTM DEM, and it's use, is well documented (CitationNASA, 2012, p. 43),while the relatively new VFP DEM has received less attention. The VFP digital elevation data are based on digitized Russian topographic maps at scales 1:100,000 and 1:200,000, with an interpolated grid resolution of 90 m, resembling SRTM data both in use and quality (Citationde Ferranti, 2012, p. 12). A comparison of the VFP data in northern Norway, with the Norwegian Ordnance Survey 25-meter resolution DEM, reveals that the VFP DEM depicts topography very well in low-to-medium relief terrain with errors of less than 5 m. In high relief terrain, for example on a fjord coast, the errors are larger in steep tracts but remain reliable in low relief areas. This impression was reinforced during fieldwork in the very low relief areas of NW Russia, where the VFP elevation model appeared to be as reliable as a hand-held GPS unit and topographic maps. We also used the ASTER GDEM DEM (CitationASTER, 2012, p. 4), but these data were generally inferior to the VFP data, with noise, gaps and artefacts.
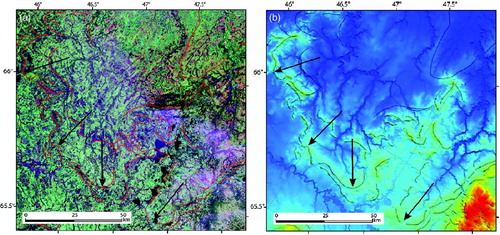
The majority of mapping was performed using shaded relief images with satellite data as a supporting data set. Often, moraine identification was very difficult using satellite images alone due to heterogeneous land use, vegetation, uniform sediment composition and permafrost degradation (). Shaded relief images greatly aided interpretation and were produced with varying sun angle and azimuth, as well as different colour coding, to facilitate mapping of moraine ridges of varying direction and magnitude (CitationJansson & Glasser, 2005, p. 22; CitationSmith & Clark, 2005, p. 52; CitationSmith & Wise, 2007, p. 55).
Figure 1. (A) Landsat ETM+ (band composite 742) showing moraine ridges and plateaus affected by permafrost degradation in NW Russia. (B) VFP shaded relief image of the same area showing moraine ridges more clearly. The shaded relief colour table is stretched to optimize moraine landform detection. Total relief in the image is about 100 m. Black arrows shows moraine lobes in both A and B.
We have restricted our mapping effort mainly to Russia, between approximately 30°E and 120°E, but have also mapped end moraines in Belarus and easternmost Finland to compare our data with already published studies (CitationKalm, Raukas, Rattas, & Lasberg, 2011, p. 24; CitationKarbanov & Matveyev, 2011, p. 25; CitationLunkka, Saarnisto, Gey, Demidov, & Kiselova, 2001, p. 34; CitationPutkinen & Lunkka, 2008, p. 48). We also tested our data comparing results with (CitationNikolskaya et al. 2002, p. 44) in the Pechora area. In general there is a good agreement between the datasets. However, it appears that this study shows more end moraine zones than older studies, and that more recent studies, utilizing the SRTM DEM (CitationKalm et al., 2011, p. 24), agrees well with our observations. We have omitted the Kola peninsula and the Baltics because this work does not contribute with more data when compared to recent studies in these areas (CitationGuobyte & Satkunas, 2011, p. 16; CitationHättestrand, 2006, p. 17; CitationHättestrand, Kolka, & Stroeven, 2007, p. 18; CitationKalm et al., 2011, p. 24; CitationRaukas, 2009, p. 49).
For cartographic reasons, the main map covers areas north of 55° and we have therefore omitted the well-known Don and Dnieper lobes of pre-Weichselian origin that reach almost as far south as the Black Sea (CitationSvendsen et al., 2004, p. 56). Without this restriction there would be very large empty portions of the map to the east allowing for the big southerly lobes in the western sector.
We believe the mapped distribution of moraines to be representative of the real distribution of major moraines and ice marginal zones. However, we acknowledge that data resolution of the DEMs and optical imagery has limited the detection of smaller moraines. This is likely not a significant problem in the lowlands affected by the Scandinavian and Barents-/Kara Sea ice sheets, which appear to have deposited large moraines. Smaller moraines deposited by local glaciers in highlands may well have passed undetected. We thus consider the dataset robust at an ice sheet scale, but less reliable on a local scale.
3. Moraine morphology, distribution and age
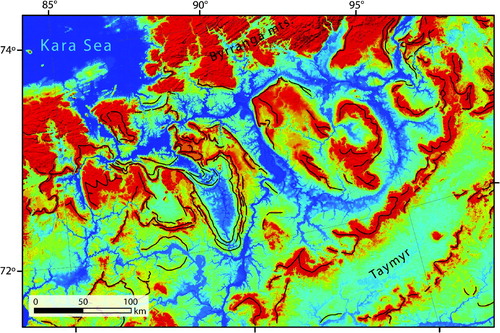
Approximately 1650 moraines or moraine segments were mapped. Most of the moraine zones in the lowlands are very large and exhibit a distinct lobate morphology. Many moraine ridges are typically kilometres wide, between 20- and 100-m high and sometimes hundreds of kilometres long (). In the south-western part of the area, which was generally affected by the Scandinavian Ice Sheet, moraines appear to be smooth and arcuate and are situated in wide, shallow valleys. Fieldwork in the area shows that several of these moraines consist of, or are draped by, sand which is consistent with deposition in pro-glacial ice dammed lakes (CitationLarsen et al., 2006, p. 31; CitationLyså et al., 2011, p. 35). Further to the north and east, in the Pechora basin, Gydan Penisula and Taymyr areas, which are generally affected by Barents- and Kara Sea ice sheets (CitationMöller, Bolshiyanov, & Bergsten, 1999, p. 40; CitationMöller, Hjort, Alexanderson, & Sallab, 2011, p. 41), the moraines are usually even larger, and are often interconnected into intricate moraine zone systems (). These moraines are generally also affected by dead-ice or permafrost disintegration. We suggest that these different moraine morphologies reflect a range of glacial deposition regimes, post-glacial permafrost conditions and disintegration, and warrant further consideration.
Figure 2. Moraine ridges and complex moraine zones (black lines on moraine crests) on the Taymyr Peninsula reflecting the past extent of the Kara Sea and Byrranga Mountains ice sheets. The moraines are hundreds of kilometres long and about 100 m high.
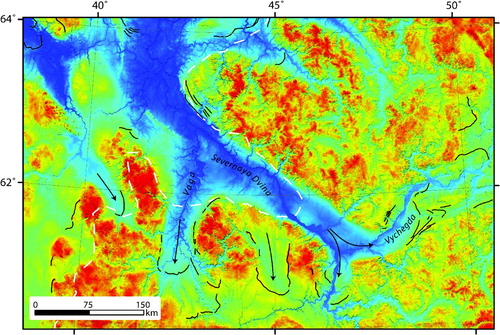
We have not attempted to assign ages to the mapped moraines. Instead we rely on the reconstruction of CitationSvendsen et al. (2004) for chronostratigraphic control. From a geomorphological perspective, we note for example that moraines located outside the inferred Weichselian (Valdaian) limit (CitationLarsen et al., 1999, p. 32; CitationSvendsen et al., 2004, p. 56) appear to be more degraded by fluvial- and permafrost activity. Elsewhere, we note that revisions to the reconstructions of CitationLarsen et al. (1999), CitationLarsen et al. (2006) and CitationSvendsen et al. (2004) might be needed, which is also supported by (CitationKalm, 2012, p. 23). Most notably in the Severnaya Dvina to Vologda area, our mapping suggests that the Last Glacial Maximum ice sheet extended about 150 km further east than previously thought (CitationLyså et al., 2011) (). There are likely other areas to the east that also needs close scrutiny and possible revision of ice sheet extent and geometry.
Figure 3. Comparison between previously published ice extent (white stippled line) (CitationLarsen et al., 2006, p. 31), and mapped end moraines in this study (black lines) in the Severnaya Dvina area. Arrows indicates inferred LGM ice movement. Total relief in the image is about 250 m and moraines are typically 20–50 m high.
4. Conclusions
The presented map reveals a large number of moraine zones in northwestern Russia, several of which have not been described before. The general distribution of moraines is consistent with the most recent reconstructions based on literature reviews and field work, but this study adds considerable detail and spatial coverage using laterally homogenous DEMs and remote sensing data.
It is clear that NW Russia has undergone a dynamic and complex history of expanding and retracting ice sheets emanating, at different times, from Scandinavia, and the Barents- and Kara seas. This has led to vast and complex zones of end moraines, several of which are of unknown age and origin. The picture emerging from this work has implications for reconstructing Pleistocene ice sheet history and environmental change in northern Eurasia. There are still fundamental questions remaining to be solved in this vast area, including chronology, mode and dynamics of Quaternary glaciations, all of which require concerted efforts in mapping and field work.
Software
The DEMs used for mapping were mosaicked and projected using ESRI ArcGIS 10. Shaded relief images of the elevation models were prepared using ERDAS ER Mapper. Satellite imagery was also georeferenced and processed using ERDAS ER Mapper. On-screen digitization was performed in ESRI ArcGIS 10 and final map production was performed using Adobe Illustrator CS4.
Supplemental Material - Map
Download PDF (9.9 MB)Acknowledgements
We thank Jonathan de Ferranti of Viewfinder panoramas for invaluable work to digitize and publish digital elevation data and for helpful responses to our queries. Parts of the main map were plotted using the Generic Mapping Tools (CitationWessel & Smith, 1998, p. 62). We thank Dr Fischer, Professor Kalm, Dr Barr and Mr Gulley for very constructive and helpful reviews on both the map and article. Journal editor Mike Smith is thanked for his patience during the revision process! Norwegian Research Council grants GlaciPet and SciencePub to Eiliv Larsen provided funding for the project.
References
- Alexanderson , H. , Hjort , C. , Möller , P. , Antonov , O. and Pavlov , M. 2001 . The North Taymyr ice-marginal zone, Arctic Siberia – a preliminary overview and dating . Global and Planetary Change , 31 : 427 – 445 .
- Astakhov , V. I. , Svendsen , J. I. and Matiouchkov , A. 1999 . Marginal formations of the last Kara and Barents ice sheets in northern European Russia . Boreas , 28 : 23 – 45 .
- ASTER. (2012). ASTER GDEM. Retrieved January 2012, from http://www.gdem.aster.ersdac.or.jp/
- Barr , I. D. and Clark , C. D. 2009 . Distribution and pattern of moraines in far NE Russia reveal former glacial extent . Journal of Maps , v2009 : 186 – 193 .
- Boulton , G. S. and Clark , C. D. 1990 . A highly mobile Laurentide ice-sheet revealed by satellite images of glacial lineations . Nature , 346 : 813 – 817 .
- Clark , C. D. , Evans , D. J. A. , Khatwa , A. , Bradwell , T. , Jordan , C. J. , Marsh , S. H. and … Bateman , M. D. 2004 . Map and GIS database of glacial landforms and features related to the last British Ice Sheet . Boreas , 33 : 359 – 375 .
- de Ferranti, J. (2012). Viewfinder panoramas. Retrieved January 2012, from http://www.viewfinderpanoramas.org/
- Evans , D. J. A. , Clark , C. D. and Mitchell , W. A. 2005 . The last British Ice Sheet: A review of the evidence utilised in the compilation of the Glacial Map of Britain . Earth-Science Reviews , 70 : 253 – 312 .
- Glasser , N. F. , Jansson , K. N. , Harrison , S. and Kleman , J. 2008 . The glacial geology and Pleistocene history of South America between 38°S and 56°S . Quaternary Science Reviews , 27 : 365 – 390 .
- Grosswald , M. G. and Hughes , T. J. 2002 . The Russian component of an Arctic ice sheet during the Last Glacial Maximum . Quaternary Science Reviews , 21 : 121 – 146 .
- Guobyte , R. and Satkunas , J. 2011 . “ Quaternary glaciations - extent and chronology, 1st Edition: A closer look ” . In 19 - Pleistocene glaciations in Lithuania , Edited by: Ehlers , J. , Gibbard , P. and Hughes , P. D. 231 – 246 . Amsterdam, The Netherlands : Elsevier .
- Hättestrand , C. and Clark , C. D. 2006 . The glacial geomorphology of Kola Peninsula and adjacent areas in Murmansk Region, Russia . Journal of Maps , v2006 : 30 – 42 .
- Hättestrand , C. , Kolka , V. and Stroeven , A. P. 2007 . The Keiva ice marginal zone on the Kola Peninsula, northwest Russia: A key component for reconstruction the palaeoglaciology of the northeastern Fennoscandian Ice Sheet . Boreas , 36 : 352 – 370 .
- Hughes , T. J. 1998 . Ice sheets , New York, NY : Oxford University Press .
- IBCAO. (2012). International Bathymetric Chart of the Arctic Ocean. Retrieved January 2012, from http://www.ngdc.noaa.gov/mgg/bathymetry/arctic/
- Jansson , K. N. and Glasser , N. F. 2005 . Using Landsat 7 ETM+ imagery and digital terrain models for mapping glacial lineaments on former ice sheet beds . International Journal of Remote Sensing , 26 : 3931 – 3941 .
- Kalm , V. 2012 . Ice-flow pattern and extent of the last Scandinavian Ice Sheet southeast of the Baltic Sea . Quaternary Science Reviews , 44 : 51 – 59 .
- Kalm , V. , Raukas , A. , Rattas , M. and Lasberg , K. 2011 . “ Quaternary glaciations - extent and chronology, 1st Edition: A closer look ” . In 8 - Quaternary glaciations in Estonia , Edited by: Ehlers , J. , Gibbard , P. L. and Hughes , P. D. 95 – 104 . Amsterdam, The Netherlands : Elsevier .
- Karbanov , A. K. and Matveyev , A. V. 2011 . “ Quaternary glaciations - extent and chronology, 1st Edition: A closer look ” . In 3 - The Pleistocene glaciations in Belarus , Edited by: Ehlers , J. , Gibbard , P. and Hughes , P. D. 29 – 35 . Amsterdam, The Netherlands : Elsevier .
- Kjær , K. H. , Larsen , E. , Funder , S. , Demidov , I. , Jensen , M. , Håkansson , L. and Murray , A. 2006 . Eurasian ice sheet interaction in northwestern Russia throughout the late Quaternary . Boreas , 35 : 444 – 475 .
- Kleman , J. , Hättestrand , C. , Borgström , I. and Stroeven , A. P. 1997 . Fennoscandian palaeoglaciology reconstructed using a glacial geological inversion model . Journal of Glaciology , 43 : 283 – 299 .
- Knies , J. , Kleiber , H. P. , Matthiesen , J. , Müller , C. and Nowaczyk , N. 2001 . Marine ice-rafted debris records constrain maximum extent of Saalian and Weichselian ice-sheets along the northern Eurasian margin . Global and Planetary Change , 31 : 45 – 64 .
- Krinner , G. , Mangerud , J. , Jakobsson , M. , Crucifix , M. , Ritz , C. and Svendsen , J. I. 2004 . Enhanced ice sheet growth in Eurasian owing to adjacent ice-dammed lakes . Nature , 427 : 429 – 432 .
- Larsen , E. , Kjær , K. H. , Demidov , I. , Funder , S. , Grøsfjeld , K. , Houmark-Nielsen , M. and … Lyså , A. 2006 . Late Pleistocene glacial and lake history of northwestern Russia . Boreas , 35 : 391 – 606 .
- Larsen , E. , Lyså , A. , Demidov , I. , Funder , S. , Houmark-Nielsen , M. , Kjær , K. H. and Murray , A. 1999 . Age and extent of the Scandinavian ice sheet in northwest Russia . Boreas , 28 : 92 – 114 .
- Lunkka , J. P. , Saarnisto , M. , Gey , V. , Demidov , I. and Kiselova , V. 2001 . Extent and age of the last glacial maximum in the southestern sector of the Scandinavian ice sheet . Global and Planetary Change , 31 : 407 – 425 .
- Lyså , A. , Jensen , M. , Larsen , E. and Fredin , O. 2011 . Ice-distal landscape and sediment signatures evidencing damming and drainage of large pro-glacial lakes, NW Russia . Boreas , 40 : 480 – 497 .
- Mangerud , J. , Alexanderson , H. , Astakhov , V. I. , Clarke , G. , Henriksen , M. , Hjort , C. and … Svendsen , J. I. 2004 . Ice-dammed lakes and rerouting of the drainage of Northern Eurasia during the last glaciation . Quaternary Science Reviews , 23 : 1313 – 1332 .
- Möller , P. , Bolshiyanov , D. Y. and Bergsten , H. 1999 . Weichselian geology and palaeoenvironmental history of the central Taymyr Peninsula, Siberia, indicating no glaciation during the last global glacial maximum . Boreas , 28 : 92 – 114 .
- Möller , P. , Hjort , C. , Alexanderson , H. and Sallaba , F. 2011 . “ Quaternary glaciations - extent and chronology, 1st Edition: A closer look ” . In 28 - Glacial history of the Taymyr Peninsula and the Severnaya Zemlya Archipelago, Arctic Russia , Edited by: Ehlers , J. , Gibbard , P. and Hughes , P. D. 373 – 384 . Amsterdam, The Netherlands : Elsevier .
- NASA. (2012). Shuttle radar topography mission. Retrieved January 2012, from http://www2.jpl.nasa.gov/srtm/
- Nikolskaya , O. , Astakhov , V. I. , Mangerud , J. , Matiouchkov , A. and Svendsen , J. I. 2002 . Geomorphological map of the Pechora Basin and adjacent areas , St. Petersburg , , Russia : Institute of Remote Sensing Methods for Geology (NIIKAM) .
- NOAA, N. G. D. C. (2010). GSHHS - A Global Self-consistent, Hierarchical, High-resolution Shoreline Database. Retrieved January 2012, from http://www.ngdc.noaa.gov/mgg/shorelines/gshhs.html
- Prest , V. K. , Grant , D. R. and Rampton , V. N. 1968 . Glacial map of Canada , Geological Survey of Canada. Map 1253A .
- Punkari , M. 1995 . Glacial flow systems in the zone of confluence between the Scandinavian and Novaja Zemlya ice sheets . Quaternary Science Reviews , 14 : 589 – 603 .
- Putkinen , N. and Lunkka , J. P. 2008 . Ice stream behaviour and deglaciation of the Scandinavian ice sheet in the Kuittijärvi area, Russia Karelia . Bulletin of the Geological Society of Finland , 80 : 19 – 37 .
- Raukas , A. 2009 . When and how did the continental ice sheet retreat from Estonia? . Quaternary International , 207 : 50 – 57 .
- Rinterknecht , V. R. , Clark , P. U. , Raisbeck , M. G. , Yiou , F. , Bitinas , A. , Brook , E. J. and … Raukas , A. 2006 . The last Deglaciation of the Southeastern sector of the Scandinavian ice sheet . Science , 311 : 1449 – 1452 .
- Sharpe , J. , Sharpe , D. and Harris , J. 2010 . A flowline map of glaciated Canada based on remote sensing data . Canadian Journal of Earth Sciences , 47 : 89 – 101 .
- Smith , M. J. and Clark , C. D. 2005 . Methods for the visualization of digital elevation models for landform mapping . Earth Surface Processes and Landforms , 30 : 885 – 900 .
- Smith , M. J. and Wise , S. M. 2007 . Problems of bias in mapping linear landforms from satellite imagery . International Journal of Applied Earth Observation and Geoinformation , 9 : 65 – 78 .
- Svendsen , J. I. , Alexanderson , H. , Astakhov , V. I. , Demidov , I. , Dowdeswell , J. A. , Funder , S. and … Stein , R. 2004 . Late Quaternary ice sheet history of northern Eurasia . Quaternary Science Reviews , 23 : 1229 – 1271 .
- Wessel , P. and Smith , W. H. F. 1998 . New, improved version of the Generic Mapping Tools released . Eos Transactions , 79 : 579