Abstract
The Kloštar Oil Field is situated at the north-western part of Sava Depression in the Croatian part of the Pannonian Basin. It is a typical geological structure that evolved through the Neogene and Quaternary and that is why the structural evolution is reconstructed using palinspastic mapping (i.e., using selected chronostratigraphic horizons as datum planes). The total map set includes six structural and 15 palaeostructural maps interpolated over five E-log markers and one border. The mapping has been performed using the Ordinary Kriging. The maps were used for the interpretation of geological evolution during the Neogene and Quaternary, and particularly a description of hydrocarbon reservoir formation and migration pathways. The structural development can be explained through two phases of transtension and two of transpression that existed regionally in the Sava Depression. However, the maps and cross-sections that are described locally show changes of dominant tectonic styles, particularly during the Quaternary when most of the field was a depositional centre.
1. Introduction
The Kloštar Field is one of the largest hydrocarbon fields in the Sava Depression. Previous results of palinspastical analysis in different regions of the Croatian part of the Pannonian Basin System (CPBS) have been given in several scientific papers, e.g., CitationHernitz and Jurak (Citation1973), CitationHernitz, Velić, Kranjec, and Najdenovski (Citation1980) and CitationVelić, Malvić, and Cvetković (Citation2011). Regarding the Kloštar Field, this is the second comprehensive palinspastic reconstruction of Neogene and Quaternary evolution, which closely follows the results published by CitationVelić et al. (Citation2011). Presented analyses, together with that study, give a complete set of thickness maps for the field. Therefore, these maps can be used as an interpretation of geological evolution during the Neogene and Quaternary for any larger structure inside the Sava Depression.
2. Geography
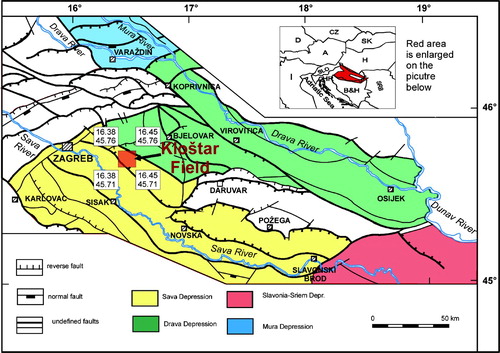
The Kloštar Field is located about 35 km east/southeast of the Croatian capital Zagreb, and administratively is part of Zagrebačka County. The field site, geographically, is in the alluvium of the Sava River, i.e., in the Sava Depression (), which represents the southwestern margin of the Pannonian Basin System. The present-day topography is influenced by the Moslavačka gora Mt. (peak is 489 m). Therefore, the surface of the Kloštar structure is located along the western slopes of the mountain. The field margins on the surface cover about 30 km2.
Figure 1. Geographical and regional geological schematic map of Kloštar Field (modified from CitationVelić, Citation2007).
3. Geological settings
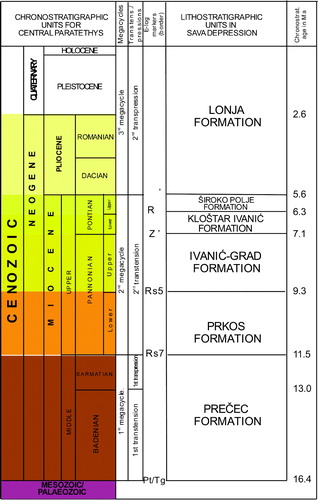
The Kloštar Field is in the western part of the Sava Depression, where hydrocarbon reservoirs are within Miocene sandstones and tectonised Palaeozoic basement schists. Miocene sediments are up to 1600 m thick and transgressive over an unconformity with Palaeozoic magmatites and metamorphites in the base. The complex structural evolution resulted in the formation of 20 reservoirs as independent hydrodynamic units. A total of 172 wells have been completed. The field is an anticline, striking northwest-southeast, which also includes the Northern marginal fault of the Sava Depression, which represents the border between depositional areas for Upper Pannonian and Lower Pontian sandstones. Analyses have been undertaken, based on Croatian lithostratigraphic nomenclature (CitationŠimon, 1980), of the Neogene and Quaternary sediments valid for the Sava Depression ().
Figure 2. Formal lithostratigraphic and chronostratigraphic units, E-log markers/border, and absolute ages in the Sava Depression.
Mapping horizons included marls as key-beds defined on E-logs as markers (from regionally characteristic shapes on apparent resistivity log curves). This is why the marker beds are named E-markers. One ‘horizon’ (named ‘Tg’) is in fact the unconformity between the Palaeozoic and Neogene and is consequently named an E-border, i.e., physical border (not marker or key-bed). It is defined as a border between very different apparent resistivity values observed on electro logs on the top and bottom rocks of the unconformity.
The Neogene and Quaternary sedimentary complex was subdivided into three major megacycles (CitationVelić, 2007; CitationVelić, Weisser, Saftić, Vrbanac, & Ivković, 2002). The oldest (1st) megacycle represents the Prečec Formation of Badenian and Sarmatian age (only locally in depression also Early Miocene). The sedimentary complex is extremely heterogeneous, comprising breccias, conglomerates, sandstones, siltstones, shales, marls, igneous rocks, and limestones. The Prkos, Ivanić-Grad, Kloštar Ivanić, and Široko Polje Formations belong to the second megacycle, i.e., to Pannonian and Pontian stages. These formations are defined as monotonic alterations of marlstones and sandstone sequences. The third megacycle is represented by the Lonja Formation of Pliocene and Quaternary age. It is composed mostly of unconsolidated sediments, i.e., sands, gravels, loess, and some lignite. Major oil and gas reservoirs are within sandstones of the second megacycle.
4. Applied data selection and mapping methodologies
The first part of the analysis included structural and thickness maps. The point (hard) data were interpolated using Ordinary Kriging, which has been previously proven the best interpolator in this field (CitationBalić, Velić, & Malvić, 2008). The second part of the analysis was the creation of a longitudinal cross-section across the field's structure, based on Kriging maps. The number of point values (i.e., thicknesses measured in wells) varied from more than 20 for the deepest mapped border (‘Tg”) to about 120 for the youngest E-log marker (α as the border between the Miocene and Pliocene).
4.1. Palinspastical reconstruction applied on the Neogene-Quaternary sediments in the Kloštar Field
The term ‘palinspastic’ was introduced by CitationKay (Citation1937) for a palaeotectonic map in which the features have been restored as nearly as possible to their original positions. Some of the first regional palinspastic reconstructions in the Sava Depression were reported by CitationHernitz and Jurak (Citation1973) and CitationHernitz et al. (Citation1980). The maximum number of palaeostructural maps is defined with:
Where:
N – Total number of structural maps that can be derived from the set of available borders;
n – Number of available borders (here borders are E-log markers).
All intervals that could be interpolated in the Kloštar Field are given in . The six marker/border planes are selected as the top and bottom of formations.
Table 1. Interpolated palaeostructural maps in the Kloštar Field (grey are maps given in CitationVelić et al., 2011; orange are maps given in this paper).
Palaeostructural maps can be divided into structural (when the top is present-day relief or datum plane, here +100 m) and palaeothickness maps (when the top and bottom are both subsurface). Therefore palaeothickness maps represent thicknesses of units formed in the past. The structural maps, a type of thickness map, include the top plane which is still exposed to surface sub-aerial or sub-water present-day processes. Structural and palaeothickness maps of particular lithostratigraphic formations for the Kloštar Field have already been published ( – grey shading) by CitationVelić et al. (Citation2011). For this paper, we present additional thickness maps that encompass two or more formations ( – see orange shading).
4.2. Parameters of applied Kriging interpolation
There are two geostatistical approaches (deterministic and stochastic) and many geostatistical techniques that could be applied to the mapping of hydrocarbon reservoirs. Each of these methods includes modelling uncertainties, which can be minimised as data increase. All maps were interpolated using Ordinary Kriging ( e.g., in CitationHohn, 1988; CitationIsaaks and Srivastava, 1989; CitationJournel & Huijbregts, 1978; CitationMathéron, 1965). The same or similar techniques have been applied in the other parts of the CPBS (CitationMalvić, 2003, Citation2005; CitationMalvić & Bastaić, 2008; CitationMalvić & Đureković, 2003, Citation2004; CitationMalvić & Prskalo, 2008) or in the same field (CitationBalić et al., 2008). Variogram models were calculated and approximated with the theoretical model.
5. Interpretation of selected thickness maps
Thickness map Tg-Rs5 (Main Map 1) represents the Prečec and Prkos Formations. Due to sparse data, mapping the thickness of the Prečec and Prkos Formations has only been possible in some areas. The thickness reaches 500 m in the mapped area, but is mostly in the range of 100 to 300 m.
Thickness map Tg- Z' (Main Map 2) shows the Prečec, Prkos and Ivanić Grad Formations. The lack of data restricted mapping of the whole area again. Thickness varies from 250 to 650 m. The distribution of sediments is almost the same as on the previous map.
Thickness map Tg- Rϕ (Main Map 3) represents the Prečec, Prkos and Ivanić Grad and Kloštar Ivanić Formations. The position of the thicker sediments is still similar, i.e., the maximum is again in the central part of the map, but the minimum is now observed in the southeast (previously was in the northwest).
Thickness map Tg- α ' (Main Map 4) includes the Prečec, Prkos and Ivanić Grad, Kloštar Ivanić and Široko Polje Formations. The thinner sediments are at the southeastern portion of the field, less than 600 m. The greatest thicknesses, more than 1400 m, are in the central part of the map.
Thickness map Rs7- Z' (Main Map 5) shows the Prkos and Ivanić Grad Formations. The maximum thickness is in the central part of the map, while minimum thickness values (100–250 m) are located in the northwestern, southeastern, and in the portion of the central area.
Thickness map Rs7- Rϕ (Main Map 6) includes the Prkos, Ivanić Grad, and Kloštar Ivanić Formations. Thicknesses vary from 250 to 850 m. The highest value slightly decreases from the northern to central portions of the map. The southern portion is characterised by thinner sediments with a minimum of 250 m in the southeastern corner of the map.
Thickness map Rs7- α ' (Main Map 7) represents the Prkos, Ivanić Grad, Kloštar Ivanić, and Široko Polje Formations. This map shows the greatest thickness changes and displacements along a NW-SE fault line. The maximum thickness is 1400 m and is located at the southwestern portion of the map.
Thickness map Rs5- Rϕ (Main Map 8) shows only the Kloštar Ivanić and Ivanić Grad Formations. Sediments are predominantly 400–550 m thick, with thicker sediments (>600 m) in the north-central portion of the map. The thinnest sediments, a result of faulting, occur near the northwest corner of the map.
Thickness map Rs5- α ' (Main Map 9) is very similar to the Rs7-α' map (Main Map 7). Those two maps describe the same formations except that Rs7-α' includes the Prkos Formation. The thickness changes and displacements from northwest to southeast are the result of fault activity.
Thickness map Z'- α ' (Main Map 10) describes the Kloštar Ivanić and Široko Polje Formations. It is similar to maps Rs7-α' (Main Map 7) and Rs5-α' (Main Map 9). The main northwest-southeast fault caused thickness variations in the central part of the field. That fault divides thicker parts of the unit to the southwest from thinner parts to the northeast.
6. Interpretation of constructed palinspastic cross section
To display thickness variations along the vertical section (i.e., depth), a palinspastic section is constructed (Section 1). The thickness and elevation data used for constructing the cross-section were well data calculated from E-logs. The northwest-southeast strike of the cross-section (Section 1) is shown on all maps (Main Maps 1-10). The thickness of the oldest Prečec Formation (Section 1) significantly differs from other formations, especially in the central portion of the section. The Palaeozoic palaeorelief has caused development of a heritage structure (i.e., structures of similar shape to older ones) during the Badenian, Sarmatian, and Early Pannonian. The Early Pannonian Prkos Formation (Section 1) is relatively thin compared to the older Prečec Formation and even with all younger formations. It is a result of the first transpressional phase in the CPBS that was active during the Sarmatian (CitationMalvić & Velić, 2011) and obviously also active here during the Early Pannonian.
The overlaying Ivanić-Grad and Kloštar Ivanić Formations (Section 1) were deposited during the period of the second transtension (CitationMalvić & Velić, 2011), i.e., during the deposition of large quantities of sand and silt inside a brackish lake environment. Turbiditic currents represented the main transport mechanisms for such detritus. The two youngest formations (Široko Polje and Lonja Formations; Section 1) are the thickest because of local subsidence. This is an interesting result because from the Late Pontian to the end of the Quaternary (recent) there lasted the second transpressional phase, which generally dominated the entire CPBS (CitationMalvić & Velić, 2011). However, local zones of kilometre dimensions were continuously sinking (e.g., in the Kloštar structure), probably supporting the existence of Pliocene-Quaternary fluvial and marshy environments. This can clearly be observed in the southeastern part of Section 1. In the Lonja Formation the inversion of the structure can be observed, particularly in the southeast where almost complete inversion of the Early Pontian-Badenian anticline is observed. Interestingly, such young subsidence did not invert all anticlines formed in the Late Miocene, which later trapped hydrocarbons and formed numerous reservoirs.
7. Conclusions
The purpose of this study was to reconstruct geological events from the development of the earliest Badenian structures in the Kloštar Field, their evolution through the Late Miocene and Pliocene, and their eventual structural formation during the Quaternary. Associated maps displaying classic palinspastic reconstructions, including thickness maps and one characteristic cross-section. The results presented by the maps and cross section can be summarised as:
| 1. | Sedimentation of the oldest Prečec Formation (Badenian and Sarmatian) was mostly influenced by Palaeozoic paleorelief combined with synsedimentary tectonics. | ||||
| 2. | The Lower Pannonian sediments of the Prkos Formation are the thinnest as a result of the extended influence of the first regional transpression. | ||||
| 3. | The second transtension, with the deposition of reservoir sands, lasted through the Late Pannonian and Early Pontian, but generally structures still maintained some of the morphology of the older palaeorelief. However, in the northwesterrn portion of the area, inversion of structures (shapes) formed before the Late Pannonian was significant. | ||||
| 4. | The northwestern part of the structure was again transpressed (second transpression) during the Late Pontian. | ||||
| 5. | Sedimentation of the youngest Lonja Formation (Pliocene and Quaternary) is characterised by a different style than prevailing transpressional mechanisms throughout most of the CPBS. New depositional areas and a large thickness are observed on the northwest and southeast margins of the field. The older uplifted palaeorelief mostly remained in the northwestern part. | ||||
| 6. | The main uplifted zones formed at the end of the Late Pontian and some of them were even inverted on the southeastern margin during deposition of the Lonja Formation. | ||||
| 7. | Contemporary hydrocarbon traps formed during the Pliocene and Quaternary. It was also a time of hydrocarbon migration upward due to gravitational separation inside the reservoir rocks (secondary migration). | ||||
Software
Thickness maps were interpolated using Golden Software's Surfer 8.0.
Supplemental Material - Map
Download PDF (3.8 MB)Acknowledgements
We would like to thank Ms Katy Ashwin for production of the regional location map on the title page.
References
- Balić , D. , Velić , J. and Malvić , T. 2008 . Selection of the most appropriate interpolation method for sandstone reservoirs in the Kloštar oil and gas field . Geologia Croatica , 61 ( 1 ) : 27 – 36 .
- Hernitz , Z. and Jurak , V. 1973 . Primjena paleostrukturne i statističke analize naslaga mlađeg tercijara u području Ivanić-Grada (Sjeverna Hrvatska) [Application of palaeo-structural and statistical analysis of the younger Tertiary sediments in the Ivanić-Grad area (Northern Croatia)-in Croatian] . Nafta , 24 ( 7–8 ) : 343 – 367 .
- Hernitz , Z. , Velić , J. , Kranjec , V. and Najdenovski , J. 1980 . Prikaz diferencijalnih maloamplitudnih struktura s primjerima iz Savske potoline (Panonski bazen) [Presentation of differential low-amplitude structures with examples from the Sava Depression (Pannonian Basin)-in Croatian] . Nafta , 12 ( 7–8 ) : 399 – 409 .
- Hohn , M. E. 1988 . Geostatistics and petroleum geology , New York, NY : Van Nostrand Reinhold .
- Isaaks , E. and Srivastava , R. 1989 . An introduction to applied geostatistics , New York, NY : Oxford University Press .
- Journel , A. G. and Huijbregts , C. J. 1978 . Mining geostatistics , London : Academic Press .
- Kay , M. 1937 . “ Stratigraphy of the Trenton Group ” . In AAPG Bulletin 48, 233–302
- Malvić , T. 2003 . One-dimensional variogram and statistical analysis in reservoir units of the Bjelovar sag, Croatia . Nafta , 54 ( 7–8 ) : 267 – 274 .
- Malvić , T. 2005 . Rezultati geostatistikog kartiranja poroznosti polja zapadnog dijela Dravske depresije (Molve, Kalinovac, Stari Gradac) [Results of geostatistical mapping of porosity in the western Drava Depression (Molve, Kalinovac, Stari Gradac)-in Croatian and English] . Nafta , 56 ( 12 ) : 465 – 476 .
- Malvić , T. and Bastaić , B. 2008 . Reducing variogram uncertainties using the ‘jack-knifing’ method, a case study of the Stari Gradac - Barcs-Nyugat field . Bulletin of Hungarian Geological Society , 138 ( 2 ) : 165 – 174 .
- Malvić , T. and Djureković , M. 2003 . Application of methods: Inverse distance weighting, ordinary kriging and collocated cokriging in porosity evaluation, and comparison of results on the Benicanci and Stari Gradac fields in Croatia . Nafta , 54 ( 9 ) : 331 – 340 .
- Malvić , T. and Đureković , M. 2004 . Regional geological settings and hydrocarbon potential of Bjelovar sag (subdepression), R. Croatia . Nafta , 55 ( 7–8 ) : 273 – 288 .
- ALVITBulletin of Hung, 1.
- Malvić , T. and Prskalo , S. 2008 . Significance of the amplitude attribute in porosity prediction, Drava Depression Case Study . Nafta , 59 ( 1 ) : 39 – 44 .
- Malvić , T. and Velić , J. 2011 . “ Neogene Tectonics in Croatian Part of the Pannonian Basin and Reflectance in Hydrocarbon Accumulations ” . In New Frontiers in Tectonic Research: At the Midst of Plate Convergence Edited by: Schattner , U. 215 – 238 . InTech, Rijeka, 352 pp
- Mathéron , G. 1965 . Les Variables Régionalisées et leur Estimation , Paris : Masson & Cie .
- Šimon , J. 1980 . Prilog stratigrafiji u taložnom sustavu pješčanih rezervoara Sava-grupe naslaga mlađeg tercijara u Panonskom bazenu sjeverne Hrvatske , [A contribution to stratigraphy of the sedimentary system of sandstone reservoirs of the Sava Group in the northern Croatian part of the Pannonian Basin-in Croatian]. PhD thesis, University of Zagreb, Faculty of Mining, Geology and Petroleum Engineering
- Velić, J. (2007). Geologija ležišta nafte i plina [Geology of oil and gas reservoirs-in Croatian]. University of Zagreb, Faculty of Mining, Geology and Petroleum Engineering.
- Velić , J. , Weisser , M. , Saftić , B. , Vrbanac , B. and Ivković , Ž. 2002 . Petroleum-geological characteristics and exploration level of the three Neogene depositional megacycles in the Croatian part of the Pannonian Basin. Nafta . 53 ( 6–7 ) : 239 – 249 .
- Velić , J. , Malvić , T. and Cvetković , M. 2011 . Palinspastic reconstruction of synsedimentary tectonics of Neogene and Quaternary sediment sin the Kloštar Field (Sava Depression, Pannonian Basin, Croatia) . Zeitschrift der Deutschen Gesellschaft fur Geowisswnschafen , 162 ( 2 ) : 193 – 203 .