Abstract
Maps depicting the spatially explicit fire history of an area, including variables such as fire frequency and fire return interval, are important tools promoting the understanding of processes associated with wildfires (fire ignition and spread), the assessment of the impacts of wildland fires on landscape dynamics, and decisions on appropriate management practices. Remote sensing is a cost- and time-effective alternative to automatically assess a vast amount of spatial information and produce various thematic maps. The aim of this study was to reconstruct the recent fire history of Attica region (Greece), in a spatially explicit mode by means of remote sensing techniques using a series of Landsat images acquired from 1984 to 2011. The results show that the fire scar perimeters were captured with high accuracy. Regression modelling shows that the differences between the area burned estimated from satellite data and that recorded by the forest service can be explained (86.3% of the variance) by the number of satellite images used (standardized coefficient 0.752) followed by the date of the first image (standardized coefficient 0.705). The use of satellite data as the basic source of information alongside automated classification methods should be promoted for the creation of fire history maps. The latter is further supported when considering the long history of data capture from Landsat satellites, which provide a huge, global historical archive of repeat images of the Earth's surface.
1. Introduction
The diverse consequences of fire activity on the environment, economy, society and the atmosphere, require the development of information systems for management and monitoring. The detailed description of the fire regime (resulting from the reconstruction of fire history in terms of fire (re)occurrence, size and severity) of an area or ecosystem is critical to understanding the processes associated with wildfires and assess their effects on landscape dynamics.
Spatially explicit information for variables such as fire occurrence, frequency, return interval, or interval until last fire, are important to provide consistent fire statistics and assist in environmental planning and management. This information can be summarized for the development of thematic layers containing information on recently burned areas, including patchiness of burn severity (CitationNioti, Dimopoulos, & Koutsias, 2011), on areas that have suffered from intense and frequent fires (CitationSherriff & Veblen, 2007), or on unburned areas with high fuel accumulation (CitationMorgan, Hardy, Swetnam, Rollins, & Long, 2001). Long-term fire history also provides the necessary information to reconstruct the fire regime of an area/ecosystem, allowing the comparison of recent fire characteristics with the expected natural fire regime; therefore, management measures can be obtained accordingly (CitationHardy, 2005; CitationMorgan et al., 2001).
Remote sensing is the most cost- and time-efficient method to obtain spatially explicit data of fire perimeters. The application of space-borne sensor data for forest fire mapping and inventory has a long history in remote sensing studies. Over the last three decades, much progress has also been made in burned area mapping at medium to high spatial and temporal resolutions by employing remote sensing methods (CitationHardtke, Del Valle, & Sione, 2011). Among these methods, automatic and semi-automatic techniques have been developed, which minimize human intervention and allow the easy application of the algorithms to a series of satellite images. This is a critical issue in cases where many satellite images need to be analysed, such as for the reconstruction of recent fire history, where hundreds of images might be used in the processing chain. However, spatially explicit observations of fire occurrence allowing for a detailed description of fire incidence and the reconstruction of an area's fire history are often missing, thus limiting understanding of the reasons of fire ignition and spread (CitationKoutsias & Karteris, 1998) and post-fire vegetation regeneration (CitationMitchell & Yuan, 2010).
Successful delineation of fire scar perimeters, among other parameters, depends on the imagery availability, expressed as acquisition date (CitationBowman, Zhang, Walsh, & Williams, 2003). Similarly, date of image acquisition affects the success of the assessment of burn severity (CitationHudak et al., 2007). Another parameter that contributes to the underestimation of burned scars is the presence of fires after the image acquisition (CitationSedano, Kempeneers, Strobl, McInerney, & San Miguel, 2012), revealing the importance of the end-date acquisition. The relative importance of each of the above-mentioned parameters in fire scar mapping has not yet been extensively evaluated.
The main purpose of this study is to present recent fire history reconstruction using a series of United States Geological Survey (USGS) Landsat archived data from 1984 to 2011 in Attica region, Greece. USGS Landsat scenes, processed to Standard Terrain Correction (Level 1T) where possible, are available to the public at no charge from the USGS Earth Resources Observation and Science (EROS) Center (http://glovis.usgs.gov/). These historical archives cover large spatial and temporal extents at continental scale and provide a unique opportunity to overcome cost constraints when reconstructing fire history at local to regional scales. Additionally, limited Landsat Thematic Mapper (TM) and Enhanced Thematic Mapper Plus (ETM+) images for selected years were acquired from other sources, for instance, images provided within the FUME project, from the European Space Agency (ESA) cat-1 images, and others. Finally, the effect of acquisition date of LANDSAT images in reconstructing recent fire history is evaluated.
2. Study area
Attica region (Greece), which refers to the geographical district around the city of Athens with a population of about three million inhabitants (2011 census data), fits within the limits of a Mediterranean climate with average annual precipitation ranging from 300 to 700 mm (CitationKazanis, Gimeno, Pausas, Vallejo, & Arianoutsou, 2007). The dominant climatic feature of Attica is the alternation between prolonged warm and dry summers and mild, wet winters (CitationNahal, 1981); conditions that favour fire ignition during the summer months. Numerous fire events affect the study area every year, partially due to the intense human pressure for urbanization of the mountains surrounding Athens. According to CitationBohn et al. (2000), the dominant potential natural vegetation formations in Attica prefecture, include (with descending order in terms of area covered): (a) East Mediterranean wild olive-locust tree forests (Ceratonia siliqua, Olea europaea subsp. oleaster) and kermes oak-mastic tree scrub (Pistacia lentiscus, Quercus coccifera) partly in combination with Pinus brutia forests, with Cyclamen graecum and Teucrium divaricatum), (b) Hellenic-Aegean meso-Mediterranean holm oak (Quercus Ilex) and kermes oak (Q. coccifera) forests with Arbutus adrachne, Asplenium onopteris and Cyclamen hederifolium, partly in combination with Pinus brutia forests, (c) southern Greek Abies cephalonica forests with Anemone blanda and Geocarycum parnassicum, and (d) East Mediterranean plane tree alluvial forests (Platanus orientalis) with Juglans regia, partly with Alnus glutinosa, and partly in combination with oleander alluvial scrub (Nerium oleander). However, intense urbanization and long-term rural activities have created a patchwork landscape of various land cover types that include extensive urban-rural interface areas.
3. Methods
The development of maps of the recent fire history of Attica as presented in this paper, is structured in two distinct phases: (1) the accurate delineation of the fire perimeter distinguishing the unburned patches using satellite imagery and (ii) the application of suitable GIS supported analyses to develop thematic layers that optimally summarized the spatial and temporal information of fire occurrence.
To delineate the fire scar perimeters, we applied two approaches to the available series of Landsat images found at the USGS for the periods 1984–1991 and 1999–2011 from four different scenes (path/rows) covering Attica. The first approach is a rule-based semi-automatic algorithm that makes use of uni-temporal and multi-temporal rules based on distinct spectral patterns of burned areas (CitationKoutsias, Pleniou, Mallinis, Nioti, & Sifakis, under review. The second approach uses the Automatic Burned Area Mapping Software (CitationBastarrika, Chuvieco, & Martin, 2011), a tool that applies a two-phased algorithm to generate fire scar perimeters. Additionally, we used the familiar maximum likelihood classifier on selected Landsat TM and ETM+ images provided by the FUME project, ESA cat-1 images, and others (). CitationMallinis and Koutsias (2012), when comparing 10 classification approaches using Landsat TM imagery for three Mediterranean test sites, found non-statistically significant differences in the accuracy of burned area maps. The variance in the accuracy results imposed by the different methods applied was less than that imposed by factors differentiated locally in the three test sites.
Table 2. USGS Landsat images used to reconstruct recent fire history of selected years (number and dates of images used) and the duration in days between the first and last image used for modelling the errors.
To assess the accuracy of the final products (fire scar perimeters) we used 975 sampling points collected for one case study (a fire on Mt. Parnitha in 2007) from a high-resolution post-fire IKONOS image, together with aerial photographs supported by a field survey. Confusion matrices were generated to summarize the accuracy statistics using cross-tabulation of the reference data against the burned area map.
For selected years where there were many satellite images available, we calculated the number of fires and area burned as estimated from USGS Landsat images and compared them with available statistics from the Hellenic Forest Service (HFS) (). We developed regression models of the differences between the estimated and observed fire statistics (number of fires and area burned) from the HFS against the first and last date of the Landsat images used within each year (Julian date), the number of images and the duration (last–first Julian date), in order to investigate the relative importance of the timing of image acquisition on capturing the fires.
Table 3. Number of fires and area burned as estimated from USGS Landsat images and as recorded from the Hellenic Forest Service together with their differences (error).
After the delineation of the fire scars for each year we proceeded with a further spatial analysis in a geographical information system (GIS) environment supported by ArcGIS 9.3, to estimate and depict various fire history components described in detail in the ‘Results and discussion section’.
4. Results and discussion
4.1. Accuracy assessment from Parnitha fire 2007
The evaluation procedure of the 2007 Mt. Parnitha fire resulted in 95.48% overall accuracy of the burned areas, while omission and commission errors were 3.97% and 7.40%, respectively (). The parameters used to apply the two approaches were set to ensure that most of the burned surfaces were captured. Therefore, both methods slightly overestimate the burned surfaces by minimizing the omission errors at the expense of commission errors. Both methods require some final manual editing to retain only the perimeters of fire scars and eliminate various errors.
Table 1. Accuracy report of the classification results for the Mt. Parnitha study site.
4.2. Modelling the errors
The results from the regression modelling using the differences in area burned (, ) and the number of fires (, ) as the dependent variable, show that only the differences in area burned can be explained by the independent variables ‘first-’ and ‘last-date’ of the Landsat images used within each year (Julian date) and the number of satellite images used. In this case the model explains 86.3% of the variance of the dependent variable. The most important explanatory variable is the number of satellite images used (standardized coefficient 0.752) followed by the date of the first image (standardized coefficient 0.705), while the date of the last image is not statistically significant. These results suggest that success in fire reconstruction increases with an increase in the number of available images that are distributed towards the end of the fire season. In Attica, 39% of the burned area for the period 1983–2005 is recorded during August (CitationTsagari, Karetsos, & Proutsos, 2011a), while in Greece, 65% of fires occur during July–August (CitationTsagari, Karetsos, & Proutsos, 2011b). A proportion, therefore, of early-season fires is captured from available images acquired at mid- to end-season. Moreover, an increase in the number of available images significantly increases the ability to capture fires because the chances of getting full, cloud-free coverage of the area of interest increase (CitationSedano et al., 2012) and the large number of acquisitions assists in reducing the between-acquisition period, thus allowing the capture of signals of relatively small fires that otherwise would have faded due to vegetation recovery, particularly in areas reflecting increased summer-precipitation totals (CitationSedano et al., 2012).
Table 4. Regression models of the differences in area burned against the first and last date of the Landsat images used within each year (Julian date), the number of images and the duration (last – first Julian date).
Table 5. Regression models of the differences in number of fires against the first and last date of the Landsat images used within each year (Julian date), the number of images and the duration (last – first Julian date).
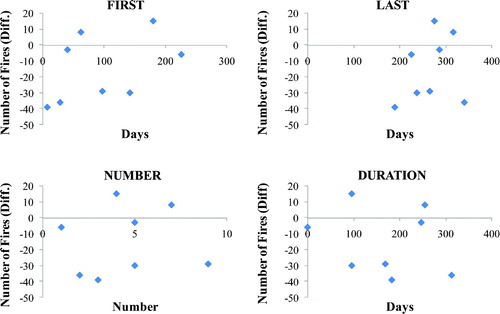
Similar arguments also apply for the failure of ‘date of the last image’ to enter the models as a significant explanatory variable. Only a small percentage of the area burned is recorded at late-season, while at the same time, signs of early-season fires may have faded. The number of fires did not show significant regressions with any οf the examined variables because medium-resolution images fail to capture a considerable number of small fires. It should be pointed out however, that these results are preliminary and cannot be extrapolated outside the range of the values of the dependent and independent variables used.
4.3. Fire occurrence components
4.3.1. Fire scar maps
Within the fire scar perimeter, a mosaic of patches of unburned areas, or areas with low fire intensity can be distinguished. This is a common pattern in most wildfires (CitationRyan, 2002). These patches are important in terms of ecosystem functioning and could, directly or indirectly, influence early vegetation (CitationLentile, Smith, & Shepperd, 2005) and faunal (CitationBradstock, Bedward, Gill, & Cohn, 2005) post-fire dynamics, providing refuge for plant and animal species that favour their regeneration and dispersal (CitationRyan, 2002). Therefore, the existence of detailed fire-scar maps that include patterns of burned and unburned patches provides the critical data needed to study landscape-wildfire dynamics, understand and predict the recovery processes of burned ecosystems, and detail post-fire ecosystem management.
4.3.2. Fire frequency and fire return interval
The map shows that in Attica, a mosaic of various fire frequencies is observed with values ranging from 1 to 6. Fire frequency (defined as the number of fires per unit time in a specified area) (CitationMcPherson, Wade, & Phillips, 1990), or alternatively, fire return interval (defined as the time until a given location reburns) (CitationPeng & Schoenberg, 2007), are variables that all play a significant role in vegetation diversity and landscape heterogeneity. Fire frequency could, conditionally, specify the dominant resprouter species in a plant community (CitationEnright, Fontaine, Westcott, Lade, & Miller, 2011; CitationKruger, Midgley, & Cowling, 1997).
The needle-leaved evergreen Mediterranean pines (Pinus halepensis subsp. halepensis and P. halepensis subsp. brutia in Greece) for example, are obligate seeders, i.e., their regeneration relies exclusively on seeds and more specifically to their canopy seed bank. Under certain conditions, short fire return intervals could impede pine (or other seeder) regeneration and induce changes in composition and relative abundance of species with different life history traits (CitationLloret, Pausas, & Vila, 2003; CitationMoreira et al., 2011). Therefore, maps of fire frequency assist managers to decide on proper restoration practices and vegetation enrichment of ecosystems subjected to high fire frequencies which are predicted to have a significant loss in landscape heterogeneity, and to predict the long-term species composition of fire-prone ecosystems.
4.3.3. Fire regimes
The interaction of fire with vegetation types and human land use, at both regional and global scales, defines the typical fire regimes which integrate various fire characteristics (most commonly related with fire intensity and frequency) (CitationAgee, 1996; CitationMorgan et al., 2001). To understand fire activity along with its trends, further development of fire regime mapping is necessary. Long-term series of medium-resolution data together with the inclusion of information concerning fire intensity and severity allow the progression from fire history reconstruction, to the spatially explicit description of the fire regime of an area at landscape level.
However, it should be noted that gaps in data availability may hamper fire history reconstruction. For example, the low number of LANDSAT images used from 1992 to 1998 restricted the delineation and capture of a significant number of fires. This parameter should be taken into consideration in cases where these outputs are used for ecosystem management or other purposes.
5. Conclusions
Remote sensing provides a synoptic view of a large part of the Earth's surface and allows repeated measurements of the same area on a regular basis. Nowadays, it is possible to accurately capture spatial (such as fire perimeter and area) and temporal data (year and season-of-burn data) of fire occurrence (CitationWittkuhn & Hamilton, 2010).
These characteristics promote the use of satellite data as the basic source of information to create maps of fire scars at multiple scales. Additionally, the long history of data capture from Landsat satellites, which commenced with the launch of Landsat 1 in 1972, provides a large historical archive of repetitive images of the Earth's surface at global scale. The steps presented in this paper lead to the development of recent fire history maps taking advantage of this archive of medium spatial resolution imagery and making use of semi-automated image processing techniques. This is an ideal time- and cost-effective alternative that does not require expertise, given that regional standardizations for running the presented software/tools are available and the imagery are suitably processed and corrected. That is of great importance for stakeholders for future planning and management of fire-prone areas as the maps are based on actual information of various fire-regime descriptors, each of which affects a variety of ecosystem functions and properties in a distinct way, as briefly described in the respective sections of this paper. Monitoring and developing maps of fire history, therefore, is essential from an ecological, social and economic perspective.
Software
The Automatic Burned Area Mapping Software (ABAMS), developed by Dr. Aitor Bastarrika Izagirre, was used to map burnt extent. Esri ArcGIS 9.3 was used to process all spatial data needed to convert the single fire scar maps to fire occurrence components and to create the map showing the recent fire history in Attica, Greece.
Figure 1. Scatter plots between differences in area burned (estimated from USGS Landsat images – recorded from the Hellenic Forest Service) and independent variables used to model the errors (number of images, date of first and last image, duration in days between first and last image).
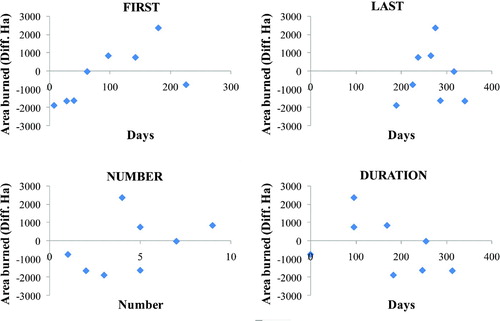
Figure 2. Scatter plots between differences in number of fires (estimated from USGS Landsat images – recorded from the Hellenic Forest Service) and independent variables used to model the errors (number of images, date of first and last image, duration in days between first and last image).
tjom_a_743866_sup_29763516.pdf
Download PDF (5.3 MB)Acknowledgements
The research leading to these results has received funding from the European Union's Seventh Framework Programme (FP7/2007–2013) under grant agreement nº 243888 (FUME project). Landsat data were freely available from the US Geological Survey (http://www.usgs.gov). The European Space Agency (ESA) (http://www.esa.int) provided the Landsat Cat-1 images within project no. 6832 entitled ‘Spectral properties and mapping of burnt surfaces at sub-pixel level using multi-source satellite data’. We are grateful to Dr. Aitor Bastarrika Izagirre for the distribution of ABAMS vers. 6.0 software. The three anonymous reviewers are gratefully acknowledged for their helpful comments on an earlier version of the manuscript that have considerably improved the paper.
Related Research Data
References
- Agee , J. K. 1996 . Fire ecology of Pacific Northwest forests , Washington , DC : Island Press .
- Bastarrika , A. , Chuvieco , E. and Martin , M. P. 2011 . Mapping burned areas from Landsat TM/ETM plus data with a two-phase algorithm: Balancing omission and commission errors . Remote Sensing of Environment , 115 : 1003 – 1012 . doi: 10.1016/j.rse.2010.12.005
- Bohn , U. , Gollub , G. , Hettwer , C. , Zupancic , M. , Puncer , I. and Seliškar , A. 2000 . Karte der natürlichen Vegetation Europas: Massstab 1: 2 500 000 (Map of the natural vegetation of Europe: scale 1: 2 500 000) , Münster-Hiltrup : Bundesamt für Naturschutz .
- Bowman , D. M. J. S. , Zhang , Y. , Walsh , A. and Williams , R. J. 2003 . Experimental comparison of four remote sensing techniques to map tropical savanna fire-scars using Landsat-TM imagery . International Journal of Wildland Fire , 12 : 341 – 348 .
- Bradstock , R. A. , Bedward , M. , Gill , A. M. and Cohn , J. S. 2005 . Which mosaic? A landscape ecological approach for evaluating interactions between fire regimes, habitat and animals . Wildlife Research , 32 : 409 – 423 . doi: 10.1071/Wr02114
- Enright , N. J. , Fontaine , J. B. , Westcott , V. C. , Lade , J. C. and Miller , B. P. 2011 . Fire interval effects on persistence of resprouter species in Mediterranean-type shrublands . Plant Ecology , 212 : 2071 – 2083 . doi: 10.1007/s11258-011-9970-7
- Hardtke , L. A. , Del Valle , H. F. and Sione , W. 2011 . Spatial distribution of wildfire risk in the Monte biome (Patagonia, Argentina) . Journal of Maps , 7 : 588 – 599 . doi: 10.4113/jom.2011.1184
- Hardy , C. C. 2005 . Wildland fire hazard and risk: Problems, definitions, and context . Forest Ecology and Management , 211 : 73 – 82 . doi: 10.1016/j.foreco.2005.01.029
- Hudak , A. T. , Morgan , P. , Bobbitt , M. J. , Smith , A. M. S. , Lewis , S. A. , Lentile , L. B. and … McKinley , R. A. 2007 . The relationship of multispectral satellite imagery to immediate fire effects . Fire Ecology , 3 : 64 – 90 . doi: 10.4996/fireecology.0301064
- Kazanis , D. , Gimeno , T. , Pausas , J. G. , Vallejo , R. and Arianoutsou , M. 2007 . Characterization of fire vulnerable Pinus halepensis ecosystems in Spain and Greece . Options Méditerranéennes , 75 : 131 – 142 .
- Koutsias , N. and Karteris , M. 1998 . Logistic regression modelling of multitemporal Thematic Mapper data for burned area mapping . International Journal of Remote Sensing , 19 : 3499 – 3514 . doi: 10.1080/014311698213777
- Koutsias , N. , Pleniou , M. , Mallinis , G. , Nioti , F. and Sifakis , N. I. under review . A rule-based semi-automatic method to map burned areas: Exploring the USGS historical Landsat archives to reconstruct recent fire history .
- Kruger , L. M. , Midgley , J. J. and Cowling , R. M. 1997 . Resprouters vs reseeders in South African forest trees: A model based on forest canopy height . Functional Ecology , 11 : 101 – 105 . doi: 10.1046/j.1365-2435.1997.00064.x
- Lentile , L. B. , Smith , F. W. and Shepperd , W. D. 2005 . Patch structure, fire-scar formation, and tree regeneration in a large mixed-severity fire in the South Dakota Black Hills, USA . Canadian Journal of Forest Research-Revue Canadienne De Recherche Forestiere , 35 : 2875 – 2885 . doi: 10.1139/X05-205
- Lloret , F. , Pausas , J. G. and Vila , M. 2003 . Responses of Mediterranean Plant Species to different fire frequencies in Garraf Natural Park (Catalonia, Spain): Field observations and modelling predictions . Plant Ecology , 167 : 223 – 235 . doi: 10.1023/A:1023911031155
- Mallinis , G. and Koutsias , N. 2012 . Comparing ten classification methods for burned area mapping in a Mediterranean environment using Landsat TM satellite data . International Journal of Remote Sensing , 33 : 4408 – 4433 .
- McPherson , G. , Wade , E. and Phillips , C. B. 1990 . Glossary of wildland fire management terms , Bethesda , MD : Society of American Foresters .
- Mitchell , M. and Yuan , F. 2010 . Assessing Forest Fire and Vegetation Recovery in the Black Hills, South Dakota . Giscience & Remote Sensing , 47 : 276 – 299 . doi: 10.2747/1548-1603.47.2.276
- Moreira , F. , Viedma , O. , Arianoutsou , M. , Curt , T. , Koutsias , N. , Rigolot , E. and … Bilgili , E. 2011 . Landscape - wildfire interactions in southern Europe: Implications for landscape management . Journal of Environmental Management , 92 : 2389 – 2402 . doi: 10.1016/j.jenvman.2011.06.028
- Morgan , P. , Hardy , C. C. , Swetnam , T. W. , Rollins , M. G. and Long , D. G. 2001 . Mapping fire regimes across time and space: Understanding coarse and fine-scale fire patterns . International Journal of Wildland Fire , 10 : 329 – 342 . doi: 10.1071/WF01032
- Nahal , I. 1981 . The Mediterranean climate from a biological viewpoint , Amsterdam : Elsevier .
- Nioti , F. , Dimopoulos , P. and Koutsias , N. 2011 . Correcting the fire scar perimeter of a 1983 wildfire using USGS archived Landsat satellite data . GIScience & Remote Sensing , 48 : 600 – 613 .
- Peng , R. D. and Schoenberg , F. P. 2007 . Estimation of the Fire Interval Distribution for Los Angeles County, California , Los Angeles : University of California .
- Ryan , K. C. 2002 . Dynamic interactions between forest structure and fire behavior in boreal ecosystems . Silva Fennica , 36 : 13 – 39 .
- Sedano , F. , Kempeneers , P. , Strobl , P. , McInerney , D. and San Miguel , J. 2012 . Increasing Spatial Detail of Burned Scar Maps Using IRSβ-AWiFS Data for Mediterranean Europe . Remote Sensing , 4 : 726 – 744 . doi: 10.3390/rs4030726
- Sherriff , R. L. and Veblen , T. T. 2007 . A spatially-explicit reconstruction of historical fire occurrence in the ponderosa pine zone of the colorado front range . Ecosystems , 10 : 311 – 323 . doi: 10.1007/s10021-007-9022-2
- Tsagari , K. , Karetsos , G. and Proutsos , N. 2011a . Forest fires in central Greece, 1983-2005 , Athens : WWF hellas, NAGREF-IMFE & TFP .
- Tsagari , K. , Karetsos , G. and Proutsos , N. 2011b . Forest fires in Greece, 1983-2008 , Athens : WWF hellas, NAGREF-IMFE & TFP .
- Wittkuhn , R. S. and Hamilton , T. 2010 . Using fire history data to map temporal sequences of fire return intervals and seasons . Fire Ecology , 6 : 97 – 114 . doi: 10.4996/fireecology.0602097