Abstract
Soil information and soil maps have been compiled and are available for the entire United Arab Emirates (UAE), however, no national soil map has yet been published. Soil maps of Abu Dhabi Emirate (84% of the UAE), and the Northern Emirates (11%) were published in 2009 and 2012, respectively while a soil map of Dubai Emirate (5%) was published in 2005, but with different standards and procedures. The aim of the present study is to unify the three regional soil maps into a national soil map for the entire UAE. Because the Dubai soil map is different from the other two maps, the original boundaries and soil classifications had to be modified. Digital soil mapping techniques, including use of the Shuttle Radar Topography Mission (SRTM) digital elevation model, were applied to modify, integrate, and correlate the soil map of Dubai Emirate. SRTM was used to guide line placement of the Dubai map units' boundaries. It was especially helpful for the Torripsamments great group, which was separated into three classes based on relief. ArcGIS was used to compile and manage geographic information, and the USDA Soil Taxonomy was used to classify soils. A generalized soil map for the UAE at a scale of 1:700,000 was produced. The map consists of 15 map units named by the great groups that dominate each unit. The overall extent and percentage of each great group within each emirate is calculated and presented. The map provides a general overview of the distribution of soils making up the UAE.
1. Introduction
Soil information and soil maps provide a foundation for potential environmental uses and problems that may arise, and are therefore considered a key for policy and decision making, especially in arid regions facing severe water scarcity. Digital Soil Mapping (DSM) began in the 1970s (CitationWebster & Burrough, 1972) and accelerated significantly in the 1980s due to advances in information technologies (CitationSanchez et al., 2009). DSM is a spatial soil information system created by numerical models that account for the spatial and temporal variations of soil properties based on soil and environmental related information (CitationLagacherie, McBratney, & Voltz, 2006). It has become an essential component of the soil assessment framework which supports soil-related decisions and policy-making (CitationLagacherie, 2008). The digital soil mapping techniquesare perhaps the next great advancement in delivering and managing soil survey information (CitationAhrens, 2008; CitationHartemink, McBratney, & Mendonça-Santos, 2008). These mapping and modeling techniques have flourished over the last two decades in order to address soil data and information needs (CitationBoettinger, Howell, Moore, Hartemink, & Kienast-Brown, 2010; CitationGrunwald, 2006; CitationGrunwald, Thompson, & Boettinger, 2011; CitationHartemink et al., 2008; CitationLagacherie et al., 2006) and have the potential to overcome some of the limitations imposed by costly traditional and labor intensive soil surveys. This has led to the development of sophisticated multi-variate models relating soil properties to digital environmental data (CitationMcBratney, Odeh, Bishop, Dunbar, & Shatar, 2000; CitationMcBratney, Mendonca Santos, & Minasny, 2003; CitationMcKenzie & Austin, 1993; CitationMcKenzie & Ryan, 1999; CitationRyan et al., 2000; CitationSkidmore, Varekamp, Wilson, Knowles, & Delaney, 1997).
While DSM approaches are becoming available to provide better soil data for future surveys, it is often necessary to deal with legacy soil data from traditional soil surveys (CitationBui & Moran, 2001). Legacy soil data represent, in many countries, a huge reservoir of soil information that can serve as input or validation sets to digital soil mapping procedures (CitationLagacherie, 2008). Soil scientists recognize that the conceptual (or mental) models developed by soil surveyors in the past (and represented in map legends, map memoirs, and map boundaries) can be highly informative (CitationMinasny, McBratney, & Lark, 2008). Traditional soil surveys have always struggled with the collection of data; the amount of soil data and information required to justify the mapping product, how to interpolate data to similar areas, and how to incorporate older data, are all challenges that need further exploration (CitationAhrens, 2008; CitationHartemink et al., 2008).
DSM techniques include remote-sensing, computer models, statistics and modeling, spatial information, global positioning systems, measurement systems (such as infrared spectroscopy), and more recently, online access to information (CitationSanchez et al., 2009). Remotely sensed data as well as geo-statistical models are the basic tools of DSM, used to speed-up and refine soil mapping. Maps generated using DSM may be adequate for extrapolating soil information to areas where no comprehensive soil map is available, but where reference soil maps representing soil diversity and distribution do exist (CitationAbdel-Kader, 2011). Work by CitationVenkatratnam (1980), CitationKudrat, Saha, and Tiwari, (1990) and CitationKarale (1992) demonstrated the potential use of remote sensing and digital image-processing techniques for soil survey (CitationManchanda, Kudrat, & Tiwari, 2002).
In the United Arab Emirates (UAE), soil information and soil maps have recently been completed and become available for the entire country. The soil map of Abu Dhabi Emirate, which covers 84% of the UAE, was published in 2009 (CitationEAD, 2009), and a map for the Northern Emirates (11% of the UAE) was published in 2012 (CitationEAD, 2012). A soil map of Dubai Emirate (5% of the UAE) was published in 2005 (CitationDubai Municipality, 2005) but used different standards and procedures. The objective of the present study was to produce a unified national soil map for the entire UAE based on the available legacy soil maps and using digital soil mapping techniques to further classify the incompatible map units of the Dubai Emirate soil map.
2. Materials and methods
2.1. The study area
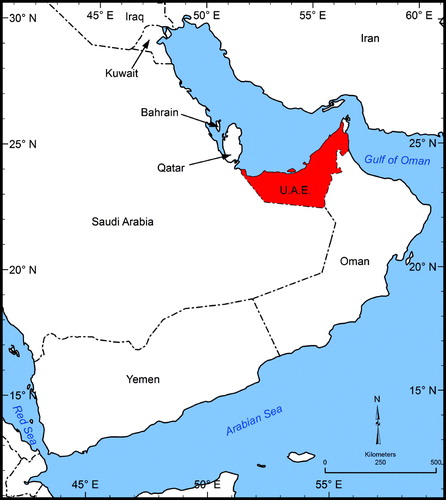
The United Arab Emirates lies between 22°50' and 26° N latitude and 51° and 56°25' E longitude at the southeastern tip of the Arabian Peninsula. The UAE is a federation of seven emirates adjacent to the Arabian Gulf and borders Oman and Saudi Arabia (). The total area of the UAE is about 82,880 km2, with Abu Dhabi the largest emirate occupying 84% (77,000 km2). Other emirates are Dubai, Sharjah, Ajman, Umm Al Quwain, Ras Al Khaimah, and Fujairah, Umm Al Quwain, and Ajman Emirate. The climate of the UAE is arid with harsh and dry summers when temperatures regularly exceed 45oC and mild-to-warm winters with very little, sporadic rainfall (CitationAlsharhan & Kendall, 2002; CitationRaafat, 2006). In Abu Dhabi Emirate, the major ecosystems consist of the coastal and interdunal sabkha, numerous islands, mountainous areas, gravel plains, and the sand desert (CitationBoer, 1998). About 100-km inland, towering dunes rising to 200 meters (mega dunes) are common. These form part of the Empty Quarter or ‘Rub al-Khali,’ a vast desert which stretches beyond the UAE's southern border into Saudi Arabia (CitationUAE Yearbook, 2008). Mountains are largely absent, a notable exception being the impressive Jebel Hafit near Al Ain, an outlier of the Hajar mountain range (CitationBrown, 2008). In the Northern Emirates, the landscape ranges from small areas of level coastal plains and sabkha to undulating desert sand plain, extensive areas of linear and transverse dunes, an alluvial plain up to 15-km wide, and mountainous rocky outcrop along the Hajar Mountains, which reach a height of 2980 m at Jebel Akhdar.
Figure 1. Location of the United Arab Emirates.
2.2. Legacy soil data and soil maps
The UAE soil map was developed by joining, generalizing, and correlating the already available information in three legacy soil maps; the soil map of Dubai Emirate at a scale of 1:25,000 (CitationDubai Municipality, 2005), the soil map of Abu Dhabi Emirate at a scale of 1:100,000 (CitationEAD, 2009), and the soil map of the Northern Emirates at a scale of 1:50,000 (CitationEAD, 2012). Because the three soil maps were published at different times and with different standards and procedures, the original map boundaries and soil classifications had to be modified in order to integrate them into a single national soil map. We used the Shuttle Radar Topography Mission (SRTM) (CitationNASA, 2003) Digital Elevation Model (DEM) to classify the soil great group of Torripsamments on the Dubai soil map and make it compatible with the other two maps of Abu Dhabi and the Northern Emirates.
2.3. Up-scaling and generalizing soil maps at great group level
The scale of the three maps, Abu Dhabi, Northern Emirates, and Dubai, was unified, and map units were generalized at great group level before the joining process took place. Soil great groups are appropriate taxa to use for soil classification at a small scale, such as this national map. It must be understood however that the soil great group is a high level within the classification hierarchy of Soil Taxonomy (CitationUSDA-NRCS, 1999, Citation2010). As such, each great group contains a fairly wide range of soil properties such as texture, salinity, and soil depth. In addition, it is important to recognize that although the map units are named from the single soil great group class that is most extensive and dominant within the area covered by the unit, there are other kinds of soils included within each map unit in varying proportions.
2.4. Joining equivalent great groups and subdividing ‘Torripsamments’
Most great groups in the Dubai, Abu Dhabi, and Northern Emirates soil maps (Aquisalids, Calcigypsids, Haplocalcids, Haplogypsids, Haplosalids, Petrocalcids, Petrogypsids, and Torriorthents) were easily joined because they could be matched across the map boundaries. However joining was not possible for the non-matching Torripsamments great group, which is the dominant and most widely distributed in the UAE (75% of the UAE, 81% of Abu Dhabi alone). On the Abu Dhabi soil map, the Torripsamments great group was divided into four classes based on relief: low (<5 m), medium (5– < 9 m), high (9–< 30 m), and very high (>= 30 m), whereas in the Northern Emirates, it was divided into three classes: low (<5 m), medium (5–10 m), and high (>10 m). These subdivisions were simplyfied into three classes for both maps, low (<5 m), medium (5–10 m), and high (>10 m).
However, the situation was different with the soil map of Dubai, because the Torripsamments map unit was not divided into relief classes. Thus, the challenge was how to subdivide the Torripsamments map units into three equivalent classes to make them compatable with units on the other two maps. In the absence of relief data on the Dubai soil map, an interpretation of the SRTM DEM (CitationNASA, 2003) was used to divide the Torripsamments of the Dubai soil map into the three relief classes listed above; the procedure is described below. A validation process was applied to demonstrate that the relief classes derived were compatible with the relief classes of Abu Dhabi and Northern Emirates soil maps.
The basis of the elevation thresholds is that the low relief Torripsamments (<5 m) can be leveled and used for agriculture activities without difficulty and without high cost. Medium relief land (5–10 m) is more difficult to level and use and is consequently more expensive. High relief areas (>10 m) are almost impossible to level economically unless there are strong reasons for doing so.
2.5. Data processing
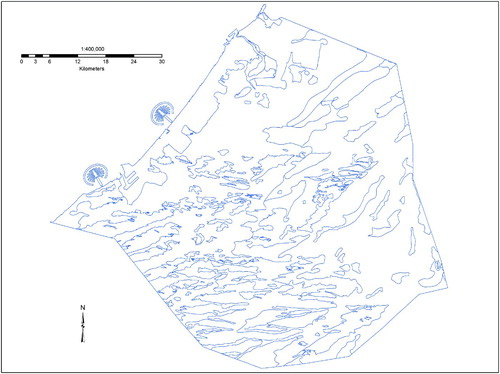
In order to create a seamless dataset, it was necessary to edgematch the three soil map layers. The maps had overlapping boundaries () which needed to be joined. In addition, the soil map of Dubai, published at a scale of 1:25,000, had small polygons, less than or equal to 25 ha (). These were either merged with the nearest larger polygon or grouped together to generate a new larger polygon ().
Figure 2. Overlapping boundaries between Abu Dhabi, Dubai, and Northern Emirates maps.
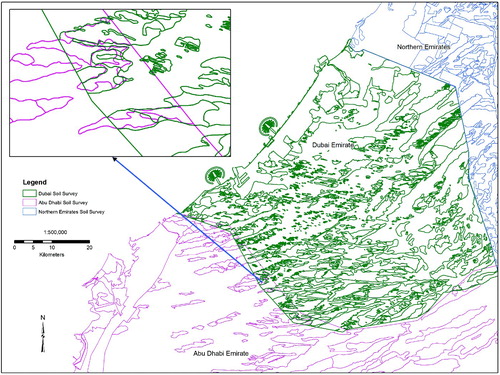
Figure 3. Dubai soil map before generalization, feature editing, and processing.
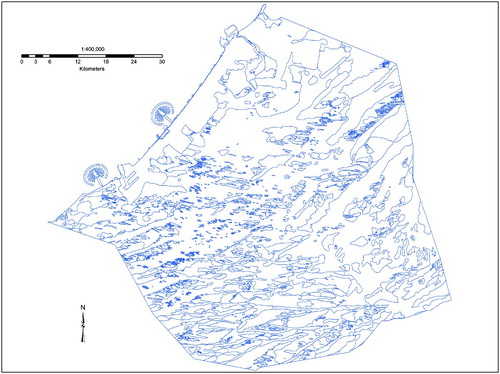
Figure 4. Dubai soil map after generalization, feature editing, and processing.
2.5.1. Geoprocessing, joining, and merging
The SRTM DEM was used to classify the relief of the Torripsamments soil map units on the Dubai soil map into three classes. The procedure used was as follows:
| • | The image was classified into three different relief classes: low (<5 m), medium (5-10 m), and high (>10 m). | ||||
| • | The relief map was intersected with the Torripsamments map units of Dubai soil map. The new classes were used for further processing and manual edge-joining to produce a soil map with Torripsamments divided into three classes (). | ||||
| • |
Figure 5. Dubai soil map with Torripsamments divided into 3 relief classes: low (<5 m), medium (5-10 m), and high (>10 m). 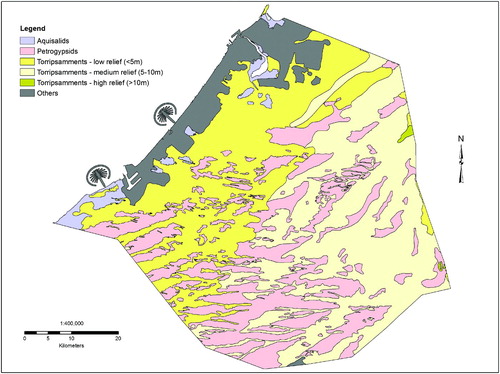 Great group boundaries of the three individual layers of Dubai (), Northern Emirates (), and Abu Dhabi () were dissolved and aggregated. | ||||
| • |
Figure 6. Soil map of the Northern Emirates (CitationEAD, 2012). 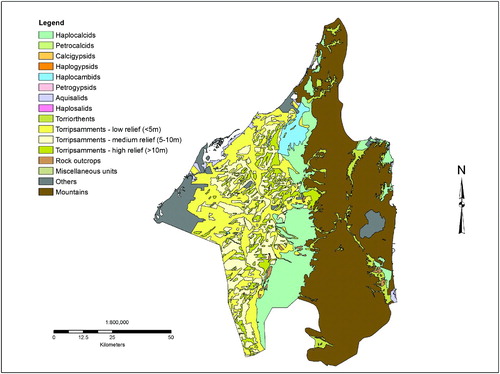
Figure 7. Soil map of Abu Dhabi Emirate (CitationEAD, 2009). 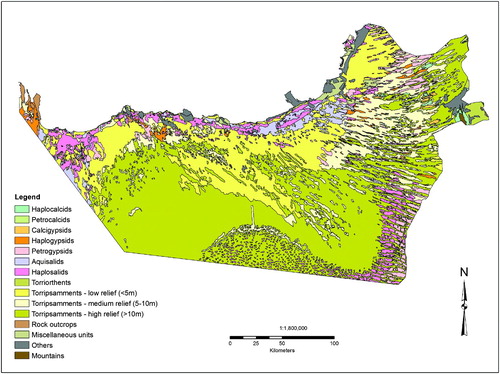 The three layers were merged into one seamless soil map as shown in . The red line shows the boundary between the three individual maps. | ||||
| • |
Figure 8. Joining the boundaries of the three soil maps to create one national soil map. 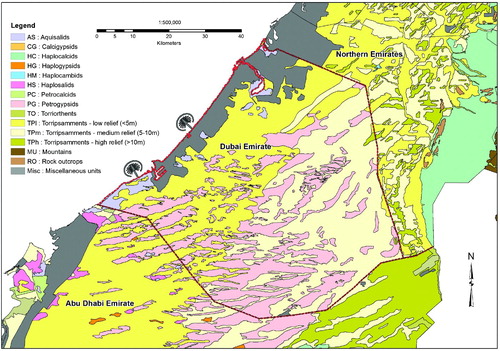 Joining and correlation of soil classes was performed manually. | ||||
3. Results and discussion
3.1. Validation and compatibility
The SRTM DEM has a relative vertical accuracy of ∼6 m while we separated relief into <5 m, 5–10 m and >10-m classes, and therefore errors are potentially high. We thus validated the process used to classify the Torripsamments great group of Dubai soil map into three classes to demonstrate that the relief classes derived from the SRTM DEM were compatible with the relief classes of the Abu Dhabi and Northern Emirates soil maps. For this purpose, a portion was chosen from the relief class map of each Emirate. These were then intersected with the Torripsamments classes of that particular soil map using ArcGIS. The compatibility results are presented in . The results indicate that, in low areas (<5 m), the compatibility is 87.6% in Abu Dhabi Emirate and 73.9% in the Northern Emirates, on average 80.7%. In medium areas (5–10 m), the compatibility was 66.8% in Abu Dhabi and 94.2% in the Northern Emirates, on average 80.5%. In the high areas (>10 m), it was 57.5% in Abu Dhabi and 69.7% in the Northern Emirates, on average 63.6%. The overall compatibility was 70.6% in Abu Dhabi Emirate and 79.3% in the Northern Emirates, on average 74.9% for both emirates. This indicates that the process used to classify the Torripsamments of Dubai soil map is valid at the scale of the resulting map.
Table 1. Overall compatability percentage between relief map and Torripsamments (TTP) in soil maps of Abu Dhabi and Northern Emirates.
3.2. National soil map of the UAE
A generalized soil map of the entire United Arab Emirates was produced at a scale of 1:700,000. The map consists of 15 map units; twelve are named for the soil great group that dominants each unit and three consist of rock outcrop, mountains, and miscellaneous units. Additional phase terms depicting local relief (<5 m, 5–10 m, and >10 m) were used to further differentiate the Torripsamments. Statistical details of the extent and distribution of each soil great group within each of the seven emirates are presented in . The general soil map is intended to provide an overview of the kinds of soils making up the United Arab Emirates and their general location.
Table 2. Area (ha) and percentages of each great group in the UAE and within each Emirate.
3.3. Map unit (great groups) descriptions, and their distribution and extent
Two main soil orders occur in the arid conditions of the UAE (Aridisols and Entisols), six suborders (Salids, Gypsids, Calcids, Psamments, Orthents and Cambids), and eight great groups (Aquisalids, Calcigypsids, Haplocalcids, Haplogypsids, Haplosalids, Petrocalcids, Petrogypsids, Torriorthents, and Torripsamments) (CitationAbdelfattah & Shahid, 2007; CitationEAD, 2012; CitationShahid & Abdelfattah, 2008). The dominant soils at great group level are Torripsamments (75%), which make up three map units based on relief differences (low <5 m, medium 5–10 m, and high >10 m), followed by Haplosalids (5.4%), Petrogypsdis (3.8%), Aquisalids (3%), Haplocalcids (1.7%), Haplogypsids (1%), Torriorthents (0.9%), Haplocambids (0.3%), Calcigypsids (0.2%), and Petrocalcids (0.1%). The remainder of the map is made up of other units such as mountains (4.8%), rock outcrops (0.5%), and miscellaneous units (3.3%). Within each map unit other soils are included in varying proportions, but these have been omitted at the publication scale. A brief description of each of the map units and their extent and distribution is given below ().
3.3.1. Aquisalids (2.8%)
Aquisalids are strongly saline or very strongly saline, poorly drained soils in coastal and inland sabkha. These soils have a concentration of salts in the profile, and some also have a concentration of gypsum. Capillary rise and evaporation of water concentrates the salts near the surface. Despite the presence of ground water, the high salinity makes these soils physiologically dry, thus limiting vegetation to salt-tolerant species. Textures are mostly loamy or sandy. A few of these soils have bedrock within 50 cm. At subgroup level, Gypsic and Typic Aquisalids were recognized. This map unit covers 196,117 ha, or about 2.8% of the UAE. About 91% of the unit is in Abu Dhabi Emirate, 5% is in Dubai Emirate, and 2% is in Umm Al Quwain Emirate. The remaining 2% is in Fujairah (1%) and Sharjah Emirates (1%).
3.3.2. Calcigypsids (0.2%)
Calcigypsids have an accumulation of both calcium carbonate and gypsum in the upper part of the subsoil. Most of these soils are sandy throughout. These soils do not have a hardpan within 100 cm, but a few have bedrock within 50 cm. At subgroup level, only Typic Calcigypsids were recognized. This map unit covers 14,181 ha, or about 0.2% of the UAE, all in Abu Dhabi Emirate.
3.3.3. Haplocalcids (1.7%)
Haplocalcids have an accumulation of calcium carbonate within the upper part of the subsoil. Textures are sandy or loamy. These soils do not have a hardpan within 100 cm, but a few have bedrock within 50 cm. At subgroup level, Typic and Sodic Haplocalcids were recognized. This map unit covers 118,861 ha, or about 1.7% of the UAE. About 50% of the unit is in Sharjah Emirate, 20% is in Abu Dhabi Emirate, 18% is in Ras Al Khaimah Emirate, and 12% is in Fujairah Emirate.
3.3.4. Haplocambids (0.2%)
Haplocambids have a loamy subsoil horizon with structure and/or color in the form of a cambic horizon. They do not have a sufficient accumulation of calcium carbonate or gypsum to have either a calcic or gypsic subsoil horizon. Some of the Haplocambids have an accumulation of sodium in the subsoil. These soils do not have a hardpan within 100 cm. At subgroup level, Sodic and Typic Haplocambids were recognized. This map unit covers 13,803 ha, or about 0.3% of the UAE. About 98% of the unit is in Ras Al Khaimah Emirate, 1% is in Fujairah Emirate, and 1% is in Sharjah Emirate.
3.3.5. Haplogypsids (1%)
Haplogypsids have an accumulation of gypsum within the subsoil. Most have sandy textures, but a few are loamy. These soils do not have a hardpan within 100 cm, but a few have bedrock within 50 cm. Some of the Haplogypsids have salinity levels that may negatively impact the growth of some plants. At subgroup level, Leptic, Lithic, and Typic Haplogypsids were recognized. This map unit covers 71,518 ha, or about 1.0% of the UAE, all in Abu Dhabi Emirate.
3.3.6. Haplosalids (5.4%)
Haplosalids are strongly saline or very strongly saline soils on flats on deflation or sabkha plains. All of these soils have a concentration of salts in the profile, and some also have a concentration of gypsum. High salinity limits the vegetation to salt-tolerant species. Some of the Haplosalids have a hardpan within 100 cm that is cemented with gypsum. A few have bedrock within 50 cm. At subgroup level, Gypsic, Petrogypsic, and Typic Haplosalids were recognized. This map unit covers 381,692 ha, or about 5.4% of the UAE, all in Abu Dhabi Emirate.
3.3.7. Petrocalcids (0.1%)
Petrocalcids have a subsoil horizon within 100 cm that has accumulated so much calcium carbonate over time that it has become cemented, forming a calcium carbonate hardpan. Petrocalcids are mostly on level to gently sloping landscapes that have been stable for a very long time. Most of these soils are sandy. At subgroup level, only Typic Petrocalcids were recognized. This map unit covers 2196 ha, or less than 0.1% of the UAE, all in Abu Dhabi Emirate.
3.3.8. Petrogypsids (3.9%)
Petrogypsids have a subsoil horizon within 100 cm that has accumulated so much gypsum over time that it has become cemented, forming a gypsic hardpan. Most of the Petrogypsids are sandy, but a few are loamy. Some of the Petrogypsids have salinity levels that may negatively impact the growth of some plants. At subgroup level, Calcic and Typic Petrogypsids were recognized. This map unit covers 276,847 ha, or about 3.9% of the UAE. About 64% of the unit is in Abu Dhabi Emirate and 36% is in Dubai Emirate.
3.3.9. Torriorthents (0.9%)
Most of the Torriorthents have more than 35% by volume gravel throughout. They are on alluvial fans and plains adjacent to the mountains and also in wadis within mountain valleys. Other Torriorthents are further from the mountains on alluvial plains or in wadis. They have little or no gravel within the profile. They are mostly sandy, but contain one or more layers with loamy textures within 100 cm. A few of the Torriorthents have bedrock within 50 cm. At subgroup level, Lithic, Typic, and Oxyaquic Torriorthents were recognized. This map unit covers 62,127 ha, or about 0.9% of the UAE. About 55% of the unit is in Abu Dhabi Emirate, 21% is in Fujairah Emirate, 15% is in Ras Al Khaimah Emirate, 5% is in Sharjah Emirate, and 4% is in Ajman Emirate.
3.3.10. Torripsamments (75%)
The Torripsamments soil great group is dominated by eolian sands on dunes and sand sheets. A few of the soils are formed on alluvial sands with little or no gravel. Torripsamments are the most extensive soils in the UAE, covering 75%. They have sandy texture throughout. In some places where they are on sand sheets, they may be underlain below 100 cm by a cemented hardpan or by gravelly, very gravelly, or extremely gravelly layers. Some of the Torripsamments have salinity levels that may negatively impact the growth of some plants. A few of the Torripsamments have bedrock within 50 cm. The Torripsamments are separated into three phases reflecting landscape relief (height of the dunes). Collectively, the Torripsamments make up 5,261,812 ha or about 75% of the UAE (). At subgroup level, Typic and Lithic Torripsamments were recognized. The Torripsamments classes based on relief differences are as follows:
| • | Torripsamments – low relief (<5 m) make up 1,364,956 ha, or 19.5% of the UAE. About 83% is in Abu Dhabi Emirate, 8% is in Dubai Emirate, 5% is in Sharjah Emirate, 2% is in Umm Al Quwain Emirate, 1% is in Ras Al Khaimah Emirate, and 1% is in Ajman Emirate. | ||||
| • | Torripsamments – medium relief (5–10 m) make up 1,115,679 ha, or 16% of the UAE. About 81% is in Abu Dhabi Emirate, 11% is in Dubai Emirate, 5% is in Sharjah Emirate, 2% is in Umm Al Quwain Emirate, and 1% is in Ras Al Khaimah Emirate. | ||||
| • | Torripsamments – high relief (>10 m) make up 2,763,840 ha, or 39.5% of the UAE. About 99% is in Abu Dhabi Emirate and the remaining 1% is in Sharjah Emirate. | ||||
3.3.11. Rock outcrops (0.5%)
The unit does not include the extensive areas of rock outcrop that are part of the mountains, but instead is composed of areas of rock outcrop surrounded by soils. In some areas it consists of steep rocky hills while in other locations it is composed of rounded hills of low relief. The kinds of rock making up the outcrops vary, and include sandstone, conglomerate, limestone, gypsum, ophiolite, gabbro and others depending on the geology of the area. This map unit covers 33,830 ha, or 0.5% of the UAE. About 88% of the unit is in Abu Dhabi Emirate, 7% is in Sharjah Emirate, 4% is in Fujairah Emirate, and the remaining 1% is in Ras Al Khaimah and Ajman Emirates.
3.3.12. Mountains (4.7%)
This map unit consists of mountainous areas that were not included within the areas surveyed by the various soil survey projects of the UAE, but were delineated based on existing geological data (CitationStyles et al., 2006). It covers 331,776 ha, or 4.7% of the UAE. About 45% of the unit is in Ras Al Khaimah Emirate, 41% is in Fujairah Emirate, 8% is in Sharjah Emirate, 3% is in Ajman Emirate, 2% is in Dubai Emirate, and 1% is in Abu Dhabi Emirate.
3.3.13. Miscellaneous units (3.6%)
This map unit consists of areas that were not surveyed because they were inaccessible and/or too highly disturbed to be classified as soil. Included within this unit are quarries, urban and built-up areas, earthworks, sanitary landfills, tidal flats, filled and leveled areas, and some restricted areas such as military bases and palace grounds. This map unit covers 255,153 ha or 3.6% of the UAE. About 72% of the unit is in Abu Dhabi Emirate, 14% is in Dubai Emirate, 7% is in Sharjah Emirate, 3% is in Ajman Emirate, 2% is in Umm Al Quwain Emirate, and 2% is in Ras Al Khaimah Emirate.
4. Conclusions
For the first time a generalized soil map of the entire United Arab Emirates has been produced at a scale of 1:700,000. The map was compiled by generalizing, joining, and correlating the information contained in previously published soil maps of Abu Dhabi Emirate, Dubai Emirate, and the Northern Emirates. The map consists of 15 map units, which are based mainly on the dominant soil types. The most widespread soil of the UAE is Torripsamments (75%) which is composed of three map units based on relief differences (low <5 m, medium 5–10 m, and high >10 m), followed by Haplosalids (5.4%), Petrogypsdis (3.9%), Aquisalids (2.8%), Haplocalcids (1.7%), Haplogypsids (1%), Torriorthents (0.9%), Haplocambids (0.2%), Calcigypsids (0.2%), Petrocalcids (0.1%), in addition to other units such as mountains (4.7), rock outcrops (0.5), and miscellaneous units (3.3%). Due to the publication scale, other soils that are recognized within each map unit, in varying proportions, have been omitted. The map provides a general overview of the kinds of soils making up the UAE and their distribution.
tjom_a_746744_sup_29982939.pdf
Download PDF (3.2 MB)Acknowledgements
Research for this paper was carried out during the Soil Survey of the Northern Emirates. Financial support from the Environment Agency-Abu Dhabi (EAD) and logistic support from the UAE Ministry of Environment and Water are greatly acknowledged. We thank Dr. Craig Ditzler (USDA-NRCS retired) for discussions and assistance with developing the legend for the national map, and Mr. Rommel T. Pangilinan, (GIS Specialist, EAD) for help with the GIS work. Special thanks to Prof Fawzy Abdulkader from Alexandria University, Egypt for his critical comments on draft manuscript. We would also like to gratefully acknowledge the anonymous reviewers for their help in improving the article.
Software
ESRI ArcGIS Desktop is the primary software used to create the UAE soil map.
Related Research Data
References
- Abdelfattah , M. A. and Shahid , S. A. 2007 . A comparative characterization and classification of soils in Abu Dhabi coastal area in relation to arid and semi-arid conditions using USDA and FAO Soil Classification Systems . Arid Land Research and Management , 21 : 245 – 271 . (doi:10.1080/15324980701426314)
- Abdel-Kader , F. H. 2011 . Digital soil mapping at pilot sites in the northwest coast of Egypt: A multinomial logistic regression approach . The Egyptian Journal of Remote Sensing and Space Science , 14 : 2940 (doi:10.1016/j.ejrs.2011.04.001)
- Ahrens , R. J. 2008 . Digital soil mapping with limited data , Edited by: Hartemink , Foreword. In A.E. , McBratney , A. and de Lourdes Mendonca-Santos , M. 151 – 162 . Berlin : Springer Science+Business Media, B.V . Retrieved November 2012, from http://www.springer.com/environment/soil+science/book/978-1-4020-8591-8
- Alsharhan , A. S. and Kendall , C. G. S. C. 2002 . “ Holocene carbonate-evaporates of Abu Dhabi, and their Jurassic ancient analogs ” . In Sabkha ecosystems , Edited by: Barth , H. J. and Boer , B. 187 – 202 . Dordrecht , , The Netherlands : Kluwer Academic .
- Boer , B. 1998 . “ Ecosystems, anthropogenic impacts, and habitat management techniques in Abu Dhabi ” . PhD dissertation, the University of Paderborn, Germany .
- Boettinger , J. L. , Howell , D. W. , Moore , A. C. , Hartemink , A. E. and Kienast-Brown , S . 2010 . Digital soil mapping: Bridging research, environmental application, and operation , Edited by: Boettinger , J. L. , Howell , D. W. , Moore , A. C. , Hartemink , A. E. and Kienast-Brown , S . Dordrecht , , The Netherlands : Springer-Verlag .
- Brown , G. 2008 . “ Flora and vegetation of Abu Dhabi Emirate ” . In In The Terrestrial Environment of Abu Dhabi , Abu Dhabi : Environment Agency . ISBN 978-9948-408-33-8. Retrieved November 2012, from http://www.ead.ae/Tacsoft/FileManager/Publications/Books/terrestrial.pdf
- Bui , E. N. and Moran , C. J. 2001 . Disaggregation of polygons of surficial geology and soil maps using spatial modeling and legacy soil samples data . Geoderma , 103 : 79 – 94 . (doi:10.1016/S0016-7061(01)00070-2)
- Dubai Municipality . 2005 . Satellite imagery and thematic mapping project for Dubai Emirate. Final Report including soil map , Dubai , , UAE : Dubai Municipality .
- EAD . 2009 . Soil Survey of Abu Dhabi Emirate – Extensive Survey , Environment Agency – Abu Dhabi. United Arab Emirates, Volume 1, 506 pp . ISBN 978-9948-408-37-6
- EAD . 2012 . “ A set of 3 volumes including soil maps ” . In Soil Survey of the Northern Emirates , Abu Dhabi : Environment Agency .
- Grunwald , S. 2006 . “ What do we really know about the space–time continuum of soil-landscapes ” . In Environmental soil-landscape modeling: Geographic information technologies and pedometrics , Edited by: Grunwald , S. 3 – 36 . Boca Raton , FL : CRC Press .
- Grunwald , S. , Thompson , J. A. and Boettinger , J. L. 2011 . Digital soil mapping and modeling at continental scales: Finding solutions for global issues . Soil Science Society of America Journal , 75 : 1201 – 1213 . (doi:10.2136/sssaj2011.0025)
- Hartemink , A. E. , McBratney , A. and Mendonça-Santos , M. L. 2008 . Digital soil mapping with limited data , Edited by: Hartemink , A. E. , McBratney , A. and Mendonça-Santos , M. L. Berlin : Springer Science+Business Media, B.V. 445 pp . ISBN 978-1-4020-8592-5. Retrieved November 2012, from http://www.springer.com/environment/soil+science/book/978-1-4020-8591-8
- Karale , R. L. 1992 . “ Remote sensing with IRS-1A in soil studies: Development, status and prospects ” . In Natural resources management-a new perspective , Edited by: Karale , R. L. 128 – 143 . Bangalore : NNRMS .
- Kudrat , M. , Saha , S. K. and Tiwari , A. K. 1990 . Potential use of IRS LISS II digital data in soil landuse mapping and productivity assessment . Asian Pacific Remote Sensing Journal , 2 : 73 – 78 .
- Lagacherie , P. 2008 . “ Digital soil mapping: A state of the art ” . In Digital soil mapping with limited data , Edited by: Hartemink , A. E. , McBratney , A. and de Lourdes Mendonca-Santos , M. 151 – 162 . Berlin : Springer Science+Business Media, B.V . ISBN 978-1-4020-8592-5. Retrieved November 2012, from http://www.springer.com/environment/soil+science/book/978-1-4020-8591-8
- Lagacherie , P. , McBratney , A. B. and Voltz , M . 2006 . Digital soil mapping – an introductory perspective: Developments in Soil Science , Edited by: Lagacherie , P. , McBratney , A. B. and Voltz , M . Vol. 31 , Amsterdam : Elsevier .
- Manchanda , M. L. , Kudrat , M. and Tiwari , A. K. 2002 . Soil survey and mapping using remote sensing . Tropical Ecology , 43 : 61 – 74 .
- McBratney , A. B. , Mendonca Santos , M. L. and Minasny , B. 2003 . On digital soil mapping . Geoderma , 117 : 3 – 52 . (doi:10.1016/S0016-7061(03)00223-4)
- McBratney , A. B. , Odeh , I. O. A. , Bishop , T. F. A. , Dunbar , M. S. and Shatar , T. M. 2000 . An overview of pedometric techniques for use in soil survey . Geoderma , 97 : 293 – 327 . (doi:10.1016/S0016-7061(00)00043-4)
- McKenzie , N. J. and Austin , M. P. 1993 . AquantitativeAustralian approach to medium scale surveys based on soil stratigraphy and environmental correlation . Geoderma , 57 : 329 – 355 . (doi:10.1016/0016-7061(93)90049-Q)
- McKenzie , N. J. and Ryan , P. J. 1999 . Spatial prediction of soil properties using environmental correlation . Geoderma , 89 : 67 – 94 . (doi:10.1016/S0016-7061(98)00137-2)
- Minasny , B. , McBratney , A. B. and Lark , R. M. 2008 . “ Digital soil mapping technologies for countries with sparse data infrastructure ” . In Digital soil mapping with limited data , Edited by: Hartemink , A. E. , McBratney , A. and de Lourdes Mendonca-Santos , M. 15 – 30 . Berlin : Springer Science+Business Media, B.V . ISBN 978-1-4020-8592-5. Retrieved November 2012, from http://www.springer.com/environment/soil+science/book/978-1-4020-8591-8
- NASA . 2003 . The Shuttle Radar Topography Mission (SRTM) Digital Elevation Model (DEM) Version 2 . Retrieved November 2011, from http://www2.jpl.nasa.gov/srtm/index.html
- Raafat , H. 2006 . “ Climate: In physical geography sector paper, AGEDI initiative ” . UAE (pp. 72–92) Environment Agency – Abu Dhabi . Retrieved November 2012, from http://www.agedi.ae/Pages/pdf/1%20Physical%20Geography.pdf
- Ryan , P. J. , McKenzie , N. J. , O'Connell , D. O. , Loughhead , A. N. , Leppert , P. M. , Jacquier , D. and Ashton , L. 2000 . Integrating forest soils information across scales: Spatial prediction of soil properties under Australian forests . Forest Ecology and Management , 138 : 139 – 157 . (doi:10.1016/S0378-1127(00)00393-5)
- Sanchez , P. A. , Ahamed , S. , Carré , F. , Hartemink , A. E. , Hempel , J. , Huising , J. and … Zhang , G-L. 2009 . Digital soil map of the world . Science , 325 : 680 – 681 . (doi:10.1126/science.1175084)
- Shahid , S. A. and Abdelfattah , M. A. 2008 . “ Soils of Abu Dhabi Emirate ” . In Terrestrial Environment of Abu Dhabi Emirate Edited by: Perry , R. J. 71 – 91 . Retrieved November 2012, from http://www.ead.ae/Tacsoft/FileManager/Publications/Books/terrestrial.pdf
- Skidmore , A. K. , Varekamp , C. , Wilson , L. , Knowles , E. and Delaney , J. 1997 . Remote sensing of soils in a eucalypt forest environment . International Journal Remote Sensing , 18 : 39 – 56 . (doi:10.1080/014311697219268)
- Styles , M. T. , Ellison , R. A. , Arkley , S. L. B. , Crowley , Q. , Farrant , A. , Goodenough , K. M. and … Thomas , R. J. 2006 . The geology and geophysics of the United Arab Emirates . Volume 2: Geology. British Geological Survey, Keyworth, Nottingham, and Ministry of Energy, UAE
- UAE Yearbook . 2008 . UAE Year Book — Ministry of Information and Culture , UK : Trident Press Multimedia . Retrieved November 2012, from http://www.uaeinteract.com/uaeint_misc/pdf_2008/index2008.asp
- USDA-NRCS . 1999 . “ Soil taxonomy: A basic system of soil classification for making and interpreting soil surveys. USDA Agriculture Handbook No. 436 ” . Washington , DC : U.S. Government Print Office . Retrieved November 2012, from ftp://ftp-fc.sc.egov.usda.gov/NSSC/Soil_Taxonomy/tax.pdf
- USDA-NRCS . 2010 . Keys to soil taxonomy , 11 , Washington , DC : USDA–Natural Resources Conservation Service . Retrieved November 2012, from http://soils.usda.gov/technical/classification/tax_keys/
- Venkatratnam , L. 1980 . Use of remotely sensed data for soil mapping . Photonirvachak , 8 : 19 – 26 .
- Webster , R. and Burrough , P. A. 1972 . Computer-based soil mapping of small areas from sample data II. Classification smoothing . European Journal of Soil Science , 23 : 210 – 221 . (doi:10.1111/j.1365-2389.1972.tb01654.x)