Abstract
The paper presents initial steps into the research of commuting patterns and functional regions using mobile phone location data. The main aim is to introduce and discuss the potential of mobile phone location data as an alternative data sources to censuses for mapping commuting flows and subsequent functional regionalization. A set of analytical maps covering various aspects of regular daily movements of population and functional regionalization is provided. Estonia is serving as a pilot laboratory for analyses based on commuting flows derived from mobile phone location data. The maps give to reader a synthetic overview of contemporary settlement system in Estonia and introduce the potential of mobile phone location data for research in this field.
1. Introduction
The mapping of commuting patterns has been the interest of settlement geographers, urban planners and policy makers for decades. Regular daily movements between place of residence and place of work are seen as elemental indicator (1) for studies of population spatial mobility and (2) for analyses of urban/regional functional spatial structures. At the aggregated level a net of individual daily moves results in formation of commuting regions, i.e. bounded areas within which the majority of daily moves of residing population occurs. Although slight differences can be identified in the concept of commuting regions in literature (CitationCasado-Díaz, 2000; CitationVan der Laan, 1998), the principal idea is always the same: delimitation of relatively internally closed regions in sense of daily moves of residing population based on commuting data from censuses.
Commuting areas mean a very strong tool for planning and policy implementation, since scholars and policy makers recognize, that analyses based on administrative units do not provide a meaningful insight into the functional organization of regions (CitationCasado-Díaz, 2000). Contemporary literature points out several areas of application of functional regions including employment and transportation policies, environmentally sustainable spatial forms, reforms of administrative regions, strategic level of urban and regional planning and a wide range of geographical analyses (migration, regionalization, settlement system hierarchization) (CitationAndersen, 2002; CitationBall,1980; CitationCasado-Díaz, 2000; CitationVan der Laan, 1998). Moreover the concept of functional regions is used as a tool for delimitation of targeting areas of specific national and European policies, for example in Finland, France, Germany, Italy and Great Britain (OECD, Citation2002).
The most common data source for vast majority of studies dealing with commuting and functional structures of settlement systems are population censuses. In the era of dynamically changing land uses and commuting patterns, the 10 years gaps between censuses are inappropriate. Therefore alternative data sources are highly appreciated. Mobile phone location data represent one of such alternative. The potential of location data for the analyses of commuting patterns and the structure of settlement systems has not been sufficiently explored yet. Within this context the main aim of paper is to introduce and to test the mobile phone location data and related methodology for analyzing commuting patterns. The Estonia is serving as a pilot laboratory for analyses therefore the second aim is to provide deep insight into current commuting patterns and functional regionalization of Estonia. The majority of outputs are in cartographical form, that's why a map sheet was chosen as a basic tool for the distribution of research results. Thematically the paper continues for instance the work of CitationKiller and Axhausen (2010) on overlapping functional regions published recently in Journal of Maps. In this paper alternative data sources and corresponding methodologies to study commuting patterns and functional regionalization are presented.
The whole map sheet is conceptualized as a mosaic of complementary maps which present a spectrum of possible information that can be mined from mobile phone location data. The presented visualizations start with basic cartographical representations of commuting patterns and nighttime-daytime population dynamics (Map 1.2, 1.3a, 1.3b, 1.3c, 1.3d) and arrive at (a) synthetic overview of Estonian settlement system and inner functional relations (Map 1.4); (b) delimitation of functional regions using intramax method (Map 2.1) and (c) modeling commuting flows within Estonian road network (Map 2.2). The map sheet is divided into two sections due to two different levels of spatial resolution of source data. In the first section (Map 1.1-1.4) O-D matrix (original-destination matrix) at the level of municipalities is used. In the second section (Map 2.1, 2.2) very precise data based on particular sites of mobile phone network are employed (for detail see methodology).
2. Data and methods
The ability to localize a particular mobile phone within the network of base transceiver stations (BTS) represents the core functionality of every mobile network. It is possible to localize mobile phones in space because each BTS serves users present in certain spatially limited area. Various kinds of spatial information already exist and are permanently or temporally stored in mobile phone network. In this paper location information stored in billing memories (so called passive mobile phone location data) are used (CitationAhas, Aasa, Roose, Mark, & Silm, 2008; CitationAhas, Silm, Saluveer, & Järv, 2009). Passive location data include location of every call activity (outgoing calls, SMS, data) within the network of BTS. While the requirements for data gathering are minimal, the main obstacles lay in further data handling and mining of useful information.
The identification of home and work place was the key task in processing of raw passive mobile phone location data in this research (resp. nighttime and daytime key places of presence). For this reason the concept of anchor points was used (CitationAhas et al. 2009; Ahas, Silm, Järv, Saluveer, & Tiru, 2010; CitationLaasonen, 2009; CitationNurmi & Koolwaaij, 2006). The anchor point algorithm is based on the identification of places regularly visited in particular day/night times. After home and work anchors are identified, the creation of O-D matrix (origin-destination) is a simple step. All calculations and cartographic outputs presented in this paper are based on passive mobile phone location data provided by the biggest mobile phone operator in Estonia (EMT) and collected by company Positium LBS in the period from January 2007 to December 2009. The data cover approximately one-third of Estonian population. The social and spatial distribution of EMT customers is not absolutely regular. Therefore calibration with special local coefficients was used to make the data representative for the whole population. Local coefficients for sample recalculation were based on the results of targeted survey focused on mobile phone use in Estonia ordered from polling firm TNS EMOR by Department of Geography University of Tartu and official population statistics.
From the methodological perspective data at two different levels of spatial accuracy are used. In the first section of map sheet O-D matrix was recalculated to the level of municipalities (227 municipalities in Estonia). In the second section O-D matrix in spatial detail of particular BTS is used (918 sites units in Estonia). The first approach is consistent with public administration boundaries and official statistics. The second approach enables very detailed spatial analyses.
A particular attention has to be paid to the question of ethical and legal aspects of individual privacy. The data used in this paper do not have a character of individual information (it is not possible to join it to concrete person or to any individual information of concrete person outside of mobile operator database and it is not possible to identify concrete person from spatial trajectory of movements recorded in data). The anonymous character of the data is insured by: (1) the spatial resolution is not so accurate (approx. hundreds meters); (2) raw data are stored with anonymous identifier; (3) partial results are recalculated by coefficients to represent the whole population; (4) spatial unit with less than five users were excluded. According to these points the privacy of individual mobile phone users is ensured with respects to Estonian and European legislation on security of personal information (CitationEC, 2002; CitationRT, 2003; CitationRT, 2004). Separate approval was also sought from the Estonian Data Protection Inspectorate.
3. Results
The series of initial descriptive maps (Map 1.2, 1.3a–1.3b) uses simple cartographies to visualize the spectrum of information which was mined from mobile phone location data and which is complementary to commuting data from census. Map 1.2 shows the most important commuting flows which represent at least 50 commuters and have more than 30% share on total outgoing population from municipality of origin. The most important commuting flows build the basic skeleton of functional relations in settlement system and identify important regional centers. The presented background choropleth represents the proportion of daily population in comparison with nighttime population. Daytime-nighttime balance helps to identify regions which serve as magnets of daily mobility for work and services. The municipalities with extremely low, high respectively daytime-nighttime population balance are shown in Map 1.3a (relative values) and Map 1.3b (absolute values). Map 1.3c illustrates daily population dynamic represented by the proportion of commuters crossing the borders of municipality in both directions to total nighttime population of municipality.
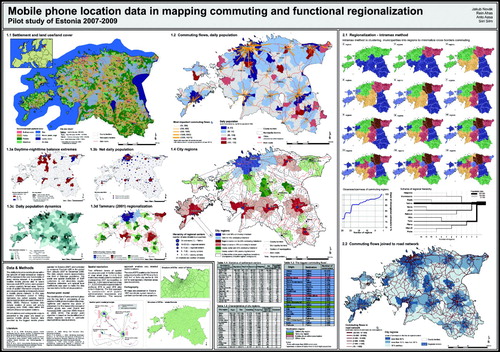
Map 1.4 represents a synthesis of previous and simpler descriptive maps. Here a complex overview of Estonian settlement system is done. Traditional approach of functional regionalization and delimitation of urban regions is used. In the first step settlement centers are identified. Municipality is considered as a settlement center if it serves as a destination of prime commuting flow for at least three other municipalities. The prime commuting flow is the biggest outgoing commuting flow from the particular municipality. In the second step the 30% and 15% commuting hinterlands are delimited for each settlement center. The municipality which has higher than 30% (15%) share of commuters going to a particular settlement center is considered as a part of hinterland. In the third step settlement centers and their hinterlands were divided into three hierarchical levels (prime city, regional centers, county centers) according to the number of subordinated municipalities and the size of hinterland. The final map of city regions can be directly compared to the settlement typology made by CitationTammaru (2001, Citation2005) based on extensive questioner survey with more than 44, 000 respondents (Map 1.3c). The series of map is supplemented by tables showing basic population and commuting characteristics of settlement centers (Table 1.1) and city regions (Table 1.2). Moreover in Table 1.3 the biggest commuting flows with size and place of origin and destination are presented.
Map 2.1 depicts functional regions in different steps of aggregation using intramax method. Principally the intramax method is based on sequential clustering of units with effort to minimize cross border moves and maximize inter-regional moves. For computation Flowmap 7.4 software was employed (CitationBreukelman, Brink, Jong, & Floor, 2009). Source data were prepared at the level of mobile phone network sites (918 spatial units). Usage of fine-grained spatial units allowed capture natural linkages between particular settlements based on population daily moves and then to depict natural regions within which daily life of inhabitants is to important extent organized. Decisions related to regional development, services provision as well as locally specific social and employment policies should reflect these natural regional structures. Therefore the results of regionalization are very useful for the purposes of regional planning and public administration. Formation of functional regions in different steps of aggregation enables to evaluate hierarchical relations within settlement system. The openness of regions measured by the share of cross border moves and three style scheme of regional hierarchy are presented in supplementary graphic.
Commuting flows at the level of particular BTS were joined to road network for more accurate picture of commuting patterns in Estonian settlement system. Final visualization very illustratively depicts the aggregation of commuting flows from neighboring municipalities into one common flow heading toward settlements centers (Map 2.2). The modeled road traffic intensities based on commuting flows derived from mobile phone location data mean a very promising output for further analyses and utilization in research as well as in practice. More detail confrontation of modeled road traffic intensities with information from traffic counters will be the next step of research in this subfield.
4. Conclusions
We argue that mobile phone location data represent a significant alternative source in cases where traditional data are missing or are not appropriate or the method of collection is not cost effective. On the other hand we are aware of the weaknesses of mobile phone location data as well as of the benefits of existing data sources (census, population registers). Mobile phone location data can provide commuting information for the majority of population in almost freely decided point of time and frequency of repetition, in greater spatial detail and much cheaper, than traditional means of data gathering. Moreover the time gap between the moment of survey and the moment of availability of data could be shorten to almost real-time mode. Because the levels of mobile phone penetration within the society are getting close to 100% the extent of surveys is comparable to censuses. The key factors limiting the current use of mobile phone location data are: (1) absolute novelty and very specific character of data; (2) the absence of additional socio-demographic information of respondents (exception is age, gender and preferred communication language in case of specific subset of mobile phone users); (3) only few existing examples of their use; (4) general fear of privacy violation and (5) discretion of mobile phone operators to provide data.
Here presented data, methodology and cartographical outputs introduce mobile phone location data as a promising direction of further intensive research and future utilization in urban/regional management and planning practice. Direct confrontation of information derived from mobile phone location data and traditional data about commuting from census is one of the most important future steps. The presented methods of analyses and visualization of commuting and functional regionalization are appropriate tools for such confrontation. Soon available data from 2011 Estonian census will provide excellent opportunity for the purpose. Because of the lack of additional socio-demographic variables mobile phone location data do not represent substitution to census. On the other hand, mobile phone data represent a valuable alternative to census for many research, policy and planning task. The potential of mobile phone location data and methods has special relevance for developing countries where almost no relevant and reliable population data exist (non-existent or unreliable statistics; Asian, South American and African countries).
Software
Standard database and table calculator programs MS Access and MS Excel were used for data processing. Delimitation of functional regions using intramax method and modeling commuting flows within road network were done in Flowmap 7.4 software (CitationBreukelman et al., 2009; http://flowmap.geog.uu.nl). Cartographical visualizations were done in ESRI ArcGIS 9.3 and the Corel Draw 12 was used to make final design of map sheet.
Supplemental Material
Download PDF (8.9 MB)Acknowledgements
The paper was prepared with funding provided by European Social Fund in Mobilitas postdoctoral research grant no. MJD146, by Estonian Science Foundation in grant no. 7562 and by Estonian Ministry of Education and Science in Target Funding Project no. SF0180052s07. The authors wish to thank for support and funding the Estonian Information Technology Foundation (EITSA), Ericsson Ltd., Positium LBS, EMT Ltd.
References
- Ahas, R. , Aasa, A. , Roose, A. , Mark, Ü. , and Silm, S. , 2008. Evaluating passive mobile positioning data for tourism surveys: An Estonian case study , Tourism Management 29 (3) (2008), pp. 469–486, (doi:10.1016/j.tourman.2007.05.014).
- Ahas, R. , Silm, S. , Järv, O. , Saluveer, E. , and Tiru, M. , 2010. Using mobile positioning data to model locations meaningful to users of mobile phones , Journal of Urban Technology 17 (1) (2010), pp. 3–27, (doi:10.1080/10630731003597306).
- Ahas, R. , Silm, S. , Saluveer, E. , and Järv, O. , 2009. "Modelling home and work locations of populations using passive mobile positioning data". In: Gartner, G. , and Rehrl, K. , eds. Location based services and TeleCartography II . Berlin Heidelberg: Springer; 2009. pp. 301–315.
- Andersen, A. K. , 2002. Are commuting areas relevant for the delimitation of administrative regions in Denmark? , Regional Studies 36 (8) (2002), pp. 833–844, (doi:10.1080/0034340022000012289).
- Ball, R. M. , 1980. The use and definition of travel-to-work areas in Great Britain: Some problems , Regional Studies 14 (2) (1980), pp. 125–139, (doi:10.1080/09595238000185121).
- Breukelman, J. , Brink, G. , Jong, T. de , and Floor, H. , 2009. Manual Flowmap 7.3 . Utrecht, The Netherlands: Faculty of Geographical Sciences Utrecht University; 2009, Retrieved November 1, 2012, from http://flow.geog.uu.nl.
- Casado-Díaz, J. M. , 2000. Local labour market areas in Spain: A case study , Regional Studies 34 (9) (2000), pp. 843–856, (doi:10.1080/00343400020002976).
- EP Directive 2002/58/EC (Directive on Privacy and Electronic Communications). (2002). Official Journal of the European Communities, 45(L201), 37–47..
- Killer, V. , and Axhausen, K. , 2010. Mapping overlapping commuting-to-work areas , Journal of Maps (2010), v2010, 147–156.
- Laasonen, K. , 2009. Mining cell transition data . Helsinki: University of Helsinki; 2009.
- Nurmi, P. , and Koolwaij, J. , 2006. "Identifying meaningful locations". In: 3rd Annual International Conference on Mobile and Ibiquitous Systems: Networks and Services (Mobiquitous) . San Jose: IEEEC Computer Society; 2006.
- OECD. (2002). Redefining territories, the functional regions. OECD (p. 15). Paris: Author. Retrieved October 11, 2011, from http://www.oecd.org/LongAbstract/0,3425,en_2649_34413_15181242_119684_1_1_1,00.html..
- RT Personal Data Protection Act of Estonia. (2003). Retrieved November 1, 2012, from http://www.legaltext.ee/et/andmebaas/tekst.asp?loc=text&dok=X70030&keel=en&pg=1&ptyyp=RC&tyyp=X&query=RT+I+2003%2C+26%2C+158..
- RT Electronic Communications Act of Estonia. (2004). Retrieved November 1, 2012, from http://www.legaltext.ee/et/andmebaas/tekst.asp?loc=text&dok=X90001K2&keel=en&pg=1&ptyyp=RC&tyyp=X&query=RT+I+2004%2C+87%2C+593..
- Tammaru, T. , 2001. Eesti linnade mõualad ja pendelränne: Lõpparuanne [Sphere of influence and migration in the Estonian Towns: Final report] . Office of the Minister of Population Affairs. Tallinn. 2001.
- Tammaru, T. , 2005. Suburbanisation, employment change, and commuting in the Tallinn metropolitan area , Environment and Planning A 37 (9) (2005), pp. 1669–1687, (doi:10.1068/a37118).
- Van der Laan, L. , 1998. Changing urban systems: An empirical analysis at two spatial levels , Regional Studies 32 (3) (1998), pp. 235–247, (doi:10.1080/00343409850119733).