Abstract
Nowadays, people divide their activities into different spaces and times, often depending on information and transport networks. Moreover, each social group generates an interaction with others in terms of social, economic and functional activities. These relationships are complicated to display, however an approach can be made from potential models. Population potential is one of the most fruitful adaptations of Physics laws to the field of Human Geography.
The gravity model suggests that two separate groups of people, say in two cities, generate a mutual interaction proportional to the product of their sizes, and that this interaction is impeded by the frictional effect of the intervening distance over which it must take place (Rich, 1980. Potential models in human geography. Concepts and Techniques in Modern Geography, 26. University of East Anglia, Norwich).
Population potential indicates the intensity of possible interactions between social or economic groups at different locations. Therefore, it is an index of the nearness of people to one another and a measure of the influence of people at a distance. This study uses a variant of the gravity model, adding the population of each cell to the total potential calculated for it.
The result of this work is a raster map (5-km cell size) for Spain and France in 2008, at a scale of 1:5,350,000. This map uses a sequential color scheme to represent population potential and to illustrate the broad spatial distributions and interactions of population. This is a useful tool for functional and demographic analysis which supplements other population representations by density or symbol size.
1. Introduction and theoretical background
Potential model is an index of the intensity of possible interaction between social or economic groups at different locations. This potential interaction may be of goods, telephone calls and other forms of telecommunications, migration, and a whole range of other social and economic contacts (CitationRich, 1980). Therefore, population potential is an index of the nearness of people to one another or a measure of the influence of people at a distance. Slightly more concretely, it indicates the intensity of possible contact between people (CitationRich, 1980). Population potential is also a measure which helps to summarize the spatial distribution of the population of an area (CitationCraig, 1987).
In this study, we mapped population potential in France and Spain in 2008, displaying the intensity of possible interaction between social or economic groups at different locations. Population potential maps are not meant to replace maps which depict population volumes or densities; they are complementary information to visualize the population interactions (See Main Map). It later presents and explains the formulations and programs used for the calculation of the potentials and for the elaboration of the final map.
Historically, demography has been used scientifically for the trial, development and innovation of thematic cartography, following assumptions grounded in the semiology of graphics, and making use of the technological resources of each time period (CitationNoin, 2005). Examples include choropleth and point maps, maps with figures that are proportional to the represented value, cartograms, or choremes (CitationDent, 1999; CitationSancho, 1982; CitationSouiah & Totuain, 2005). Thanks to new electronic devices and animation (CitationSlocum, Mcmaster, Kessler, & Howard, 2005), recent decades have witnessed an improvement in presentation and analysis of demographic distributions (CitationCheyland, 2007; CitationKaddouri, 2008). Likewise, computers allow for the calculation and representation of models and formulations, which were previously difficult to achieve.
This is the context underlying the creation of population potential maps, which visually represent variable geometries (CitationGómez Mendoza, 2001). This kind of thematic cartography shows the behavior patterns of society, considering population as a continuous phenomenon in the space.
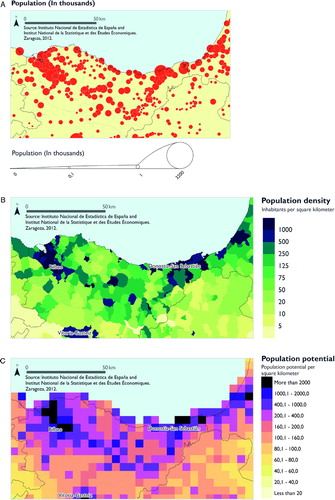
Traditionally, demographic variables are represented statically, with population distribution maps in absolute numbers or densities. Only existing population values are reflected either the total population amount or in relation to the surface of administrative units (see ). On the other hand, population potential maps consider distance (position) with respect to the remaining population centers and assess their impact over the surrounding space. This dynamic way of using population data allows for the representation of axes or spheres of influence that are decisive in the organization of socio-economic activities which were not visible in maps that used traditional methods (see ).
Figure 1. Maps of population: A. Map of population by proportional symbols; B. Population density map; C. Map of population potential.
Population potential is one of the most fruitful contributions of Physics to the field of Geography, basing itself on Newton's law of universal gravitation that describes the gravitational interaction between different bodies. In the mid nineteenth century, Carey applied this law to analyze population, considering that the area of influence of a population was proportional to the number of people living in it, and that such influence decreased as distance increased (CitationCarey, 1858). Reilly, Stewart, and Zipf developed this concept, in order to analyze interactions occurring among a wide range of social phenomena (CitationCamagni, 2005; CitationPueyo, 1994). In principal, gravitational models accept that the larger the population center and the closer the distance, then the larger the inferred potential will be. Hence, it becomes a good flow and position indicator. However, the mapping of potentials does not account for discontinuities linked to space tunnels caused by air or rail travel, for example. The Euclidean distance between locations is used to calculate population potential although we assume it is a first approximation to the reality. Network analysis would allow to measure distances in terms of time spent to move from one location to another. On the other hand, the access to calculation systems is generalized which facilitates the development of these studies at all scales and breakdown levels (CitationBoursier-Mougenot, Cattan, Grasland, & Rozenblat, 1993; CitationFaiña, Fernández, Landeira, & López, 2001; CitationGrasland, 1991; CitationIGN, 2008; CitationIsard et al., 1971; López-Rodriguez et al., 2006; Zúñiga Antón, Pueyo Campos, Sebastian López, & Calvo Palacios, 2010).
2. Methods
The demographic data contained in this paper belong to the Instituto Nacional de Estadística Español (INE) (Spanish National Institute of Statistics) and France's National Institute of Statistics and Economic Studies (INSEE).
2.1 Design and preparation of a matrix for the calculation and representation of population potentials
A 5 × 5 km matrix was chosen after considering size variation and numeric differences between municipalities in Spain (8117 municipalities) and France (36,570 communes). The study followed previous experiences in Spain (CitationIGN, 1992) and research proposals, which are currently being applied by the INSEE for the representation of French population (INSEE http://www.insee.fr/fr/themes/detail.asp?reg_id=0&ref_id=donnees-carroyees&page=donnees-detaillees/donnees-carroyees/donnees_carroyees_doc.htm).
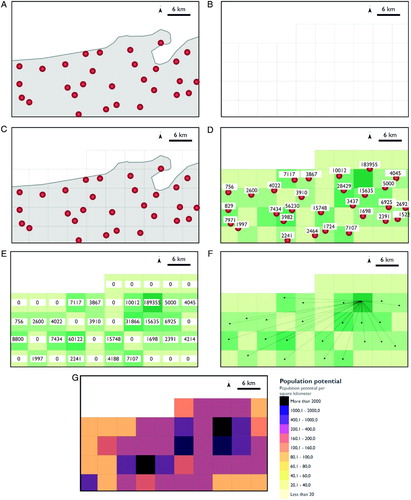
Each municipal seat was assigned a cell in the matrix. When more than one town coincided in a same cell, their populations were added together. As grids spanned 25 km2, the maximum distance between two municipal seats in a same grid was 7 km. Our assumption is that municipal centers 7 km far from each other are considered as the same demographic unit. Additionally, this demographic data matrix is also able to return exact values of population potentials for empty spaces in proximity to populated areas, which in other studies may only be obtained by interpolation.
Some aspects regarding to the calculation protocol have to be considered: On the one hand, there is no limit according to the maximum distance range; each cell is calculated related to every other cell in the entire study area. On the other hand, it should be explained a limitation related to the boundaries between Spain, France, Andorra and their respective neighbors (Portugal, Belgium, Luxembourg, Switzerland and Italy): an underestimation of the ‘population potential’ around the border areas should be expected because municipalities of the neighbor countries were not taken into account.
2.2 Calculating population potentials
For the creation of population potential maps for France and Spain in 2008, this study uses a variant of the gravitational model common to multiple demographic studies of the past three decades (CitationIGN, 2008):(1) where POT
i
is the population potential accumulated in cell i; Pj
are the officially registered inhabitants in each remaining countable cell in the system and Pi
are the inhabitants of cell i, while dij
is the distance in km between each pair of cells i and j. The process stages are described in .
3. Mapping population potentials
The superficial map is divided into raster cells. It adapts the base scale 1:1,000,000 provided by the Institut National de L'information Géographique et Forestière (French National Geographic Institute) in Lamber-93 projection and a simplified version in the same scale from the Instituto Geográfico Nacional (Spanish National Geographic Institute). The final result is a complete 1:5,350,000 map of France and Spain in Universal Transverse Mercator (UTM) projection (zone 31 N) with an ED50 datum.
Figure 2. Calculation process of population potential: A. Municipalities with population data. B. The 5 × 5 km matrix. C. Raster matrix overlaps the municipal layer. D. Assignation of each municipal population to a cell in the matrix. E. Population values are assigned to each cell. F. Calculating population potential. G. Final map of population potential.
A sequential scheme is used for the legend, aiming at adjusting the visual variable lightness by associating the darkest colors to the largest real variable magnitudes. The range of this real variable is increased by boosting the lightness hues.
4. Conclusions
Population potential maps are information to visualize the population interactions and consequently its influence in social and economic activities. These maps are analytical results that allow for the representation of settlement axis and their areas of functional influence. When correctly mapped, the technique offers valuable data for Space Management decision-making processes (CitationIGN, 2008):
| • | Delimitations for urban axes and their spheres of influence, given by the two addends in the formula (existing population and inferred population potential), the sum of which shades in proportion to its real importance. | ||||
| • | Assesses expectations for development or the implementation of activities in depopulated areas, by establishing its position in the system, depending on proximity to big urban centers. | ||||
Software
Calculations for population potential used demographic data entered into an Access database. Programing for the calculations was developed in Visual Basic, in order to later implement results on the Geographic Information System ArcGIS 10. This same program was used to design the map.
Supplemental Material
Download PDF (2.4 MB)Acknowledgements
The authors would like to thank the Inter-ministerial Commission of Science and Technology for funding provided through the research projects CSO2010-16389, the ‘Comisión de Trabajo de los Pirineos’ CTPP09/09, and the anonymous comments of reviewers, which have improved this study.
References
- Boursier-Mougenot, I. , Cattan, N. , Grasland, C. , and Rozenblat, C. , 1993. Images de potentiel de population en Europe , L'Espace géographique 4 (93) (1993), pp. 333–345, (doi:10.3406/spgeo.1993.3229).
- Camagni, R. , 2005. Economía urbana . Barcelona: Antoni Bosch; 2005.
- Carey, H. C. , 1858. Principles of social science . Philadephia: J.B. Lippincott; 1858.
- Cheyland, J. P. , 2007. Les processus spatio-temporels: Quelques notions et concepts préalables à leur représentation , Mappemonde 87 (2007), p. 21.
- Craig, J. , 1987. Population potential and some related measures , Area 19 (2) (1987), pp. 141–146.
- Dent, B. , 1999. Cartography: Thematic map design . New York: WCB/McGraw-Hill; 1999.
- Faiña, J. A. , Fernández, J. , Landeira, F. , and López, J. , 2001. La técnica de los potenciales de población y la estructura espacial de la Unión Europea , Revista de Investigación Operacional 22 (2001), pp. 1–10.
- Grasland, C. , 1991. Potentiel de population, intéraction spatiale et frontières: Des deux Allemagnes à l'unification , Espace Géographique 3 (1991), pp. 243–254.
- Gómez Mendoza, 2001. Un mundo de regiones: Geografía regional de geometría variable , Boletín de la Asociación de Geógrafos Españoles 32 (2001), pp. 15–33.
- Instituto-Geográfico-Nacional, 1992. Potenciales demográficos . Madrid: Centro Nacional de Información Geográfica; 1992.
- Instituto-Geográfico-Nacional, 2008. Demografía, Monografías del Atlas Nacional de España . Madrid: Centro Nacional Información Geográfica; 2008.
- Isard, W. , Bramhall, D. , Carrothers, G. A. P. , Cumberland, J. H. , and Socholer, E. W. , 1971. Métodos de análisis regional: Una introducción a la ciencia regional . Barcelona: Ariel; 1971.
- Kaddouri, L. (2008). Réflexion sur la sémiologie graphique animée des flux. M@ppemonde [Online], 89 (2008.1). Available: http://mappemonde.mgm.fr/num17/articles/art08104.pdf.
- López-Rodriguez, J. , and Faiña, J. A. , 2006. Does distance matter for determining regional income in the European Union? An approach through the market potential concept , Applied Economics Letters 13 (2006), pp. 385–390, (doi:10.1080/13504850600650073).
- Noin, D. , 2005. Géographie de la population . Paris: Armand Colin; 2005.
- Pueyo Campos, A. (1994). Utilización de Cartografía para el análisis y diagnóstico de la localización de equipamientos. Zaragoza: Universidad de Zaragoza..
- Rich. (1980). Potential models in human geography. Concepts and Techniques in Modern Geography, 26. University of East Anglia, Norwich..
- Sancho Comíns, J. , 1982. Los asentamientos humanos: Ensayos de representación cartográfica , Anales de geografía de la Universidad Complutense 2 (1982), pp. 307–312.
- Slocum, T. A. , Mcmaster, R. B. , Kessler, F. C. , and Howard, H. H. , 2005. Thematic cartography and geovisualization . Upper Saddle River, NJ: Pearson/Prentice Hall; 2005.
- Souiah, S. A. , and Totuain, S. , 2005. L'analyse démographique et spatiale . Nantes: Du Temps; 2005.
- Zúñiga Antón, M., Pueyo Campos, A., Sebastian López, M., & Calvo Palacios, J. L. (2010). Estudio de la población en el atlas nacional de España. Variables relevantes para la ordenación territorial. Revista electrónica Proyección [Online], 9. Available: http://www.proyeccion.cifot.com.ar/ [Accessed December 2010]..