Abstract
Historical movement of the Montaguto earth flow in southern Italy has periodically destroyed residences and farmland, and damaged the Italian National Road SS90 and the Benevento-Foggia National Railway. This paper provides maps from an investigation into the evolution of the Montaguto earth flow from 1954 to 2010. We used aerial photos, topographic maps, LiDAR data, satellite images, and field observations to produce multi-temporal maps. The maps show the spatial and temporal distribution of back-tilted surfaces, flank ridges, and normal, thrust, and strike-slip faults. Springs, creeks, and ponds are also shown on the maps. The maps provide a basis for interpreting how basal and lateral boundary geometries influence earth-flow behavior and surface-water hydrology.
Introduction
The Montaguto earth flow () in the Apennine Mountains of southern Italy has been periodically active since at least 1954. The most extensive and destructive period of earth-flow activity began on 26 April 2006, when an estimated 6 million m3 earth flow mobilized, covering and closing Italian National Road SS90, and damaging several farm houses located next to it. Throughout this paper, we use the term earth flow when describing the Montaguto landslide because it is composed of predominantly fine-grained material and has a flow-like surface morphology (CitationHungr, Evans, Bovis, & Hutchinson, 2001, 2012; CitationKeefer & Johnson, 1983; CitationVarnes, 1978). However, most movement of Montaguto takes place by sliding along discrete shear surfaces. This sliding movement mechanism was confirmed by structures mapped as part of our research.
Figure 1. The Montaguto earth flow on 27 April 2006. Photo taken from a helicopter looking south toward the earth-flow toe.
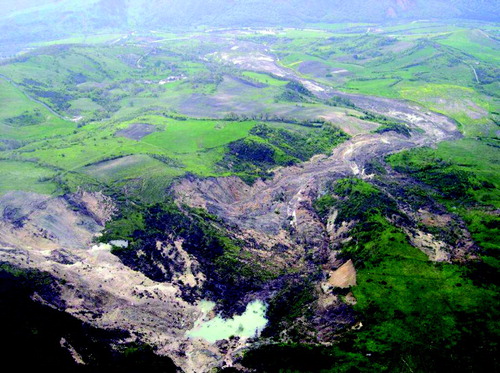
CitationHungr, Evans, Bovis, & Hutchinson (2001) recognized that movement of earth flow alternates between long periods of relatively slow movement and relatively rapid surges in movement. Since 1954, movement of Montaguto has followed such a pattern. Velocities of most movement between 1954 and 2010 have ranged from 1–2 mm/month to 2–5 cm/day. However, velocities during the large, rapid mobilization in 2006 () ranged from 1 m/day to 1 m/hour.
As a first step toward gaining a better understanding of the styles, segmentation, and evolution of movement at Montaguto, we mapped earth-flow structures and hydrologic features (i.e. creeks, springs, and ponds) at nine different dates from 1954 to 2010 (see for dates of mapping). Mapping of structures and hydrologic features on a similar earth flow in Colorado (e.g. CitationCoe, McKenna, Godt, & Baum, 2009; CitationFleming, Baum, & Giardino, 1999; CitationGuzzi & Parise, 1992) has shown that the distribution and types of structures can be used to identify and characterize areas of stretching and shortening, and that hydrologic features can be used to infer the geometry of the basal-slip surface. Our multi-temporal maps provide a basis for interpreting the kinematic behavior and evolution of the Montaguto earth flow between 1954 and 2010. Such an interpretation will be provided in a separate, forthcoming paper.
Previous work on the evolution of the Montaguto earth flow (CitationVentura, Vilardo, Terranova, & Sessa, 2011) evaluated topographic changes between 2006 and 2010 using LiDAR data exclusively. Our work extends and improves this previous analysis by evaluating a longer time period (1954–2010), incorporating additional source areas along the east and west flanks of the earth flow, and providing detailed maps of structures and hydrologic features for each of the nine mapping dates.
Base materials and mapping methods
The maps (Main maps) were produced using a variety of base materials and mapping methods (). For base materials, we used digital rectified and ortho-rectified photos or shaded-relief digital elevation model (DEM) images. Specifically, we used black and white stereo aerial photos (scale 1:33,000) taken in 1954, 1976, 1991, and 2003; orthophotos (scale 1:5000) acquired in June 2005; bare-earth, airborne LiDAR data acquired in 2006, 2009, and 2010; and Eros B orthophotos acquired in October 2007 and March 2010.
Table 1. Data used for base maps.
For our mapping, we used terminology and classifications from structural geology because they accurately depicted the geometry and relative sense of displacements for the structures that we observed. Structures such as back-tilted surfaces (), thrust faults and flank ridges ( and ), and normal and strike-slip faults ( and ) are expressions of local variations in earth-flow speed, volume, and boundary geometry (CitationFleming & Johnson, 1989; CitationFleming et al., 1999; CitationParise, 2003; CitationParise, Moscariello, & Fleming, 1997); variations in strengths of materials; and driving and resisting elements within earth flows (CitationBaum & Fleming, 1991). For each map, we differentiated active from inactive earth-flow areas based on changes in earth-flow boundaries, changes in drainage, and differences in the relative topographic roughness or relief of structures. We identified and mapped shallow landslides where we observed relatively small (always ≤2.2 hectares) areas of displaced material with well-defined headscarps and/or scars (normal faults) that were laterally contiguous with well-defined, downslope deposits and toes (thrust faults).
Figure 2. Back-tilted surface on the body of the earth flow with a small pond (about 7-m wide) located in the depression formed by back-tilting. Arrow shows the direction of back-tilting. Movement of the earth flow is from left to right.
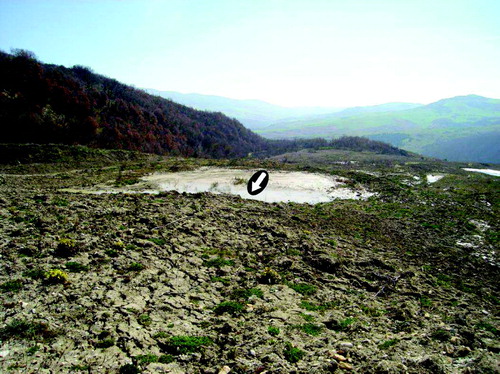
Figure 3. Thrust fault in the earth-flow source area. Linework shows the position of the mapped thrust fault. Thrust fault is about 100-m long at this location.
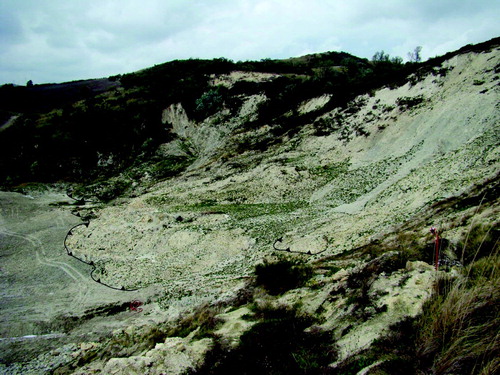
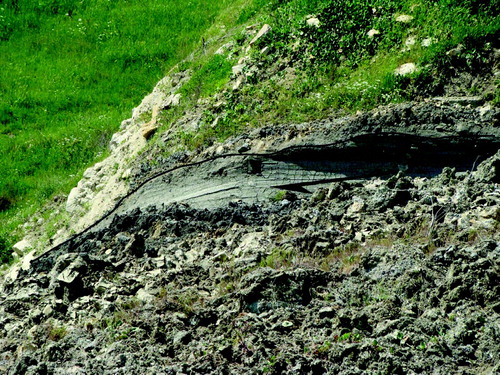
Figure 4. Flank ridge in the middle part of the source area of the earth flow. Linework shows the topographic crest of the ridge. Distance across the photo from left to right is about 150 m.
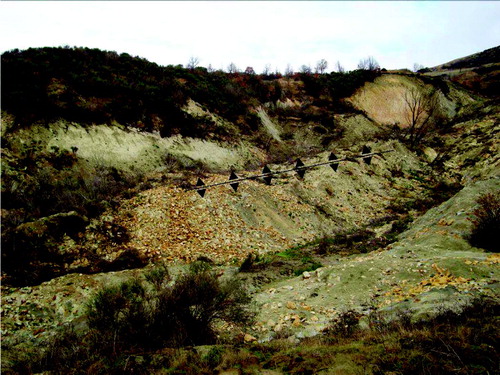
Figure 5. Normal faults at the head of the earth flow. Linework connects points along the top of the scarp. Height of the prominent scarp at the upper right is about 2 m.
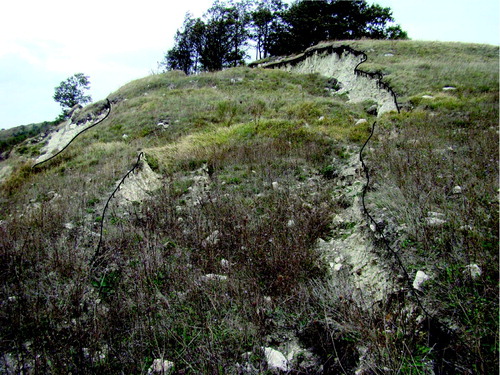
Figure 6. Strike-slip fault along the body of the earth flow. Slickensides and arrow show movement direction. Distance from left to right across the photo is about 4 m.
Prior to 2006, structural mapping was performed using photo interpretive methods (e.g. CitationKeaton & Degraff, 1996). For periods when stereo-aerial photos were available, structures were mapped using a stereoscope. Manually mapped structures were transferred to rectified photo base maps created from aerial photos scanned at 625 dpi (4 micron pixels). Photos were rectified using between 30 and 50 Ground Control Points (GCPs). These GCPs, which were visible in both the historical photos and in the field (e.g. corners of buildings, centers of stationary trees, etc.) were surveyed using real-time kinematic Global Positioning System (GPS) techniques (e.g. CitationGili, Corominas, & Rius, 2000) with dual-frequency GPS receivers in April 2010.
From 2006 to 2010, structures were mapped directly onto shaded-relief base maps in the field. Shaded-relief maps were created from LiDAR data with 1 m2 cells using DEM Relief Shader 2.3 QGIS-Plugin (Andreas Plesch, plugin for OSGeo public domain software, http://www.qgis.org/). Structures were mapped onto the shaded-relief base maps using kinematic GPS techniques, with a horizontal accuracy of about ±1 m.
Results
Below, we provide a brief description of each of the nine maps (Main maps). contains a description of earth-flow activity for the time period between each successive map.
1954 (Map sheet 1 of 3)
In October 1954, the earth flow was about 1 km long, ranged in elevation from about 775 m above sea level (a.s.l.) to 600 m a.s.l. (see contour map in lower right corner of each map sheet) and covered about 15 ha. The source area at the head of the earth flow was elongated in a NE-SW direction along an unnamed creek (herein called the ‘earth-flow creek’). Material in the source area had a flow-like morphology apparently formed from sliding along discrete, relatively large shear surfaces; as well as from sliding along relatively small, poorly defined shear surfaces distributed throughout the source area. Both normal and thrust faults were present in the source area. At about 650 m in elevation (labeled A on sheet 1), the narrowest part of the earth flow (the neck) on all subsequent maps could not be delineated because of superposition by a landslide along the west flank. Immediately downslope from this landslide was a region of shortening and material accumulation. We recognized two different types of accumulation deposits. A younger deposit covered an area of about 4000 m2 and had a fan shape defined by multiple thrust faults. This younger deposit overrode an older deposit that covered an area of about 3.5 ha. This older deposit also had a fan shape from previous spreading onto agricultural fields.
1976 (Map sheet 1 of 3)
In June 1976, the earth flow was larger and more complex than in 1954. The earth flow was about 2-km long and ranged in elevation from about 820 to 500 m a.s.l. The source area had expanded, was bounded by an irregular-shaped headscarp, and included many individual landslides within the overall active source area. Each of these internal landslides had normal faults at their heads and thrust faults at their toes. In the lower part of the source area, a central earth-flow core was bounded by strike-slip faults. The earth-flow neck was well defined, about 45-m wide, and was delineated at its upslope end by a group of normal faults (shown as a single fault because of scale limitations). As the earth flow emerged from the earth-flow neck, it changed direction and moved to the southeast, instead of to the southwest. The position and constricted width of the neck was controlled by tectonic faults and folds (CitationVentura et al., 2011; a common phenomenon for earth flows in southern Italy, see CitationRevellino, Grelle, Donnarumma, & Guadagno, 2010). The active earth-flow body downslope from the neck (about 18 ha in area) contained a few discontinuous strike slip faults and back-tilted surfaces, but otherwise had very few structures. The area of extensive thrust faults that was present to the southwest of the earth-flow neck in 1954 had enlarged to about 11 ha, but was inactive in 1976. The active earth-flow toe was bounded by a continuous thrust fault and had a large pond (locally called Lago delle Rane) on its surface. The earth-flow creek that flowed to the southeast in 1954, flowed to the southwest in 1976, and was established along the entire length of the earth flow.
1991 (Map sheet 1 of 3)
In June 1991, the overall boundaries of the earth flow were very similar to 1976. In the source area, the positions of normal and thrust faults were very similar to 1976; but a new pond had developed immediately upslope from the back-tilted surface and shallow landslides downslope from this surface were more extensive and well-defined compared to 1976. As in 1976, the earth-flow neck remained defined at its upslope end by normal faults. In the upper part of earth-flow body at about 600 m a.s.l. (labeled B on sheet 1), a large internal landslide was present. Near the earth-flow toe, Lago delle Rane was in the same position as in 1976. To the southwest of the active toe, a discrete landslide that was present in 1954 and 1976 had enlarged and contained internal normal and thrust faults.
2005 (Map sheet 2 of 3)
In June 2005, the overall shape of the earth flow in June 2003 was very similar to the shape in 1976 and 1991, but some structures visible in 1991 were not recognizable in 2003 imagery. In the source area, the positions of internal landslides and associated normal and thrust faults were very similar to 1976 and 1991, but were more poorly defined. The pond that was present in 1991 was still in the same position and a new pond was present in the middle part of source area. The earth-flow neck had the same configuration as in 1976 and 1991, and although the group of normal faults at the upslope end of the neck was present, they were more poorly defined. Along the east flank of the earth-flow body just downslope from the neck, many new shallow landslides were present. The overall shape of the toe was similar to that in 1991, but the extent of the active earth flow had progressed about 120 m farther downslope through linkage with the previously separate landslide along the west flank of the drainage valley in front of the toe, and with new landslides along the east flank of the valley. Lago delle Rane was in the same position as in 1976 and 1991, but had a well-defined creek upslope.
2005 (Map sheet 2 of 3)
In June 2005, the overall earth-flow shape was very similar to that from 1976 to 2003, but the resolution of the base map was greatly improved compared to previous years. This improvement made it possible to map more structures and drainage in greater detail than for previous years. In the source area, numerous flank ridges approximately parallel to the main earth-flow movement direction were present. Also, five new ponds were present in the source area, and the two ponds that were present in 2003 remained in the same positions. The earth-flow neck was several meters wider than in 2003, but contained internal strike slip faults at about the same positions as the 2003 boundaries. Normal faults were well-defined at the upslope end of the neck. The earth-flow body contained discontinuous strike-slip faults and two more back-tilted surfaces than in 2003. The number of ponds on the body had grown to 14, compared to one (Lago delle Rane) in 2003. Thrust faults and en echelon normal faults were present in the earth-flow body, and an extensive group of thrust faults were present just northwest of Lago delle Rane. Lago delle Rane was smaller than in 2003, but remained in the same position.
2006 (Map sheet 2 of 3)
The May 2006 map was prepared after the extensive mobilization of the earth flow in April 2006 closed National Road SS90. Therefore, the extent and shape of the earth flow, particularly in the source area and toe regions, was much different compared to 2005. Additionally, 2006 was the first year in which LiDAR data were available for use as a base map, so the level of visible detail increased dramatically, particularly for maps prior to 2005. One of the primary differences in the earth flow compared to 2005 was a larger source area. The source area appears to have complex boundary geometry with multiple smaller source zones controlled by bedding (a common phenomenon for earth flows in southern Italy, see CitationGrelle, Revellino, Donnarumma, & Guadagno, 2011; CitationRevellino et al., 2010). Within the expanded source area, there were two primary zones of paired extension and shortening. The upper zone consisted of the headscarp, internal landslides, back-tilted surfaces with associated ponds, and a cluster of thrust faults. The lower zone, which started immediately downslope from the cluster of thrust faults, consisted (in upslope to downslope progression) of a cluster of normal faults, flank ridges bounded by strike slip faults, and two thrust faults upslope from the neck. The clusters of thrust and normal faults in both zones were in the same spatial positions as in 2005 and, in general, were in similar positions as in previous maps going back to 1976. Also, as in previous years, a group of normal faults defined the upslope end of the earth-flow neck. Within the earth-flow body, the largest ponds visible in 2005 (excluding Lago delle Rane), remained in the same positions as 2005, but decreased in size. Lago delle Rane moved about 60 m to the east from its position in 2005, became larger, and was separated from the main earth flow by strike-slip faults. Just to the west of Lago delle Rane, some of the thrust faults that formed the 2005 earth-flow toe had stayed in the same position, and others were located about 100 m downslope. Just downslope from the cluster of thrust faults, a cluster of normal faults at about UTM 4565800 N (labeled C on sheet 2) were in the same position as 2005, but had expanded in an upslope direction. Downslope from this cluster of normal faults, the large landslide along the west flank that had been present since 1954 had a well-defined head and toe with the toe superimposed on the earth flow. From this point downslope, the v-shaped drainage valley that existed in 2005 had been filled by earth-flow material from the April 2006 remobilization. The new earth-flow toe was deposited on National Road SS90 and had a fan shape indicative of lateral expansion.
2007 (Map sheet 3 of 3)
In 2007, structures along the entire length of the earth flow were very similar to those in May 2006, even though the earth flow was actively moving between the two map dates (). This movement seems to be reflected by expansion of the earth-flow toe into the drainage north of SS90 (visible on May 2006 map). Additionally, the surface of the earth-flow toe was re-shaped for mitigation purposes and a new drainage ditch (labeled D on sheet 3) was installed immediately upslope from the earth-flow toe. The presence of the ditch resulted in the disappearance of six ponds that were on the earth-flow body in 2006.
Table 2. Earth flow movement and mitigation activities that occurred between mapping dates. Sources of information are given in column 2.
2009 (Map sheet 3 of 3)
In July 2009, structures and hydrologic features along the length of the earth flow were very similar to 2007, with several exceptions. For example, the northeastern part of the headscarp was larger than in 2007, an internal shallow landslide was present in the neck, Lago delle Rane had reformed in its 2006 position, the man-made drainage ditch upslope from the earth-flow toe had been destroyed, and the southwestern part of the earth-flow toe had developed a new failure.
2010 (Map sheet 3 of 3)
In June 2010, structures and hydrologic features along the length of the earth flow were very similar to 2009, with several exceptions. These exceptions included: a new pond in the western part of the source area; the re-establishment of six ponds on the earth-flow body in the same positions as 2006; the establishment of an internal landslide headscarp, pond, and back-tilted surface along the east flank of the earth-flow body just to the south of UTM 4565800 N (labeled E on sheet 3, also partly visible in 2009); expansion of the toe to cover both SS90 and the Benevento-Foggia railway, and the development of numerous strike-slip faults within the toe.
Conclusions
Periodic movement of the Montaguto earth flow has destroyed farmland and local residential structures since at least 1954. Since April 2006, movement of the earth flow has caused periodic closures of Italian National Road SS90 and the Benevento-Foggia railway. Our multi-temporal maps (Main maps) show the type and distribution of structures and hydrologic features related to periodic movement of the earth flow, as well as the effects from, and destruction of, a man-made drainage ditch. The maps provide a basis for an interpretation of the long-term kinematic evolution of the earth flow, as well as geometric and hydrologic constraints that influence earth-flow movement. Since the establishment of the spatially extensive earth flow in 1976, most of the primary structural elements and hydrologic features (i.e. ponds) have remained approximately spatially stationary through multiple pulses of movement. A forthcoming paper on the long-term kinematic evolution of the earth flow will quantify and explore the reasons for this stationarity.
Software
Maps were made using Quantum GIS Open Source Geographic Information System, licensed under the GNU General Public License. Quantum GIS is an official project of the Open Source Geospatial Foundation (OSGeo, public domain software, http://www.qgis.org/).
Supplemental Material
Download PDF (71 MB)Acknowledgements
This research was financed by the emergency management fund of the Italian National Research Council, Research Institute of Hydrological Protection (CNR-IRPI) of Turin. We thank Domenico Calcaterra, Bill Schulz, Mario Parise, and two anonymous reviewers for their thoughtful, constructive reviews.
References
- Baum, R. L. , and Fleming, R. W. , 1991. Use of longitudinal strain in identifying driving and resisting elements of landslides , Geological Society of America Bulletin 103 (1991), pp. 1121–1132.
- Coe, J. A. , McKenna, J. P. , Godt, J. W. , and Baum, R. L. , 2009. Basal-topographic control of stationary ponds on a continuously moving landslide , Earth Surface Processes and Landforms 34 (2009), pp. 264–279, doi: 10.1002/esp.1721.
- Fleming, R. W. , Baum, R. L. , and Giardino, M. , 1999. "Map and description of the active part of the Slumgullion Landslide, Hinsdale County, Colorado: US Geological Survey Miscellaneous Investigation Series Map I-2672". 1999, http://pubs.usgs.gov/imap/i-2672/.
- Fleming, R. W. , and Johnson, A. M. , 1989. Structures associated with strike-slip faults that bound landslide elements , Engineering Geology 27 (1989), pp. 39–114.
- Gili, J. A. , Corominas, J. , and Rius, J. , 2000. Using global positioning system techniques in landslide monitoring , Engineering Geology 55 (2000), pp. 167–192.
- Grelle, G. , Revellino, P. , Donnarumma, A. , and Guadagno, F. M. , 2011. Bedding control on landslides: A methodological approach for computer-aided mapping analysis , Natural Hazards and Earth System Sciences 11 (2011), pp. 1395–1409.
- Guzzi, R. , and Parise, M. , 1992. "Surface features and kinematics of the Slumgullion landslide". 1992, near Lake City, Colorado: U.S. Geological Survey Open-File Report 92-252, 45 p., 1 plate.
- Hungr, O. , Evans, S. G. , Bovis, M. J. , and Hutchinson, J. N. , 2001. A review of the classification of the flow type , Environmental and Engineering Geosciences 7 (2001), pp. 221–238, doi: 10.2113/gseegeosci.7.3.221.
- Hungr, O. , Leroueil, S. , and Picarelli, L. , 2012. "Varnes classification of landslide types, an update". In: Eberhardt, E. , Froese, C. , Turner, A. K. , and Leroueil, S. , eds. Landslides and Engineered Slopes, Protecting Society Through Improved Understanding: Proceedings of the 11th International and 2nd North American Symposium on Landslides and Engineered Slopes, Banff, Canada, 3–8 June . London: Taylor & Francis Group Vol; 2012. pp. 47–58.
- Keaton, J. R. , and Degraff, J. V. , 1996. "Surface observation and geologic mapping". In: Turner, A. K. , and Schuster, R. L. , eds. 1996, Landslides−Investigation and Mitigation: Transportation Research Board Special Report 247 (pp. 178–230). Washington, DC: National Academy Press.
- Keefer, D. K. , and Johnson, A. M. , 1983. (1983), Earthflows: morphology, mobilization and movement. U.S. Geological Survey Professional Paper 1264, 56 p.
- Parise, M. , 2003. Observation of surface features on an active landslide, and implications for understanding its history of movement , Natural Hazards and Earth System Sciences 3 (2003), pp. 569–580.
- Parise, M. , Moscariello, A. , and Fleming, R. W. , 1997. (1997), Evidence from flank ridges for long-term diminishing movement of the Slumgullion landslide, Hinsdale County, Colorado: U.S. Geological Survey Open-File Report 97–517, 14 p.
- Revellino, P. , Grelle, G. , Donnarumma, A. , and Guadagno, F. M. , 2010. Structurally-controlled earth flows of the Benevento Province (Southern Italy) , Bulletin of Engineering Geology and the Environment 69 (2010), pp. 487–500, doi: 10.1007/s10064-010-0288-9.
- Varnes, D. J. , 1978. "Slope movement types and processes". In: Schuster, R. L. , and Krizek, R. J. , eds. Landslides Analysis and Control: Transportation Research Board Special Report 176 . Washington, DC: National Academy Press; 1978. pp. 11–33.
- Ventura, G. , Vilardo, G. , Terranova, C. , and Sessa, E. B. , 2011. Tracking the evolution of complex active landslides by multi-temporal airborne LiDAR data: The Montaguto landslide (Southern Italy) , Remote Sensing of Environment 115 (2011), pp. 3237–3248, doi: 10.1016/j.rse.2011.07.007.