Abstract
Volcaniclastic debris flows are dangerous natural phenomena that originate in volcanic areas not only during or shortly after an eruption but also during a period of volcanic quiescence, when heavy and/or persistent rains remobilize unconsolidated pyroclastic deposits. In Italy, one of the areas most affected by these phenomena is that of the Apennine Mountains which border the southern Campania Plain surrounding the Vesuvius volcano. Historical accounts record in these areas that more than 500 debris flow events occurred during the last five centuries. These events caused very dangerous consequences such as loss of life and serious damage to property. An example is the devastating event of Sarno of 5 May 1998 which caused the death of more than 150 people and considerable damage to villages located at the foot of the Apennine Hills. In order to contribute to the assessment and mitigation of the debris flow risk, we propose a zonation map that identifies the areas more prone to generation and invasion by volcaniclastic flows. This map is based on field investigations and morphometric analyses derived from a digital elevation model with spatial resolution of 10 meters.
1. Introduction
Debris flow caused by the remobilization of pyroclastic material is a recurrent hazard in circumvolcanic areas that are characterized by steep slopes mantled by fallout deposits from past explosive activity. The Apennine Mountains surrounding the Vesuvius volcano represent just such a situation. These areas have been covered by pyroclastic deposits related to explosive eruptions of the Phlegrean Fields and Somma-Vesuvio volcanoes (CitationCioni et al., 2003). In situations of prolonged and persistent rainfall, these deposits can be remobilized, and have triggered very dangerous volcaniclastic flows that caused deaths and serious damage in villages. The most recent examples are from 1999 (Cervinara) and 1998 (Sarno – Quindici – Siano – Bracigliano area) that caused more than 150 deaths and heavy damage in Quindici and Episcopio villages (CitationDel Prete, Guadagno, & Hawkins, 1998; CitationPareschi et al., 2000). Debris flows also affected Bagni di Pozzano (4 deaths, 22 injured, and road closure for about 2 months) in 1997, Palma Campania in 1983, Villaggio di Vettica (30 deaths) in 1954, Amalfi (30 deaths) in 1924, Regina Major and Catara (60 and 110 deaths, respectively) in 1910, Molino delle Capre (120 deaths) in 1841, Salerno-Positano-Siano-Tramonti (120 deaths) in 1823, Gragnano (41 deaths) in 1764 and Sarno (40 deaths) in 1640 (CitationCalcaterra & Santo, 2004; CitationMigale & Milone, 1998). In order to mitigate hazard from the volcaniclastic debris flows, a preliminary hazard map was implemented for the Appennine areas surrounding Vesuvius in collaboration with the Italian Department of Civil Protection. This map identifies areas most exposed to triggering and invasion by volcaniclastic debris flows, based on the spatial distribution of recorded historical events (CitationBisson, Pareschi, Zanchetta, Sulpizio, & Santacroce, 2007; CitationBisson, Sulpizio, Zanchetta, Demi, & Santacroce, 2010), field investigations and the morphometric analysis of terrain (CitationPareschi, Santacroce, Sulpizio, & Zanchetta, 2002; CitationZanchetta et al., 2003; CitationZanchetta, Sulpizio, Pareschi, Leoni, & Santacroce, 2004).
2. Study area
The study area is located in the eastern portion of southern Campania () and represents the Apennine area surrounding Mount Vesuvius. In particular, it extends from the western edge of the Cancello Hills in the north to the southwestern termination of the Sorrentina Peninsula (blue outline) and covers about 650 km2. Its boundary is defined by the distribution of historical events and the presence of steep slopes covered by pyroclastic deposits that have thicknesses considered sufficient for potentially triggering debris flows, in heavy or extended rainfall. The threshold of deposit thickness is 40 cm. This is because the corresponding isomass (400-kg/m2 isopach) has more than 10% probability to be exceeded in case of renewal of explosive activity at Somma-Vesuvius with an eruption in the size of the Maximum Expected Event (MEE) (CitationDipartimento della Protezione Civile, 1995). This isomass represents a reasonable threshold for volcaniclastic flow initiation due to rainfall during or shortly after pyroclastic deposition (CitationBisson et al., 2007). Mount Vesuvius is currently considered to be in a quiescent state but, taking into account a possible renewal of volcanic activity, the scientific community, in collaboration with the Italian Department of Civil Protection, has hypothesized different volcanic scenarios (e.g. CitationCioni, Bertagnini, Santacroce, & Andronico, 2008) with different probability of occurrence (CitationNeri et al., 2008). The most popular scenario defines as the MEE a subplinian eruption, similar in scale to that which occurred in 1631 AD eruption (VEI 4-5; CitationCioni et al., 2008).
Figure 1. Location of the study area.
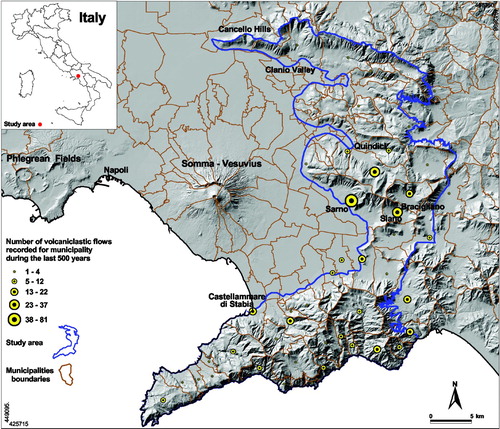
The bedrock of the investigated area consists of Meso-Cenozoic carbonates and Late Miocene sandstones (CitationBonardi, D'Argenio, & Perrone, 1988) mantled by colluvium mixed and/or interbedded with pyroclastic fall deposits originating from the explosive eruptions of the Campi Flegrei and Somma-Vesuvius volcanoes during the last 18,000 years. These pyroclastic products are dispersed mainly to the east and northeast corresponding to the prevailing stratospheric winds (e.g. CitationBarberi, Macedonio, Pareschi, & Santacroce, 1990; CitationCioni et al., 2003; CitationCosta et al., 2009).
3. Material and methods
The map presented here combines information derived from different source data and analyzed using a geographic information system (GIS). All data are stored as vector or raster thematic layers geocoded into the WGS 84 – UTM – Zone 33N reference projection. The data can be divided in three main groups: (i) a database of historical events recorded during the last 500 years, (ii) morphometric analyses derived from a digital elevation model (DEM) of the study area, and (iii) field investigations.
The database of historical volcaniclastic flows was obtained by collecting and compiling information about events that occurred over the last 500 years. This information derives from analyses of historical daily chronicles and bibliographic texts. The historical data are usually incomplete because only the events of large magnitude and/or those producing great damage and loss of life are recorded. In addition, the contemporary interpretations about the nature of past events are often faulty (e.g. CitationCarrara, Crosta, & Frattini, 2003). For example, an event is not necessarily a single volcaniclastic flow, because an intense precipitation can cause multiple flows over a large area or a number of slurries at different times in a single drainage basin as occurred during the Sarno event on 5–6 May 1998 (e.g. CitationZanchetta et al., 2004). In this study, an event is defined as one or multiple volcaniclastic flows if there is historical evidence in a certain municipality, which, obviously underestimates the actual number of individual debris flows. Because the exact locations (x, y) of all debris flows were not available, except for the recent events of Sarno and Clanio Valley (1998) and Castellammare di Stabia (1996) for which the source and invasion areas have been mapped, the historical database was linked to a point vector layer that attributed the number of events recorded for each municipality. The points are located at the barycentre (centroid) of each polygon representing the administrative boundary of the municipality (). In this way, 436 debris flow events were classified according to the municipality where they occurred and the date of occurrence.
The morphometric analysis to determine areas considered possible sources of debris flow initiation was performed on drainage basins whose boundaries were defined as that of the watershed generated a semi-automated algorithm from a 10 m resolution DEM (CitationTarquini et al., 2007). Each drainage basin identifies the maximum area that conveys water or volcaniclastic flows to the main channel feeding the alluvial system; this represents the possible source of debris flows capable of inundating alluvial fans and the surrounding areas. A total of 1296 drainage basins were delineated and stored in a polygon vector format (shapefile) connected to a database with the following attribute data: Code, Area, Perimeter, H_max, H_min, H_average, SL_average, Au, Al, BSF and PD (). The Code is a unique identifier for each single basin using an integer from 1 to 1296. Area and Perimeter report respectively the surface area (km2) and the perimeter length (km), computed automatically. The maximum and minimum heights of each basin (H max, H min), as well as the average height (H average = [H max + H min]/2), were derived from the DEM. The BSF (Basin Shape Factor) is an additional morphometric parameter that describes the geometry of a basin using a dimensionless number (the Au/Al ratio), where Au and Al represent, respectively, the upper and lower areas of the basin with respect to the average height line (CitationPareschi et al., 2000). Values greater than 1 identify drainage basins with Au greater than Al and therefore those that are characterized by a greater capacity to collect water in their upper portions and convey it toward the central channel. This can enhance erosion at the bottom of the channel, favoring upslope destabilization of the volcaniclastic cover. In addition, the summit portions of the basins with a high BSF have a greater morphological complexity that may favor the local development of conditions for triggering soil slip (CitationPareschi et al., 2002). The mean slope (SL_average) is expressed in degrees and calculated according to the following formula: SLaverage = [∑SL i ]/Ni ; where SL i is the value of individual cells belonging to the slope matrix of each basin, and Ni is the total number of cells in the basin. Finally, PD designates the degree of disruption proneness for each basin according to the criteria that will be explained in the next paragraph.
Table 1. A portion of the drainage basins database.
The field investigation, carried out immediately after the events of 1998, produced a map of source and invasion areas of the debris flows that occurred in the Sarno and Clanio localities and a detailed study of the relative sedimentological, stratigraphic and physical characteristics (CitationPareschi et al., 2002; CitationZanchetta et al., 2003, Citation2004). In these areas the soil cover is represented by loose or poorly consolidated deposits (thickness variable between 0.50 and 2 m) derived from past explosive eruptions at the Somma-Vesuvius volcano. For the Sarno zone, there are five involved eruptions (1631 AD, Pollena, Avellino, Mercato and Pomici di Base), whereas for the Clanio Valley there are seven (Pomici di Base, Greenish, Pomici Prinicipali, Mercato, Agnano Monte Spina, Avellino, and Pollena). In both the investigated areas, the 25° slope is recognized as the threshold for debris flow initiation, whereas the beginning of the area of deposition is identified by the upper limit of Pleistocene alluvial fan and by the active Holocene alluvial fan, with slopes of 15° and 6°, respectively. These two values could indicate the upper limit of areas potentially exposed to flooding (CitationPareschi et al., 2002), whereas the lower limit of the invasion area (∼1°) should be defined according to recent studies about the volcanic hazard at Vesuvius carried out in collaboration with the Italian Department of Civil Protection (CitationMazzarini & Bisson, 2008).
4. The volcaniclastic debris flow hazard map
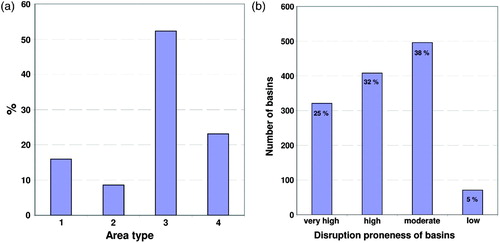
The Main Map shows areas characterized by different debris flow susceptibility identifying four main typologies: source areas for volcaniclastic debris flow triggering (i.e. drainage basins), flat areas subject to flooding, areas > of 15° slope not organized into basins, and unclassified areas of slope < 15° slope. The distribution of these four typologies expressed as a % of the total study area is shown in (a), whereas the distribution of drainage basins according to disruption proneness classes is represented in (b). In detail, the source areas for volcaniclastic debris flow triggering have been indentified by classifying drainage basins according to two morphometric parameters: slope (SL) and basin shape factor (BSF). Combining the thresholds of these two parameters, four classes of disruption proneness, with consequent potential triggering of debris flows, have been defined () and in the map each basin is colored according to its class of disruption proneness (see the Main Map. red = very high, orange = high, yellow = moderate, light blue = low).
Table 2. Classes of disruption proneness defined for each drainage basin (SL = slope, BSF = basin shape factor).
Figure 2. (a) Classes of topography expressed as a % of the total study area: 1 – Green areas are relatively flat, potentially vulnerable to debris flow inundation; 2 – Pink areas have slope >15° that were amenable to classification in basins; 3 – Drainage Basins; 4 – Others areas, slope <15° that were not classified into basins. (b) Distribution of drainage basins according to disruption proneness classes, as shown on the hazard map. See for explanation of classes.
The slope is considered the most important parameter in defining the proneness of a basin to the generation or deposition of volcaniclastic flows. It was divided into two classes: ≥25°, <25° (). As discussed above, a slope of 25° is a generally accepted as the threshold for debris flow initiation (i.e. CitationBovis & Jakob, 1999; CitationDe Riso, Budetta, Calcaterra, & Santo, 1999; CitationGabet & Dunne, 2002; CitationIverson, 1997); therefore drainage basins with an average slope greater than 25° can be considered highly prone to the generation of volcaniclastic flows, whereas those with average slopes less than 25° are considered slightly or moderately prone to trigger volcaniclastic flows. In particular, the drainage basins with average slopes less than 15° should indicate areas of probable deposition, because these values are typical of alluvial fan surfaces according to recent studies (CitationPareschi et al., 2000, Citation2002).
The thresholds of BSF are based on field investigations made on the 32 drainage basins affected by debris flows on 5 May 1998. More than 90% of these basins are characterized by a BSF value equal to 1.2 (±0.6), whereas the basins not affected by volcaniclastic flows show a value equal to 0.6 (±0.1) (CitationPareschi et al., 2000, Citation2002). Taking into account these data, drainage basins with BSF values greater than 1.2 were considered more prone to disruption by volcaniclastic flows than those with lower BSF values; therefore three classes of BSF were built (≥1.2; 0.6–1.2 and ≤0.6). These three classes identify basins characterized by funnel, rhombus and drop shape, respectively ().
Figure 3. Examples of basin shapes in Sarno-Quindici-Siano-Bracigliano region. Basin-shape factor (BSF) is defined as ratio of upper area of basin (Au) to lower area (Al); boundary between these two areas is at location of average height [hm = (hmax + hmin)/2] of basin. The figure is modified after CitationPareschi et al., 2000.
![Figure 3. Examples of basin shapes in Sarno-Quindici-Siano-Bracigliano region. Basin-shape factor (BSF) is defined as ratio of upper area of basin (Au) to lower area (Al); boundary between these two areas is at location of average height [hm = (hmax + hmin)/2] of basin. The figure is modified after CitationPareschi et al., 2000.](/cms/asset/24af2e8e-c9f5-4f47-89b6-2a20c0f32bf0/tjom_a_768948_o_f0003g.gif)
In addition to the drainage basins classification, the map shows two other areas, colored in green and in pink, respectively. The green zones represent areas potentially exposed to debris flow invasion and have been mapped taking into account the spatial distribution of historical flows, the presence of alluvial fans, morphological aspects and the slope analysis. The pink zones describe areas with slope >15° in which it was not possible to identify drainage basins. These areas, although not classified by BSF in this study, are probably still at some undefined risk of debris flows. Finally, the mapping of source and invasion areas of the volcaniclastic debris flows of 1998 and 1996 are reported in areas colored dark blue.
5. Results and conclusion
In the area of investigation surrounding Mount Vesuvius, drainage basins occupy more than 52% of the total area, whereas the green, pink and ‘other areas’ occupy 16%, 9% and 23% of the map area, respectively ((a)). The green areas indicate flat zones (slope <1°), the pink areas portions of slope >15° where the resolution of the DEM did not allow the identification of possible drainage basins. ‘Others areas’ indicate zones with a slope <15° and are not colored. It is worth noting the good match between the disruption proneness zonation and volcaniclastic flow events that have previously occurred. For example, the drainage basins affected by volcaniclastic flows in 1996 and 1998 are classified as high or very high disruption proneness areas.
In addition, since about 60% of drainage basins fall exclusively in the classes of high and very high proneness to disruption ((b)), the areas with a high potential for impact by debris flows (triggering or invasion areas) cover almost 50% of the study area. This confirms that at least half of the Apennine circumvesuvian territory has a high potential for volcaniclastic flows during syn and post-eruptive periods. A very large area is potentially subject to a high probability of volcaniclastic flow inundation, preventing the possibility of risk mitigation using engineering infrastructure such as check dams and free expansion areas. In turn, the use of a zonation map like the one presented here helps in the prioritization of the mitigation measures, which should be concentrated in the drainage basins most prone to volcaniclastic flow generation.
Main Map: A Map For Volcaniclastic Debris Flow Hazards in the Apennine Areas Surrounding Vesuvius Volcano (Italy)
Download PDF (314.1 KB)Acknowledgements
This study was partially financed by INGV-DPC Speed Project 2007–2008 (Task 2.4.1: Pericolosita`da alluvionamenti e scorrimento di lahar – Responsible: F. Mazzarini).
Software
All map design and analysis was performed using Esri ArcGIS 9.3.1.
Related Research Data
References
- Barberi , F. , Macedonio , G. , Pareschi , M. T. and Santacroce , R. 1990 . Mapping the tephra fallout risk: An example from Vesuvius, Italy . Nature , 344 : 142 – 144 .
- Bisson , M. , Pareschi , M. T. , Zanchetta , G. , Sulpizio , R. and Santacroce , R. 2007 . Volcaniclastic debris flow occurrences in the Campania region (southern Italy) and their relation to Holocene – Late Pleistocene pyroclastic fall deposits: Implications for large-scale hazard mapping . Bulletin of Volcanology , 70 : 157 – 167 .
- Bisson , M. , Sulpizio , R. , Zanchetta , G. , Demi , F. and Santacroce , R. 2010 . Rapid terrain based mapping of volcaniclastic flow hazard using gis-based automated methods: A case study from southern Campania, Italy . Natural Hazards , 55 : 371 – 387 . doi: 10.1007/s11069-010-9533-6
- Bonardi, G., D'Argenio, P., & Perrone, V. (1988). Geological Map of Southern Apennines: Consiglio Nazionale delle Ricerche (CNR), scale 1:250,000, 3 sheets.
- Bovis , M. J. and Jakob , M. 1999 . The role of debris supply conditions in predicting debris-flow activity . Earth Surface Process and Landforms , 24 : 1039 – 1054 .
- Calcaterra , D. and Santo , A. 2004 . The January 10, 1997 Pozzano landslide, Sorrento Peninsula, Italy . Engineering Geology , 75 : 181 – 200 .
- Carrara , A. , Crosta , G. and Frattini , P. 2003 . Geomorphological and historical data in assessing landslide hazard . Earth Surface Process and Landforms , 28 : 1125 – 1142 .
- Cioni , R. , Bertagnini , A. , Santacroce , R. and Andronico , D. 2008 . Explosive activity and eruption scenarios at Somma-Vesuvius (Italy): Towards a new classification scheme . Journal of Volcanology and Geothermal Research , 178 : 331 – 346 .
- Cioni , R. , Longo , A. , Macedonio , G. , Santacroce , R. , Sbrana , A. , Sulpizio , R. and Andronico , D. 2003 . Assessing pyroclastic fall hazard through field data and numerical simulations: Example from Vesuvius . Journal of Geophysical Research , 108 : 2063 doi: 10.1029/2002JB002251
- Costa , A. , Dell'Erba , F. , Di Vito , M. A. , Isaia , R. , Macedonio , G. , Orsi , G. and Pfeiffer , T. 2009 . Tephra fallout hazard assessment at the Campi Flegrei caldera (Italy) . Bulletin of Volcanology , 71 : 259 – 273 . doi: 10.1007/s00445-008- 0220-3
- Del Prete , M. , Guadagno , F. M. and Hawkins , A. B. 1998 . Preliminary report on the landslides of 5 May 1998, Campania, southern Italy . Bulletin of Engineering Geology and Environment , 57 : 113 – 129 .
- De Riso, R., Budetta, P., Calcaterra, D., & Santo, A. (1999). Le colate rapide in terreni piroclastici del territorio campano, Atti Convegno Previsione e prevenzione di movimenti franosi rapidi, Trento, 17–19 giugno 1999, pp. 133–150.
- Dipartimento della Protezione Civile (1995). Pianificazione nazionale d'emergenza dell'area vesuviana. Dipartimento della Protezione Civile p. 157.
- Gabet , E. J. and Dunne , T. 2002 . Landslide on coastal sage-scrub and grassland hillslopes in a severe El Niño winter: The effects on conversion on sediment delivery . Geological Society of America Bulletin , 114 ( 8 ) : 983 – 990 .
- Iverson , R. M. 1997 . The physics of debris flows . Reviews of Geophysics , 35 ( 3 ) : 254 – 296 .
- Mazzarini, F., & Bisson, M. (2008). – Stabilità di versante dei depositi di ricaduta, Report tecnico INGV (Progetto Speed – Scenari di Pericolosità per la Prevenzione del Rischio dei Vulcani della Campania – Prodotto D2.4.2 – Prodotto D2.4.23) pp 3.
- Migale , L. S. and Milone , A. 1998 . Colate rapide di fango in terreni piroclastici della Campania. Primi dati della ricerca storica . Rassegna Storica Salernitana , 15 : 253 – 271 .
- Neri , A. , Aspinall , W. P. , Cioni , R. , Bertagnini , A. , Baxter , P. J. , Zuccaro , G. , Andronico , D. , Barsotti , S. , Cole , P. D. , Esposti Ongaro , T. , Hincks , T. K. , Macedonio , G. , Papale , P. , Rosi , M. , Santacroce , R. and Woo , G. 2008 . Developing an event tree for probabilistic hazard and risk assessment at Vesuvius . Journal of Volcanology and Geothermal Research , 178 : 397 – 415 . (this issue). doi: 10.1016/j.jvolgeores.2008.05.014
- Pareschi , M. T. , Favalli , M. , Giannini , F. , Sulpizio , R. , Zanchetta , G. and Santacroce , R. 2000 . May 5, 1998, debris flows in circumvesuvian areas (southern Italy): Insights for hazard assessment . Geology , 28 : 639 – 642 .
- Pareschi , M. T. , Santacroce , R. , Sulpizio , R. and Zanchetta , G. 2002 . Volcaniclastic debris flows in the Clanio Valley (Campania, Italy): Insights for the assessment of hazard potential . Geomorphology , 43 : 219 – 231 .
- Tarquini , S. , Isola , I. , Favalli , M. , Mazzarini , F. , Bisson , M. , Pareschi , M. T. and Boschi , E. 2007 . TINITALY/01: A new Triangular Irregular Network of Italy . Annals of Geophysics , 50 ( 3 ) : 407 – 425 .
- Zanchetta, G., Sulpizio, R., Pareschi, M. T., Bisson, M., Cosimi, G., Favalli, M., Santacroce, R., & Sgrò, S. (2003). Volcaniclastic debris flows in the Clanio Valley (Campania, Italy). In Fast slope movement prediction and prevention for risk mitigation, Sorrento 2003, FMS paper n. 036 (5 pp.).
- Zanchetta , G. , Sulpizio , R. , Pareschi , M. T. , Leoni , M. and Santacroce , R. 2004 . Characteristic of May 5–6, 1998 volcaniclastic debrisflows in the Sarno areas (Campania, southern Italy): Relationships to structural damage and hazard zonation . Journal of Volcanology and Geothermal Research , 133 : 377 – 393 .