Abstract
Chronologies of a (Sub)urbanized Territory explores how the depth and scope of an atlas can be increased through a careful engineering of the interplay between its constituent maps. This research aims to develop a structure for an atlas that can include the plural and often very diverse historical processes affecting the territory without jeopardizing the coherence of the atlas as a whole.
Chronologies of a (Sub)urbanized Territory explores the perpetual reproduction of the heavily (sub)urbanized territory in southwest Flanders. The atlas is comprised of three diachronic map series: Frames, A Classic Chronology and Interrelations. Each series pictures the passage of time in a specific way and therefore offers a distinct ‘take' on the history of the region. Perpendicular to these three diachronic map series, synchronic readings of the territory can be composed: the variation between the three series in terms of scale, and in the categories that are displayed, enable the reader to gain a multi-angled perspective on specific spatial phenomena at delimited periods of time. The different components of the atlas, and how they interrelate, are clarified by a metamap. The metamap is not merely a top-down organizational tool, but is intended to form the basis from which the reader can start to construct his or her own interpretations of the territory.
‘Phenomena intersect, to see but one is to see nothing.’
Victor Hugo (as cited in Citation Jarvis 1997 )
1. Introduction
From town to territory: urbanism and the revival of cartography as a response to the shifting discourse within the field of spatial problematics
The discipline of urbanism (which was established as a distinct disciplinary field at the end of the nineteenth century although, in practice, it has a much longer history) has been occupied with the visualization of the built environment since at least the Renaissance (CitationSöderström 2000). In ‘Paper Cities’ (CitationSöderström 1996), Söderstrom traces the genealogy of their intertwined history via in-depth analysis of three of its canonical representations: the Rome of Leon Battista Alberti and Pope Nicholas V in the fifteenth century, Germany during the era of the first planning civil servants towards the end of the nineteenth century and the London of the Victorian slums around the same period. The iconographic plan, the master plan, the zoning plan, and the social cartography that defined these periods still account for a large part of the disciplines' cartographic repertoire at the end of the twentieth century (CitationSöderström 1996).
During the last few decades, a paradigm shift towards the subject of territory has triggered a huge re-investment into the exploration of cartography as one of the primary tools of urbanism. The paradigm shift within the discipline is symptomatic of a more widespread, cross-disciplinary shift – one that has seen the focus move from the town to the territory as the locus from which to tackle and debate increasingly complex spatial problematics (CitationCorboz 1983). Within the field of urbanism, a discipline that simultaneously encompasses both the science of the city and the study of forces that act upon it, cartography is being used to redefine the subject (by mapping it), and to reconfirm the essential role and fundamental meaning of the existing territory (and its mapped logic) as a means of projecting possible future developments. A wide range of cartographic exercises, taking place within disciplines ranging from urban design to landscape architecture, are relevant to this quest; they include the body of work that is gathered under labels such as ‘descriptive urbanism’(CitationSecchi 1992), ‘eclectic atlases’ (e.g. CitationBoeri 1998, CitationDe Meulder and Dehaene 2001), ‘explorative landscape mappings’ (e.g. CitationMcHarg 1969, CitationCorner and Maclean 1996, CitationMathur and da Cunha 2001, CitationMathur and da Cunha 2006, CitationCattoor and De Meulder 2011) and an emerging body of theoretical reflections on the topic (e.g. CitationSecchi 1992, CitationBoeri 1998, CitationCorner 1999, CitationCattoor 2009, CitationCattoor and De Meulder 2010). Each of these exercises represents an attempt to come to terms with the contemporary urban territory and all of its contradictions. The resulting atlases are often developed in an ‘expanded form’, and involve the dialectic combination of different types of visual material. They complement zenithal and lateral views, for example, (e.g. CitationCorner and Maclean 1996, CitationMathur and da Cunha 2001, CitationMathur and da Cunha 2006, CitationShannon, De Meulder et al. 2011), experiment with a mixture of scales (e.g. CitationCattoor and De Meulder 2011), incorporate time (e.g. CitationMcHarg 1969, CitationBerger 2002, CitationCattoor and De Meulder 2011), map everyday human practices as a crucial factor in the production of space (e.g. CitationMathur and da Cunha 2006) or combine process-information with spatial data (e.g. CitationBerger 2006). The diversity that exists within these contemporary urban cartographies demonstrates the varying views on the phenomenon of territory that exist within these disciplines. It also acknowledges the impossibility, indeed the undesirability, of being able to capture the territory in one final, definitive, single map.
Both the content and the form of Chronologies of a (Sub)urbanized Territory (CitationCattoor, Louwette and Thomsen 2013) are indebted to André Corboz's seminal text Le territoire comme palimseste. According to Corboz, the urban territory is not a given, but a construction (CitationCorboz 1983, p.16). Diverse processes continuously reshape its physical characteristics: geological processes, on the one hand, and transformations instigated by human interventions, on the other. Throughout history, successive waves of human activity have left their mark, each according to their own rationality. The constantly changing nature of these developmental processes accounts for the territory's perpetual state of metamorphosis, and its invariable reproduction. Yet the territory is not only constructed by these interventions, as described above, but through a variety of discourses (CitationCorboz 1983, p.18). Corboz presents the palimpsest as a metaphor for the discourse on territory (CitationCorboz 1983, p.33). Contrary to the archaeological concept of stratification, which expresses the depositing of layer upon layer (of human constructions), Corboz's palimpsest evokes a less rectilinear, less straightforward development: the layers of the palimpsest are rather thin, frail, often unfinished and, most importantly, the reinsertion of the palimpsest involves not only the addition of new layers but, more often than not, the erasure, mutilation or adaptation of old ones. The territory as a palimpsest is neither singular, nor rectilinear. It is characterized by condensation, conflict and perpetual metamorphosis.
2. Atlas Design
Multidirectional readings of the territory
Chronologies of a (Sub)urbanized Territory (CitationCattoor, Louwette and Thomsen 2013) explores the perpetual (re)production of the Kortrijk region. It documents the additions, reinscriptions, erasure, adaptation, accommodation and reuse of its existing spatial forms. The Kortrijk region in the south of West Flanders is representative of the dispersed urbanization of Belgium that is characterized by the simultaneous, as well as chaotic, presence of multiple spatial systems that overlap and, more often then not, conflict. This usually remains opaque to the observer; the spatial complexity of the region is far beyond the representational capacity of a single map. Atlases, by multiplying maps and relating them to each other, often present a more sophisticated representation of a territory. The deliberate editing of a set of single maps into the format of an atlas not only elucidates the meaning of the single maps through the logic of the book (CitationAkerman 1995, p.3), but adds an extra geometric layer to the logic, or geometry, of the individual maps: ‘… being a book, an atlas charts out the World according to a different geometry than its constituent maps’ (CitationAkerman 1991, p.2). Deliberately editing the structure of the atlas (as defined by CitationAkerman 1991, p.2) can thus add clarity, as well as complexity, to a collection of maps. In addition to clarifying their meaning, it is also possible to nuance the unidirectional image of a territory by arranging the maps in a sequence.
Chronologies of a (Sub)urbanized Territory (CitationCattoor, Louwette and Thomsen 2013) takes the form of a triptych and features three map series: Frames, A Classic Chronology and Interrelations. Each series follows a different logic regarding the scale, the maps categories and its approach to the passage of time. Each series develops a more or less chronological narrative and tracks the development of the territory through time in a very distinct way. Taken together, they offer three diachronic variations on the processes of (sub)urbanization in the region.
Perpendicular to these diachronic readings, a synchronic reading of the territory can be constructed. The maps within the different series interact with each other and form a multi-angled point of view through which to examine specific urbanization phenomena at delimited periods of time. The lines of interaction across the pre-defined map series add a second narrative dimension, although the possible readings are less immediately obvious.
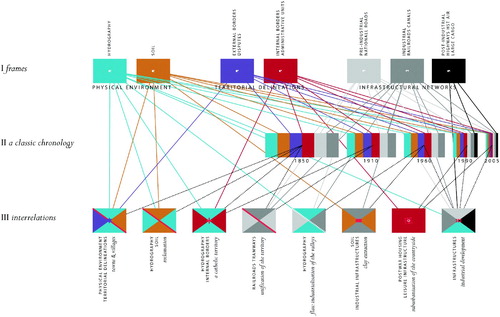
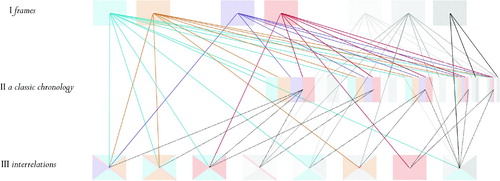
A metamap or, in other words, a map of maps (CitationAkerman 1995, p.3), opens up this multidimensional quality of the atlas, revealing possible trajectories across its pages (). The selective display of relevant parts of the metamap illuminates the different aspects of the atlas structure described in the following section.
Figure 1. Chronologies of a (sub)urbanized territory metamap.
I. Frames
A first series of maps on a scale of 1:500,000 situates the region in a larger geographical context and interprets the area as part of, or embedded within, large-scale spatial systems. These large-scale systems are the ‘frames’, the natural or man-made armatures, within which (sub)urbanization thrives. The set is limited to seven maps. Obviously, they do not provide a complete overview of all possible large-scale spatial frames. The set is intended to be an open-ended frame of reference, a base upon which further elaborations, extensions as well as divergent interpretations, can be grafted.
The frames are ordered in three thematic groups (): physical environment (two maps), territorial delineations (two maps) and infrastructure networks (three maps). These frames are arranged, generally speaking, in chronological order according to the approximate date at which they appeared within the territory. All seven frames nevertheless have a degree of contemporary relevance. The atlas begins with a set of two maps that show how the physical environment determined the location of human settlements. The following set of two maps depicts the shifts that took place with regard to the territorial borders and the, often temporary, consolidations of governmental (political and administrative) units, as major factors that steered further urbanization. The final set of three maps juxtapose the characteristic infrastructure of the pre-industrial, industrial and post-industrial era as the frameworks for the urbanization processes that have taken place over the last two centuries.
Figure 2. Chronologies of a (sub)urbanized territory i frames.
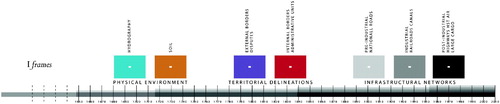
One predominant color is chosen for each frame. The colors of the first denote the physical environment and mimic those found in nature: blue for water, brown for soil. The colors of the second set are deliberately artificial, in keeping with the fact that drawing a border is ultimately an artificial act. The grey used to indicate the infrastructure pictured in the third set of maps darkens in relation to the increases in the speed with which the infrastructure enables us to move over the territory. By choosing prominent and, as far as possible, recognizable colors, we hope that these first seven maps will also act as ‘frames’ in the mind of the spectator. Black brackets indicate the area that is explored in greater detail in the second and third series of maps.
The seven maps in these series are compilations of data gathered from a variety of sources: historical and contemporary maps as well as historical and written sources, as enumerated in the reference list of the atlas (CitationCattoor, Louwette and Thomsen 2013).
II. A Classic Chronology
A second series of maps on the scale of 1:50,000, a tenfold zooming in on the first series, is conceived as a classic chronology (). A succession of snapshots picture the spatial transformation of the area during the last two centuries in greater detail. Parallel to the ever-faster tempo at which the (sub)urbanization occurs, the time interval between the snapshots gets ever smaller. Five maps depict the area circa 1850, ca. 1910, ca. 1960, ca. 1990 and ca. 2005.
Figure 3. Chronologies of a (sub)urbanized territory classic chronology.
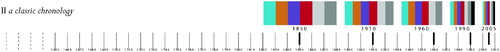
These five maps combine the spatial elements introduced in the first map series in a uniform way: a layer is added that brings the changes in the built environment into focus. The color scheme is consistent with the colors used in the first map series, with each of the five maps displaying all of the colors that were introduced therein, as far as they are relevant.
The data on the maps is derived from historical topographical map sets that vary in scale from 1:10,000 to 1:50:000. Classes to be displayed were extracted from them as consistently as possible. The 1990, 1960, 1910 and 1850 maps were constructed manually, working backwards from the situation as it was in 2005. They are, in fact, partially re-edited versions of the historical maps. Using a method that has been described by CitationWiberley (1980, p.500), the process involved the tracing of the lines and the transformation of the symbols found in the old maps. The tracing of the elements featured in the historical map series was executed in tandem with a retrospective comparison with the 2005 dataset, in order to correct as many historical inaccuracies as possible. The generalization of certain categories, for example the road and water networks found throughout the historical series, was handled in an equally careful manner. The historical maps have been re-edited instead of being reproduced in facsimile, in order to improve their comparability. Moreover, the re-editing allowed a careful selection of the features displayed and their layout but, in a way, removes part of their implicit historical meaning. These maps are not edited with the aim of better depicting historical reality, which was the main argument for the editing of historical maps put forth by CitationWiberley (1980). Instead, their layout is adapted in order to enhance the interaction between the different maps.
III. Interrelations
A third series of maps applies a similar scale of 1:50,000 and covers the same area as the second map series, the Kortrijk region. Each of these maps pictures a theme, mechanism or development that had a fundamental and enduring impact on the urbanization of the region over a well-defined time-span. They are not snapshots, but more like thematic cuts. The time-spans covered in the eight maps overlap: the processes of urbanization that are displayed cannot be isolated in time because different urbanization mechanisms operate simultaneously.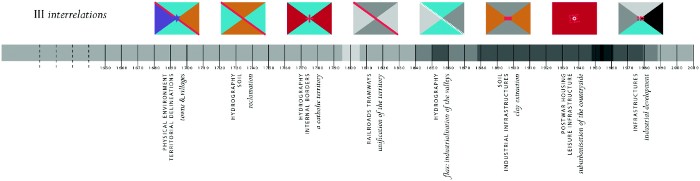
Figure 4. Chronologies of a (sub)urbanized territory interrelations.
The eight maps in this chapter contain material that has been selected and extracted from the first two maps series. They explore and interpret the dynamic interrelationship between the Frames pictured in the first series, and the accumulation of the built-up areas as illustrated in the Classic Chronology. The colors are, likewise, combined per map in sets of two, three or four, for example, depending on the spatial features that have been combined.
IV. Cross-readings
Perpendicular to these diachronic map series, a synchronic reading of the territory can be constructed. Maps of the different series interact to compose a multi-angled perspective on specific urbanization phenomena. Frames deliver a more or less systemic reading, stressing the importance of large-scale physical armatures in relation to urbanization. A Classic Chronology pictures the territory into great detail. It does not aim to isolate structures and attempts, instead, to underline the often-chaotic character of ongoing urbanization. Interrelations is a series of thematic cuts, looking at the area in great detail, but doing so with a selective eye. These maps try to make sense of how successive strata of historical development, each according to its own development logic, have defined and shaped the territory over and over again.
3. CONCLUSION
Enhancing complexity whilst increasing clarity
Chronologies of a (Sub)urbanized Territory proposes a refinement of the historical atlas format.
Each of the maps in the atlas has a more or less straightforward, albeit selective, topographical setup. The focus, however, is placed upon increasing the dimensionality of the cartography by consciously adding a second layer of geometry – the logic or structure of the atlas – over the geometry of the individual maps.
Time is recognized as a crucial variable within the structure of the atlas. The editing of Chronologies of a (Sub)urbanized Territory offers multiple narrative routes that can be followed through the individual maps. Three diachronic map series, Frames, A Classic Chronology and Interrelations all elaborate a different concept relating to how maps might be sequenced in order to imagine the passage of time. Consequently, each of the three map series offers a distinct 'take' on the history of the region. Synchronic readings of the territory run perpendicular to the diachronic map series, enabling the reader to form a multi-angled perspective on specific spatial phenomena at delimited periods of time. The possibilities for cross-readings are enhanced by the consistent use of symbols, and are guided by a metamap that clarifies the inter-relatedness of the different parts (maps) composing the atlas. The metamap is not merely a top-down organizational tool, but is intended to form a basis from which the reader can start to construct his or her own interpretations of the territory. The metamap makes clear, or at least partially, a quality that often remains vague but was eloquently described by Denis Wood, namely the way in which ‘…the inter-relatedness of the maps, through their juxtaposition and sequencing, make something higher, something no individual map could aspire to, to – out of the maps regarded as paragraphs – create a discourse, a mediation, to tell a story’ (CitationWood 1987, p.29).
Software
Adobe Illustrator CS4 was used for the creation and layout of the maps. Adobe InDesign CS4 was used for the assemblage of the maps into the atlas.
Supplemental Material
Download PDF (100.1 MB)Acknowledgments
The authors would like to thank all those who have contributed to this article. The FWO Research Foundation Flanders is funding the PhD research of Bieke Cattoor. We are foremost indebted to inter-municipal organization Leiedal, and especially to its director Karel Debaere, for giving us the opportunity to collaborate on the writing/drawing of a biography of the Leiedal region (CitationDe Meulder B., Hoornaert S., Van Herck K. (Eds.) 2010). This laid the foundations for Chronologies of a (sub)urbanized territory. Joeri De Bruyn and Karina Van Herck helped formulate the captions that accompany the maps. Hilde Heynen, Lieven De Cauter, Kelly Shannon and Michael Ryckewaert commented on the atlas. We would like to express our gratitude to Steven Hoornaert, Greet De Block, Brecht Dewaele and Yves Segers, Nele Plevoets, Janina Gosseye with Karina Van Herck and Katrien Theunis, Michael Ryckewaert and Maarten Van Acker who provided input into, respectively, the first and second, fourth, fifth, sixth, seventh and eighth maps of the Interrelations series. Last but not least, we would like to thank Helen Simpson for showing patience and dedication in editing the English text.
References
- De Meulder B., Hoornaert S., Van Herck K. (Eds.) (2010). Metamorfosen. Een ruimtelijke biografie van de regio Kortrijk. Brussels Kortrijk, Dexia & Intercommunale Leiedal.
- Akerman, J. (1991). On the shoulders of a Titan: Viewing the World of the Past in Altas Structure, Pennsylvania State University. PhD..
- Akerman, J. (1995). From Books with Maps to Books as Maps: The Editor in the Creation of the Atlas Idea. In J. Winearls (Ed.), Editing Early and Historical Atlases: papers given at the twenty-ninth annual Conference on Editorial Problems, 5–6 November 1993, University of Toronto (pp. 3–48). Toronto, Buffalo, London: University of Toronto Press..
- Berger, A. , 2002. Reclaiming the American West . New York: Princeton Architectural Press; 2002.
- Berger, A. , 2006. Drosscapes. Wasting Land in Urban America . New York: Princeton Architectural Press; 2006.
- Boeri, S. , 1998. Eclectic Atlases: Four Possible Ways of Seeing the City , Daidalos 69-70 (1998), pp. 102–113.
- Cattoor, B. , 2009. "Exploring and Expanding the Urbanist Potential of Atlas' Format". In: De Meulder, B. , Ryckewaert, M. , and Shannon, K. , eds. Transcending the discipline: Urbanism & Urbanization . OSA-KULeuven: University of Leuven; 2009. pp. 193–199.
- Cattoor, B., & De Meulder, B. (2010). Iteration between Collaborative Urbanism and Formal Cartographies: Design experiments in Southwest Flanders. In N. Meijsmans (Ed.), Designing for a Region (pp. 202–213). Amsterdam: SUN..
- Cattoor, B. , and De Meulder, B. , 2011. Figures Infrastructures: An Atlas of Roads and Railways . Amsterdam: SUN; 2011.
- Cattoor, B., Louwette, T., & Thomsen, K. (2013). ublished Map. In Cattoor, B. (2013) Chronologies of a (sub)urbanized territory: Reimagining (sub)urbanization processes in soutbwest Flanders, Belgium, Journal of Maps, XXXXXXXXXX.
- Corboz, A. , 1983. The Land as Palimpsest , Diogenes 31 (121) (1983), pp. 12–34, (doi:10.1177/039219218303112102).
- Corner, J. (1999). The Agency of Mapping: Speculation, Critique and Invention. In D. Cosgrove (Ed.), Mappings (pp. 213–252). London: Reaktion Books..
- Corner, J., & Maclean, A. (1996). Taking Measures Across the American Landscape. New Haven, CT London, Yale University Press..
- De Meulder, B. , and Dehaene, M. , 2001. Atlas Zuidelijk West-Vlaanderen. Fascikel 0&1 . Kortrijk. 2001, Anno ‘02 CaD.
- Jarvis, B. , 1997. Postmodern Cartographies: The Geographical Imagination in Contemporary American Culture . New York: St. Martin's Press; 1997.
- Mathur, A. , and da Cunha, D. , 2001. Mississippi Floods: Designing a Shifting Landscape . New Haven, CT. 2001, London, Yale University Press.
- Mathur, A. , and da Cunha, D. , 2006. " Deccan Traverses: The Making of Bangalores Terrain ". New Delhi: Rupa & Co; 2006.
- McHarg, I. L. , 1969. Design with Nature . Garden City, N.Y: Natural History Press; 1969.
- Secchi, B. , 1992. Urbanistica Descrittiva , Casabella 56 (588) (1992), pp. 22–23.
- Shannon, K. , et al., 2011. From Above/From Below: The Case of Cantho, Vietnam , New Geographies 4 (2011), pp. 73–84.
- Söderström, O. , 1996. Paper Cities: Visual Thinking in Urban Planning , Cultural Geographies 3 (1996), pp. 249–281, (doi:10.1177/147447409600300301).
- Söderström, O. , 2000. Des images pour agir: Le visuel en urbanisme . Lausanne: Payot Lausanne Nadir; 2000.
- Wiberley, S. E. J. , 1980. Editing Maps: A Method for Historical Cartography , The Journal of Interdisciplinary History 10 (3) (1980), pp. 499–510, (doi:10.2307/203191).
- Wood, D. , 1987. in the Idea, The Atlas as Narrative Form , Cartographica: The International Journal for Geographic Information and Geovisualization 24 (1) (1987), pp. 24–46, (doi:10.3138/3163-659Q-J502-W858).