Abstract
This paper develops the notion, and demonstrates the use, of ‘demographic sustainability’ in updating the national policy for rural development in northern Israel. The current national master plan defines a maximum growth size allowed for each settlement in both the urban and the rural sectors. The growth size policy is solely based on geo-political considerations. Although, aggregatively, the northern rural periphery still has a large population absorption capacity, the overall policy does not fit to the local potential and the individual needs and wills of many settlements. The wide literature on rural development points out that the heterogeneous character of the rural areas dictates a differential and flexible policy allowing its implementation according to the individual various physical, demographic, institutional, cultural, and geo-political conditions. Israel's northern rural periphery is not excluded in that regard and therefore, its settling authorities were looking to update the rural development policy. A GIS-based spatial search and mapping procedure was developed to identify and map the settlements in rank order of intervening needs in population policy. The procedure is focusing around three pivots: accelerators, limitations, and opportunities. Accelerators are the main reason for policy update and include the individual levels of demographic sustainability and relative free absorption capacity of each settlement. Demographic sustainability is defined by the type and the size of the local ‘dependency ratio’ in order to ensure a multi-age structure and generational continuity of rural settlements in the national periphery. Limitations include environmental sensitivity to development and large absorption capacities. Opportunities include small absorption capacities and favorite conditions for settlement clustering. A three-stage sieving procedure, according to the three pivots, enabled to produce a final map showing, in a descending-order, the need for policy intervention of each settlement. Practically, the map exhibits the role of demographic sustainability in directing the development policy in a, most frequently, losing-population rural region.
1. Introduction
In 2005 Israel's National Master Plan 35 (NMP 35; CitationAsif, Shachar, & Malis, 2005) has been approved by the national planning council, thus becoming the 2005–2025 statutory policy guide for the country. The plan proposes five spatial textures of which two are development-oriented (both urban and rural) and three are preservation-oriented (rural, open-spaces and coastal areas). Rural settlements located in both types are limited to a maximum growth size which simply equals the official statistical definition of a rural settlement and variations up to this maximum are solely based on geo-political considerations. Although, aggregatively, the rural periphery still has a large population absorption capacity, the overall policy does not fit to the local potential and the individual needs and wills of many settlements. The wide literature on rural development (e.g. CitationAntony, 2004; CitationBryant & Russwurm, 1999; CitationConyers, 1985; CitationTerluin, 2003) points out that the heterogeneous character of the rural areas dictates a differential and flexible policy allowing its implementation according to the individual various physical, demographic, institutional, cultural, and geo-political conditions. Therefore, the settling authorities in Israel were looking to update the national rural development policy, regardless of the large population absorption capacity, and to base it on the individual needs and situations of the rural settlements.
This paper introduces this effort while developing the notion, and demonstrating the use, of ‘demographic sustainability’ in updating the national policy for rural development in northern Israel. The final outcome is a map showing, in a descending-order, the need for policy intervention of each settlement. Practically, the map exhibits the role of demographic sustainability in directing the development policy in a, most frequently, losing-population rural region.
2. The general approach
Northern Israel is the main leisure escape of the country. Environmentally, it is a sensitive area, highly diversified, physically and human wise, and its rural settlements support both its agricultural and tourism activities. The settling authorities want to ensure, simultaneously with environmental conservation, the socio-cultural diversity of the regional population by allowing a sustainable process of population growth. Such a growth should enable a continuous multi-age distribution of the local population in order to achieve demographic sustainability, which is actually a multi-generational continuity. Despite the importance of demographic resources of rural areas as the basis for sustainable development, population has been neglected in related spatial planning tools and measures (CitationRoca et al., 2002). Development agents perceive much more frequently population groups only as beneficiaries and rarely as the active stakeholders, sometimes pivotal for sustainable rural development (CitationRoca, 2000). The achievement of demographic sustainability, and thus sustainable rural development, requires individual interventions in the growth process of the rural settlements.
A GIS-based spatial search and mapping procedure was developed to identify and map the settlement in rank-order of intervening needs in the population policy. The procedure is focusing around three pivots: accelerators, limitations, and opportunities. Accelerators are the main reason for policy update and include the individual levels of demographic sustainability and the relative free absorption capacity of each settlement. Demographic sustainability is defined (as detailed later) by the type and the size of the local ‘dependency ratio’ in order to ensure a multi-age structure and generational continuity of the rural settlements in the study area. Small statutory absorption capacity is also considered as an accelerator to external intervention as it blocks local growth. Limitations include environmental sensitivity to development which usually involves settlement expansion into the open areas, and large statutory absorption capacities which do not justify intervention in the existing policy limitations. Opportunities include small absorption capacities (seen also as an accelerator) and favorable conditions for settlement clustering which might allow local economies of scale. A three-stage sieving procedure, according to these three pivots, enabled the production of a final map showing the need for policy intervention of each settlement.
3. Methodology
3.1 The study area
The GIS-based search procedure was applied in Israel's northern periphery, the Galilee region. It covered 16 regional councils, including 347 settlements with a total population of 216,744. The settlements include 121 agricultural villages (Moshavim), 135 commune-type of settlements (known as Kibbutzim), 62 community-type of rural settlements, and 29 Israeli Arab villages. The search procedure was based on the components of the three pivots as described below.
3.2 Defining the demographic structure
Demographic sustainability can be achieved only by preserving a time-stable, bell-shaped, age distribution. It is usually understood as a constant population level related to an optimal growth rate of population, corresponding to at least 2.1 fertility rate (CitationCamarinha-Matos & Afsarmanesh, 2010). Another perspective of demographic sustainability is given by the relationship between working age and old population. Therefore, deviations from a bell-shaped age distribution towards aging, can justify an external intervention in order to accelerate local demographic revival. The need for demographic revival is thus defined by the type and the size of the local ‘dependency ratio’ which exhibits the ratio between the youngsters (ages 0–18) & the aged ones (over 65), and the rest of the (working) population (ages 18–65). Demographically, the possible ratios between the dependent population (ages 0–18 + > 65) and the ‘supporting’ population (18–65) indicate the local age structure and its demographic development trend. serves as a guide to calculate the demographic structure of each settlement. For example, if in a certain settlement the relative weight (in %) of the 0–18 age group is larger than the equivalent regional weight and the relative weight of the 65+ age group is smaller than the equivalent regional weight, then the local population is defined as ‘young’. The main possible ratios presented in show that young settlements are characterized by a ‘normal’-shaped age distribution with a wide base of young people and a narrowing head of older generations. Without population growth, the relative percentage of the ‘supporting’ population decreases and the age distribution reflects relatively high percentage of dependent population. With no further entry of young population, the relative weight of the youngest and the oldest decreases with a simultaneous relative increase of the middle-age residents. Finally, the whole settlement is getting older as reflected by the resulted inverse age pyramid. This process exemplifies the need for demographic revival as shown in . A proper social planning of housing and population may prevent, or at least slow down, the demographic structural change, thus keeping a stable age structure to ensure demographic sustainability.
Figure 1. Demographic structure and its stages of development.
3.3 Estimating the relative free absorption capacity
According to the current national policy, the free absorption capacity is the maximum statutory potential for local growth. It is the gap between the actual population size and the maximum growth limit as defined by the national plan. For agricultural settlements the maximum settlement size varies between 300 to 500 dwelling units. For non-agricultural, community-type settlements in the rural areas, the national policy defines the maximum local growth as 2.2 times the 1995 population. The official population data (CitationCentral Bureau of Statistics, 1995, Citation2011) was used, accordingly, to calculate the free absorption capacity. For verification,the results were compared with a parallel examination recently done by an official monitoring team (CitationTurel, Cohen, & Kaplan, 2010). However, since we assume that demographic sustainability can be achieved in both small and large settlements, the free absorption capacity must also relate to the existing local population. The larger the population, the larger are the age cohorts. In order to achieve demographic sustainability, larger settlements will need larger free capacities than smaller ones. Therefore, the relative free absorption capacity is calculated (free capacity/total dwelling units). When this ratio is low, it is an accelerator for demographic intervention and when it is high, it is a limiting factor.
3.4 Estimating the environmental sensitivity
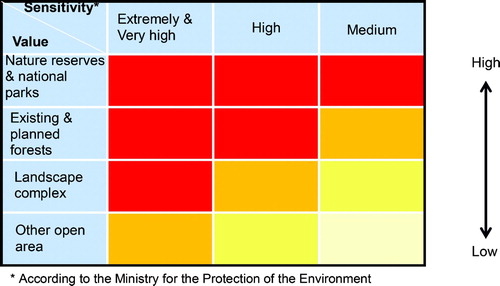
External intervention in the local development of a given settlement can force a territorial expansion which might potentially affect the surrounding environment. Therefore, environmental sensitivity to development is a limiting factor. Sensitivity to development combines both environmental value and environmental sensitivity. Environmental value is reflected by the current statutory land uses as arranged, in a descending order, from ‘nature reserves and national parks’ to ‘other open spaces’ (see ). The sensitivity is based on the spatial categorization as defined by the Israeli Ministry of the Environment. The cross-classification of the environmental value and sensitivity levels enabled to classify each settlement into one of the four categories shown in .
Figure 2. Evaluation matrix of environmental sensitivity to development. The darker the color, the higher is the sensitivity to development.
3.5 Searching the potential for settlement clustering
The potential for settlement clustering is an opportunity to increase the socio-economic threshold for improving the social and commercial services in a relative sparsely populated area. The clustering enables the provision of services to all age groups, and is especially important when targeting to demographic sustainability in such an area. The search for such potential clustering was based on the GIS buffer module. Since the module operates in a two-dimensional space and the area is mountainous, the system first categorized the settlements by their topographical height in order to prevent distance distortions. Then, the clustering of the settlements was examined by varying radii. As explained below, this procedure was, applied only to settlements found in the two top categories of the aggregated scores of high intervention need and low environmental sensitivity.
3.6 Final ranking
The final ranking relates only to those components contributing to the need for policy intervention. Accordingly, it is the aggregated score of the ‘need for demographic revival’, the ‘relative free absorption capacity’ and the ‘environmental sensitivity to development’. Since there was no point to examine the potential contribution of clustering for low-scored settlements, the final mapping included the clustering contribution of only those found in the two top categories of the aggregated scores.
4. Results
At the aggregate level, the agricultural settlements in the Galilee have lower rates of youngsters (32.0%) than the national average (35.7%) as well as lower rates of elderly (7.7% versus 9.7% nationally). Out of the 347 settlements, almost third (32.6%) demographically are defined as ‘young population’ but 34.3% are defined as ‘old population’ (). Among the agricultural settlements 26.5% have ‘young population’ structure (much lower than the national average) and 37.1% have ‘old population’ structure, much above the national average. Clearly, the majority of the rural settlements are characterized by an aging demographic structure. Accordingly, demographic intervention is needed in 119 settlements of which 95 are agricultural settlements, 16 are community settlements, and 8 are Israeli-Arab settlements.
Table 1. Distribution of the Galilee settlements by type and demographic structure.
As for the free absorption capacity, it was found that 20 settlements (about 6% of the total) have no free capacity at all, and 126 additional settlements (36.3% of the total) have free capacity which does not exceed 50% of the existing number of dwelling units. However, when taking into account the existing population size, there are 89 settlements with a relative free capacity smaller than 50%. Thus, the current development policy not only restricts the growth of 25.6% of the settlements, but also does not allow them to become demographically sustainable. It should be noted that prevention from demographic sustainability can be relevant to settlements which have relative capacities exceeding 50% as well.
The distribution pattern of the settlements with regard to environmental value and sensitivity reveals, as expected, that 70% are located in highly sensitive areas while only 9.8% are located in low value and sensitivity areas. Since there is a direct association between environmental sensitivity and the statutory spatial textures of the national plan, for policy updating, it was important to examine the clustering potential in relation to these five planning-policy textures. The results show that clustering is currently possible, in different mixes, only among 13 settlements located in the ‘rural’, development-oriented texture. There are, however, 35 settlements with clustering potential located in conservation-oriented textures which do not allow any expansion or clustering. These opportunities became a matter of policy change.
Finally, mapping the need for policy and development intervention, using the aggregated score, revealed 57 settlements in the highest score category () from which 42 are kibbutzim (communal, agricultural settlements) and only six are moshavim (agricultural settlements). Apparently, all are veteran settlements which have already passed through all the stages of life cycle, they are thus, relatively large communities with, consequently, small free absorption capacities. Being mainly agricultural they are located at the foothills of the mountainous core of the Galilee, obviously in less environmentally sensitive areas. The young settlements are smaller, mainly located in the mountainous, environmentally sensitive areas, having relatively higher free absorption capacities.
Table 2. Distribution of the Galilee settlements by type and the need (aggregated score) for policy and development intervention.
5. Conclusions
The map showing both the need for policy update and the need for demographic intervention in the development process of rural settlements, exhibits a typical project of applied geography focusing on spatial search. It contributes to the notion and the definition of demographic sustainability as a major accelerator for the update of a national policy trying, in general, to protect the amount of open areas without considering the individual differences of settlements and their needs. The results support the rationale behind the general policy adopted by western societies, dictating a differential and flexible policy according to individual settings and conditions.
Apparently, relatively large veteran rural settlements usually have an ‘old population’ demographic structure and due to their size, in accordance to the current national policy, they have a small relative absorption capacity which prevents, or at least postpones, further development or revival. The relative free absorption capacity should thus be considered as an important parameter to policy update, as well as the need for demographic revival. On the basis of these conclusions, recommendations were sent to the monitoring and updating team of the national master plan.
Software
Microsoft Excel 2003 was used for data collection and initial manipulation. ESRI Arc GIS Desktop 9.3.1 was used for building the GIS database for all the components of the three pivots and all the mapping, from which the final PDF map was exported.
Main Map: Demographic Sustainability and Rural Development Policy
Download PDF (1.3 MB)Acknowledgments
The author would like to thank Arch. Nina Rabinovitz for her assistance with the data manipulation and mapping as well as to the Settlement Division of The Jewish Agency for the financial support.
References
- Antony , J. 2004 . Do state growth management regulations reduce sprawl? . Urban Affairs Review , 39 ( 3 ) : 376 – 397 . (doi:10.1177/1078087403257798)
- Asif , S. , Shachar , A. and Malis , N. 2005 . Land – National master plan 35 , Jerusalem : Ministry of the Interior .
- Bryant , C. R. and Russwurm , L. H. 1999 . North American farmland protection strategies in retrospect . Geojournal , 6 ( 6 ) : 501 – 511 . (doi:10.1007/BF00425313)
- Camarinha-Matos , L. M. and Afsarmanesh , H. 2010 . Active aging roadmap – A collaborative networks contribution to demographic sustainability . IFIP Advances in Information and Communication Technology , 336 : 46 – 59 . (doi:10.1007/978-3-642-15961-9_5)
- Central Bureau of Statistics. (1995). Statistical abstract of Israel 1995, No. 46. Jerusalem.
- Central Bureau of Statistics. (2011). Statistical abstract of Israel 2011, No. 62. Jerusalem.
- Conyers , D. 1985 . Rural regional planning: Towards an operational theory . Progress in Planning , 23 : 1 – 66 . (doi:10.1016/0305-9006(85)90010-8)
- Roca , M. O. 2000 . EU policies and development – Stakeholders at the local level , Scotland , , UK : The Case of the Lima Valley, European Rural Policy at the Crossroads, University of Aberdeen .
- Roca, M. O., Silva, V., & Caldinhas, S. (2002). Demographic sustainability and regional development: The case of Alto Minho and Alto Alentejo, Centro de Estudo de Geografia e Planeamento Regional, Universidad Nova de Lisboa, Portugal.
- Terluin , J. I. 2003 . Differences in economic development in rural regions of advanced countries: An overview and critical analysis of theory . Journal of rural studies , 19 ( 3 ) : 327 – 344 . (doi:10.1016/S0743-0167(02)00071-2)
- Turel , Y. , Cohen , M. and Kaplan , M. 2010 . National master plan 35 – Monitoring and updating , Jerusalem : The Planning Division, Ministry of the Interior .