Abstract
Housing Market Analysis is a form of demographic research that seeks to unpick relationships between the supply of properties and the demand of households. Such analysis can be used for planning for future residential development. While econometric-orientated analysis dominates much of this research, a sub-discipline also exists that recognises that there are inherent geographies within these relationships, and that these geographies can therefore be mapped. This paper details the processes behind such a venture, beginning with the creation of a geographical framework detailing housing supply for Sydney, Australia. A demand dynamic is added to this framework using analysis of intra-regional migration. With the two elements combined, key relationships are identified, which form the basis of a brief discussion on the findings as they relate to activity within Sydney's housing markets.
1. Introduction
This paper and accompanying map presents two approaches applied to develop and communicate a set of Housing Market Areas (HMAs) for Sydney (Australia). HMA geographies represent an attempt to reflect locations of common housing supply and demand. Such geographies can be used to foster a better understanding of the dynamics of demand and supply for urban planning purposes. While there is substantial literature on approaches for this form of demographic analysis, this paper advances three developments which seek to extend both the theoretical and methodological underpinnings of their creation and also the means by which they can be utilised and communicated.
The theoretical development of the HMA analysis and its application takes as its basis CitationMcMaster and Watkins (2006) observations concerning the underdetermination of econometric methodologies for housing market analysis. By adopting this position, the paper advances the observation that geography matters and, more overly the specifics of geography matter more (CitationDear, 2005; CitationSassen, 2009). To build this geography the methodology adapts migratory orientated approaches to analyse housing demand (CitationHinks & Wong, 2010; CitationJones, 2002; CitationMaher, 1995) by contextualising these within the geography that they operate. To do this two separate geographies are created, Housing Market supply Areas (HMsAs) and Housing Market demand Areas (HMdAs).
The first methodological development is the application of two recent technical advances in spatial data analysis. A Full-Order-CLK regionalisation approach using REDCAP (CitationGou, 2008) is first applied to create the HMsAs and then GraphREDCAP (CitationGou, 2009) is used to construct HMdAs based on areas of common intra-regional migration. The final methodological extension is the communication of the general housing profile of the HMsA geography using a trivariate colour composite approach and the visual association of these with the HMdA geography. This approach provides the basis for the main map supplied with the paper.
The paper proceeds in the following manner. Section 2 sets out the rationale behind the research. Section 3 sets out the broad theoretical concepts used in the creation of housing market geographies. Section 4 provides an overview of the regionalisation process used to generate an HMsAs, the data used and the general conditions applied. Section 5 introduces an element of demand using migration analysis to build the HMdAs. A brief assessment of the utility of the method as a tool to consider housing market interaction is then conducted for means of discussion, Section 6, leading into the final section outlining conclusions and next steps.
2. Research conditions and parameters
This paper presents part of an ongoing research programme developing methodologies to consider and analyse housing demand for the purpose of long-term strategic planning. The programme itself is funded by the Australian Research Council and is a joint collaboration between the research team at the University of New South Wales and the New South Wales Department of Planning and Infrastructure (DPI). While a substantial component of the ongoing research has been conducted utilising in-depth survey and focus group work (with both purchasers and renters), it was first necessary to identify just where within the city such research activity could be targeted.
Sydney, as with other capital cities in Australia, has a historical housing supply model predicated on suburban expansion (CitationBadcock & Beer, 2000; CitationParis, 1993). This mode of urban development is similar in many ways to that of North America with neighbourhoods of single, detached homes over 50 km from the city centre. However, unlike many North American cities, the presence of these peri-urban locations do not go hand in hand with the declines in demand as seen in the ‘first Suburbs’ (CitationPuentes & Warren, 2006) of Dallas, Delaware and San Diego (to name a few); Sydney's existing urban area is live with other dynamics. Suburban renewal produced through dynamics such as Knock-Down-Rebuild (CitationPinnegar et al., 2010) represents one of these. Development driven by planning directives shaped by a sustainability discourse stressing urban consolidation (CitationSearle, 2004) and responding to an assumed demand generated by a growth in smaller households represents another.
Adding to this complexity is the fact that the residential construction industry in Australia has no culture of speculative building (CitationBurke & Hulse, 2010). Typically, private sector developers will endeavour to source a substantial amount of the capital needed before beginning construction by selling ‘off plan’. Such activity in the expansionary suburban mode of supply enables the industry to scale back or ramp up development based on the numbers of houses that can be sold during this initial period. However, as greater emphasis is placed on developers to build more consolidated forms of attached property supply (such as townhouses and apartments), this mode of financing hits some difficulties. While in the suburban mode lots can be left undeveloped if no demand can initially be sourced, in the consolidated mode whole developments cannot get going until such financial thresholds of demand are met.
The drive for consolidation is part in response to the dwindling supply of available land and is supported by the distinct regard for consolidation in the current planning strategies. Together these have focused the attention of the DPI on existing urban locations. Such locations are composed of detached single dwellings produced under the historical mode of housing supply. Whilst reaching a level of stock obsolescence (through aging) such locations are also alive with the piecemeal (and household led) renewal as described previously. These locations have been termed ‘Greyfield’ (CitationNewton, 2010): ‘[t]hey typically occur in a 5–25-km radius of the centre of each capital city and are service-, transport-, amenity- and employment-rich compared to the outer and peri-urban suburbs’ (CitationNewton, 2010). One of the main limitations on redevelopment occurring in such locations is that private households hold land on an individual lot level. Whilst these households may, in time, cease to exist (either through outmigration or natural aging) this still leaves a fragmented patchwork structure of smaller lots which, as single units, cannot be readily utilised for higher density or consolidated property forms.
Central government agencies are amongst the best-placed organisations to begin to amalgamate such fragmentation into viable sites for the residential construction industry to begin to develop. However, returning to the observation of Burke and Hulse (Newton, 2010, such viability is also embedded in the ability of developers to source enough demand to begin building in the first place. Therefore, with limited financial resources and the need for a level of political accountability comes the necessity to evidence, or at least provide reasonable assurance that, such amalgamation activity is being targeted at areas where it is most viable.
This final point neatly underscores the necessity for the research output to be relatively accessible and understandable to a broader audience. Cartographic style outputs of geographic analysis form one way to communicate such decision-making processes through relatively accessible devices that stress visualisation over other forms of dissemination (CitationDorling, 2012). With the addition of more local knowledge, such as those embedded within professional agencies working in similar fields, such information can then in turn be interrogated in order to generate further knowledge or wisdom (CitationRae, 2011). With the scope of the research in place, the following section seeks to sketch out some of the main considerations necessary before applying the analysis.
3. Housing market dynamics
‘The evidence suggests that submarkets are important and that, rather than being based exclusively on the similarity of property characteristics or geographical contiguity, the dimensions of housing markets are determined by both spatial and structural factors simultaneously’ (CitationWatkins, 2001).
The market for housing, as with any tradable good or service, comes in two dimensions, those relating to the demand side and those to the supply side. However, housing's role as one of the ‘unique goods’ (labour being the other) introduces the need to consider the role location plays in influencing these two dimensions. With reference to the observation made by Watkins, these underlying dimensions are both spatially variable and conterminously fixed. Therefore, in order to visualise these dimensions it becomes imperative for the research to identify key facets of these dynamics that can be utilised for mapping purposes.
Supply-side geographies are concerned with price and attribute profiling. Extensive research on the formative components of housing cost can be found in the econometric property market literature, especially the utilisation of hedonic house price modelling (CitationOrford, 1999). Whilst these methodologies are implicitly (and increasingly) spatial in their approaches (Bitter, Citation2007) they typically treat location as a proximate defining element, the distance to a high performing school or accessibility to key sites of employment, for example. The utilisation of space in this manner can develop further knowledge on the formative aspects of price; however, a twofold criticism has been levelled at hedonic-based analysis as privileging value as the only assessable metric (CitationMcMaster & Watkins, 2006).
The first of these criticisms stems from the application of distance to assess the influence of local amenity or infrastructure on value; specifically assumptions made with consideration to underlying theories of unitary price or access-space trade off models. At their core, econometric models posit that within a market area all property forms hold a constant base price. Variations between prices in a market area occur because of premiums achieved due to factors arising from improved location, generating a differentiated price surface. However, to achieve this assessment, econometric modelling must first attribute assumed levels of influence to differing locations within the market area; essentially creating a conceptual geography of locations that may influence the price surface. A key example of this activity stems from the research of CitationAlonso (1964) and CitationMuth (1969) who developed models ceding land value primacy to the Central Business District. From this they observed that price declines away from these locations represented the willingness (or otherwise) of households to access cheaper housing but at the cost of longer commuting times, the core of the access-space trade off model. Whilst such methodological approaches have been developed over the intervening 40 years to incorporate multiple locations of employment (CitationRichardson et al., 1990) amongst others, they nevertheless retain underlying assumptions based on research into the geography of North American cities almost half a century ago.
The tension this creates is between the application of assumed roles and influences of locations and how these actually manifest in specific city contexts. In turn, this produces underdetermination within supply-side geographies generated using such approaches. Variances between prices that cannot be explained by the underlying model are subsequently utilised to test and reassess assumptions concerning the influence of locations; however, the underlying assumptions (particularly access-space) are themselves not questioned.
In the context of this research, the methodological generation of supply-side geographies should therefore attempt to develop an understanding of the locational specifics first, rather than assumptions or finessed models based on different contexts. Such observations on the importance of specifics are supported by CitationDear's (2005) comparative analysis of Chicago and Los Angeles and CitationSassen's (2009) observations concerning the influence ‘deep economic history’ (p. 8) has in shaping distinctly unique urban geographies across the globe. To this end, the approach needed to build the supply-side geographies is one that should capture the essence of supply within context; however, it should stop short of attempting to justify observed price profiles.
The second criticism levelled at value-orientated assessments is that they provide little in the way of understanding of how a property is utilised and by whom. This is a key area of necessary knowledge for planning purposes, leading to McMaster and Watkins' observation that ‘… some accurate description of social processes, as opposed to a potentially fruitless endeavour to quantify this [the value of a property], may be seen as an important explanatory avenue’ (CitationSassen, 2009).
Demand-side geographies offer one means by which to explore social processes. They can be generated through analysis, mapping and projections of demographic data sets such as those collected through Census techniques (CitationYates, 2002; CitationDTZ Pieda, 2004 – for example). To this end, such geographies typically represent the demographic trends at work within the city or regional context. Methodologically, these types of demand side geographies co-opt long-held practices derived from social area analysis (CitationRobson, 1969; CitationShort 1984).
Whilst forms of social area analysis differentiated by housing type and tenure patterns can provide insight into current utilisation, they come encumbered with issues such as the ecological fallacy (CitationRobinson, 1950/2009) and modifiable areal unit problem (CitationOpenshaw, 1983). In the context of housing research, such issues are wrapped up in the potential for multiple household forms to coexist within fixed neighbourhood locations creating a spatially discontinuous (CitationRandolph, 1991;CitationRandolph & Tice, 2012) patchwork of demand. Attempting to frame housing demand in terms of static demographic profiles and their relationship to property utilisation can therefore be hampered by a two-fold risk.
Firstly, concentrating on observed patterns tends to privilege the dominant profile within any location. In turn, this can suppress the influence of smaller population groupings. With relevance for the research are the relationships between existing patterns stemming from the historical suburban profile and those arising trough consolidation strategies. Secondly, even if the main profiles within a location are the de facto profile of demand, there is little way in which to consider the relationship of these within a broader context. Housing demand rarely arises (and is met) within the same exact location. Suburbs and neighbourhoods may individually offer forms of property more tailored to specific profiles; however, a matching of demand and supply is largely dependent on the movement of households to locations where their housing demand can be realised. With this two-fold risk in mind, one of the key objectives for generating the demand-side geographies becomes the need to utilise a certain level of dynamism within the methodological approach. Specifically, the methodology needs to be able to reflect both current property utilisation and at the same time be able to relate such demand to locations within the market area where it came from. Being able to relate locations to each other within the context of housing demand and supply could be considered as one of the primary objectives, and indeed linchpins, for the future development of sustainable housing markets.
Consideration of demand dynamism as observable interactions derived from analysis of migration data has been demonstrated to have considerable utility for housing market research (CitationCoombes & Champion, 2006; CitationHincks & Wong, 2010; CitationJones, 2002; CitationJones, Leishman, & Watkins, 2004; CitationMaher, 1995). Essentially, such approaches adapt and extend social area profiling by identifying groupings of areas that contain amalgamations of intraregional migration based on shared origins and destinations. However, whilst such research provides a useful starting point for the consideration of demand dynamics, little has been done to aid the deliberation of such relationships within the milieu of supply. Furthermore, the ability to consider relationships within the context of how demand is currently utilising supply is lacking. Returning to the point made previously concerning the development of sustainable housing markets, such considerations need to be able to understand current demand-supply interactions within the context of longer-term exchanges. The length of this paper offers little scope to begin unpicking the minutiae of such longer-term exchanges. However, a couple of theoretical positions can be co-opted to broadly frame the goals for the research.
The first stems from the connection that can be made between the direct observation of intraregional mobility and analysis concerning life-stage (CitationMurie, 1974) or pathways (CitationClapham, 2002) through the broader housing market. Since these relationships, as realised through local housing market supply, are constituent components of a location's profile, the general theoretical position presented is that this linking dynamic is embedded within intraregional migration patterns between housing supply.
The second position develops from an understanding of local housing market functionality set out by CitationClark and Huang (2003), specifically, that a housing market system consists of ‘… [A]reas, or groups of areas, that contain enough options to enable choice to be made without sacrificing other Locational factors’ Citation(Clark & Huang, 2003). This observation provides the basis by which to relate patterns of intraregional migration to those of underlying supply. The intersection of these two dimensions needs to be sufficiently reflective of current interactions whilst containing the ability for such choice to be exercised. Again, the ability to consider such interrelations, it is suggested, provides the ability to identify, work with and strengthen existing relationships where they currently operate. In doing so, the ability to strategically plan future housing supply may further be strengthened.
The two dynamics of supply and demand can now be reduced to a set of underlying rules for the purposes of generating visualisations:
| 1. | Housing Market supply Areas (HMsAs) – captures the main profiles of where people are moving between, tempered with the ability to reflect the potential for local choice; | ||||
| 2. | Housing Market demand Areas (HMdAs) – captures the main dynamics of how people are moving around. | ||||
With this rule set in place, the following two sections of the paper set out the methodologies utilised to generate the constituent elements, starting with HMsA geography.
4. Setting the frame – housing market supply areas
The following sets out the methodology utilised for the identification of the Housing Market supply Area geography of Sydney. Reflecting on the theoretical underpinnings of the geographies set out previously, these need to be hybrid composites of a collection of properties that share common locational features balanced, where possible, by comparable underlying prices.
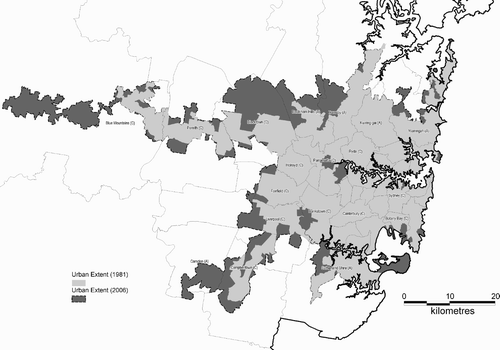
A difficulty this raises in the Australian context is that well over 80% of the Australian population now live in Urban Classified Locations (assessed by the Australian Bureau of Statistics as contiguous Collector DistrictsFootnote1 containing concentrations of populations over and above 200 people per sq km) and just over 18% of the total population live in the UCL of Sydney (CitationABS, 2006). This definition of Sydney raises an overarching question of scale as, through its construction, it overlaps and interpenetrates pre-existing Governmental structures. The 43 Local Government Areas (LGAs) that currently straddle this urbanised extent perform a loose amalgamation of governmental services (including applying local planning frameworks), but, critically, no single entity exists that can provide guidance and oversight. Whilst the DPI, as a state agency, explicitly engages with policies directing the urban form, the specific boundary that comprises this shifts and alters over time (see ).
Figure 1. Sydney urban extent, 1981 and 2006 and current local authority boundaries.
This point returns to the issues raised in Section 3 concerning underdetermination, as it relates to the underlying geographical dispersal of housing supply. Defining such geography with either the metropolitan extent or the LGA boundaries as the initial frame of reference could suppress the incidence of supply areas that either straddle or operate discretely within pre-existing boundaries. Similar observations have been made by both Jones (Citation2002) and Leishman (Citation2009) from a demand-side perspective, so it would appear logical to offer the same treatment to the HMsA geography as well. Therefore, instead of starting with a physical demarcation of Sydney (derived either through governmental structures or the UCL approach) the net should be cast wider and an understanding gained of the extent of the geographical spread of the city's HMsAs. Such an approach, intuitively, calls for the use of finely grained data in order to detect the presence of both straddling and discrete forms.
The use of finely grained data, however, presents a secondary problem. We would expect unique profiles to exist at the finely grained level; however, as these are amalgamated the profiles will become increasingly heterogeneous in nature. This is an unavoidable problem if the geographies represented are going to be utilised in a pragmatic manner; for example, as a device to both target survey activity and analyse returns. Balancing the need on one hand to be representative of locations but on the other not to be so mired in minutiae can be seen to be largely a subjective task (just how many submarkets are necessary?), but also one that raises further considerations concerning operation. For example, such pragmatism also reiterates the potentially beneficial facet of (broader) functionality namely the ability of households to move within spatial situ. An area of relative stock heterogeneity, but also underlying price homogeneity, may well be representative of a submarket location providing both entry points to those who can afford it and also a means to trade up within the same relative locations on a life-stage basis. Returning to a theoretical basis of housing sub-markets set out by Clark and Huang (Citation2003), this can be seen as a relatively socially sustainable merit of specific submarket structures, namely that they can offer housing options for a wider socio-economic base than would be expected of locations with stock and price homogeneity.
To decide on which variables to choose in order to build the HMsAs consideration needs to be given to fundamental (physical) facets of property form. A further rationale behind the selection of variables is that they should represent a basic profile coupled with an intrinsic relationship to societal interactions in order to relate to demand dynamics. Variables that represent common facets shared by all residential properties would appear to be a logical choice. Proximity to other residential properties is one such facet and price paid (either through mortgage or rental costs) is another. The first facet is commonly constructed as numbers of properties per square kilometre (CitationKulish et al., 2011) and can be used as a short hand for overall property form. Cost, constructed as price per square metre, has been demonstrated to be representative of wider urban process (CitationSpivey, 2008). Including such a variable in a reasonably simplistic manner also renders properties with different attributes (i.e. numbers of bedrooms), but sharing the same relative location characteristics, comparable.
Whilst the preceding two variables represent form, there is a need to relate these to utilisation. The Australian housing market is largely split between homeownership and private rental (social housing only accounts for 4.5% of total supply (CitationABS, 2006)), with an evidenced housing career (CitationKendig, 1984) from owner occupation (the parental home) to private rental (after initially leaving the parental home) and back into owner occupation. Whilst this trajectory has altered somewhat in the proceeding 20 years (CitationBeer, 2005) the distribution and availability of these two different tenure forms remain to shape and define underlying patterns of demand. It, therefore, becomes a necessity to include such a variable to derive the HMsA geography.
To attempt to balance these observations three composite variables were used to structure the underlying supply side geography in relation to density, cost and tenure. outlines these variables, the varying degrees of pre-processing necessary to produce a viable dataset and, where needed, any associated caveats.
Table 1. Variables used for regionalisation analysis.
The three composite variables were used as a basis for the REDCAP region-building algorithm (CitationGuo, 2008). Essentially this process looks for groupings of locations that share a common combined profile and demarcates these groups. Under review of the literature on REDCAP (CitationGuo & Wang, 2011) the settings used was the Complete-Linkage (CLK) with a local empirical Bayes Smoother (EBS). The CLK methodology as a stand-alone approach has been demonstrated to be the most successful under true positive tests and the addition of the EBS enables issues of low population numbers to be handled.
As with many data reduction exercises, the user subjectively sets the exact number of discrete profiles and some justification is necessary. In the geography presented the number of iterations was set at 50 (i.e. after the identification of the 50 distinct profile the algorithm ended), although this number was arrived at through an iterative deductive process. The base geography for the clustering process was the ABS Collector District (CD), some 1166 discrete areal units. An initial ‘top-end’ threshold was set at 20% of these (i.e. the regionalisation algorithm was set to end on the identification of the 233rd discrete spatial entity). Keeping in mind the utilisation of the HMsAs this ‘top-end’ threshold could lead to too many spatially defined cut points by which to meaningfully analyse survey returns. However, even at this ‘top-end’ threshold seven broad sub-regions were identifiable (), indicating that on the data provided the regionalisation process was unable to discern other areas of broad commonality within these larger regions. Where localised variation did occur subsequent analysis indicated that vast majority of these contained high levels of non-private dwellings (extra-care homes, prisons, hospitals and similar) or very small numbers of geographically isolated properties.
Figure 2. Seven broad HMsAs intersecting urban Sydney.
To ascertain when these seven broad HMsAs coalesced during the process the threshold was then set at 1% of the 1166 CDs (16 regions), 2% (23 regions), 5% (58 regions) and 10% (116 regions) levels. At the 1% level, the process only identified a few other major urban locations across the State with two HMsAs within the Sydney Metropolitan area. At the 2% threshold, two of the seven subregions remained combined, and between the 5% and 10%, the identification of highly localised phenomena described previously began to dominate the process. For presentation purposes, the final threshold was set at 50 (eight regions less than derived at the 5% threshold). The eight regions removed by this decision, on subsequent analysis, represented high concentrations of social housing supply. Social Rental, as flagged in the caveat to the tenure variable, should not be conflated with Private Rental due to the ‘extra-market’ (CitationBurke & Wulff, 2009) nature of this supply. To this end, the justification of the removal of eight sub-regions (to arrive at the 50 presented) reflects insight into the concentrated nature of this form of supply.
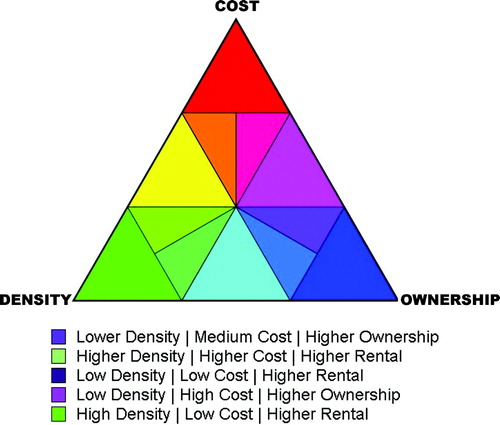
Whilst the profile of the 50 functional supply regions could be produced in a tabulated manner, detailing the specific mixing of the underlying variables, such an approach would move the analysis away from its desired aim to be able to communicate as much as possible in a visual manner. To this end, the main map provided with this paper has used a Red-Green-Blue (RGB) composite approach in order to give an overview of each area's underlying supply profile. A broad array of constitute colours can be defined by the amount that these primary colours contribute, and whilst the RGB model is widely used to display colours electronically, there is also solid theory predating these applications (CitationHunt, 2004). The contribution of each primary colour, for electronic representation, is based on a scale of zero (absolute absence) through 255 (absolute presence) where a combination of 0,0,0 represents black and 255,255,255 represents white. To achieve the colours represented, the Z-scores for each composite variable (Price, Density, Tenure) were converted into a scale running 0 to 255 (absence to dominance, or low to high) and assigned to each primary colour: Price to Red, Density to Green and Tenure (ownership) to Blue. sets out an example of how each combine and relates this to five of the actual colour composites achieved. The varying shades of purple represented in the overall map capture the dominant profile of the city's housing supply, a mixture of lower-density properties of varying cost and tenure combinations. However, within this, locations with distinctly different profiles can be observed.
Figure 3. Legend and example colour profiles achieved using RGB mapping.
The HMsA geography of Sydney has now been located. Mapping of the spatial extent and codifying of profiles has, by necessity, been abstracted and a certain level within the submarket (local) variability suppressed. However, it should be remembered that one of the underlying aims was the creation of an overview of the relationships that could be assessed relatively easily.
5. Populating the frame – housing market demand areas
With the HMsA framework in place the next step is to introduce the geography of demand. As discussed previously, the chosen methodology for this component of the research is deployed through the analysis of intraregional migration patterns. This comprises a two-step analysis, the first step attempting to identify areas within the city that function with higher degrees of self-containment in terms of origin and destination of movement, the second being the identification of the main trends within these areas of self containment.
The chosen approach to identify locations of self-containment utilises the GraphREDCAP suite of tools (CitationGuo, 2009) to build and spatially partition locations of similar flow-based interactions. Some of the processes are similar to REDCAP; however, the main difference is the level of considered linkages (numbers of persons, for example) moving between spatial units. For the purposes of the analysis the geographies used were the ABS's Statistical Local Areas (SLA) that, whilst relatively large in spatial extent (typically containing 30–60,000 persons), offer the greatest level of resolution available at which to consider these interactions.
Whilst GraphREDCAP enables population flows to be considered as absolute and net, it does not allow the assessment of control for variations in population size between areal units. This represents a potential limitation for the analysis given the stated variability in population sizes. A strong relational dynamic between two areas of smaller population sizes could be lost amongst those of a more sizeable nature. To work within this limitation, the intraregional migration data were pre-processed to calculate the flows as rates per 1000 persons.
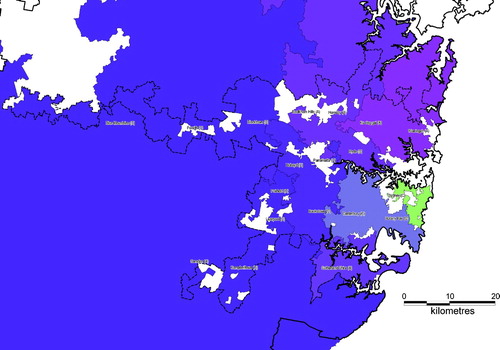
Working with these rates and setting a 70%, level of containment (based on the literature identified in Section 3) produces the HMdA geographies (). It should be noted that these general geographies of intraregional migration both intersect and overlap the HMsA geography. This finding in itself can be presented as partial justification for the treatment of the two dynamics as separate but not mutually exclusive.
Figure 4. HMdA geography.
For a test of the validity of these geographies the paper now returns to one of the initial conceptualisations of HMsAs, namely that they are representative of relatively bounded areas of shared activity. As stated at the outset, this paper has chosen to interpret such observations as suggesting not just a strict commonality in supply, homogeneity in stock or price. Specifically, the point being rearticulated is that HMsAs represent a collection of properties demarcating an area within which households can either trade up or trade down to suit various life stages. Such functionality enables the retention of relatively proximate relationships to the milieu of other locational interactions that comprise housing demand; proximity to friends, family, employment or other socially produced phenomena. To this end, how well does the HMdA geography fit with the HMsA?
To test for this capacity of households to alter property without sacrificing locational ties, the origins and destinations of the intraregional flows within the city were categorised in a 3-way manner:
| 1. | If occurring within the same HMdA and if they crossed over an internal SLA boundary; | ||||
| 2. | If they crossed between different HMdAs; | ||||
| 3. | If they crossed between different HMsAs (irrespective of if they were in or across any of the other two boundary sets). | ||||
To obtain the third characteristic, each SLA was attributed with the number of HMsA that they contained and each origin-destination flow was in turn attributed with these values.
provides an overview of these characteristics, and some of its key findings can be read as follows. Of persons moving within the same SLA (top row) just over half (54%) of moves occurred within SLAs entirely comprising the same HMsA. Further to this, note that this relationship is nearly the same (47%) for persons moving across SLA boundaries but within the same HMdA. Unsurprisingly, the same is not true for persons moving longer distances and those moving between HMdAs (third line in ).
Table 2. Movement within and between HMdA and HMsA (SLA composite) as percentage of total.
Of the remaining 49% (340,862 – a summation of the italicised values in rows 1 and 2 in ) of moves within the same HMdA, but potentially between different underlying HMsAs, the analysis cannot unpick the relationships of those occurring within the same SLA locations. However, the movement of over 70% (178,100 persons) of those moves occurring within the same HMdA but across SLAs containing at least one different HMsA can be analysed. The vast majority of these ‘within-across’ dynamics could be identified within 11 main flows, these form the basis of the discussion in section 6.
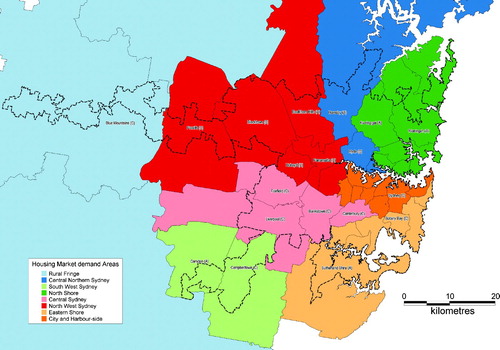
The main map supplied synthesises the HMsA and HMdA with these main flows. The thick black lines demarcate areas of functional demand. At least 70% of all moves starting within these areas also terminate within these areas. The arrow lines indicate main trends of movement within Sydney, the main dynamics operating within each HMdA and their HMsA of origin and destination.
6. Discussion – triangulating demand in the context of supply
The following section considers the main dynamics identified and places these in the context of a life-stage conceptualisation of housing market performance. sets out the 11 main flows identified in the main map and presented in the context of their relationship to underlying HMsA profiles. This is then utilised to frame the nature of these dynamics as they relate to housing market processes.
Table 3. Main flows and contextualised HMsA profiles.
Flows labelled 1, 6, 10 and 11 capture the role of the urban fringe (those representing the traditional mode of suburbanised supply) and its relationships to the rest of the city. It is evident from the analysis that these three locations function in distinctly different ways when the locations they draw demand from are assessed. The North West release area (termination of flows 10 and 11) is well provided for in terms of moves emanating from Parramatta. The Western release area (flow 6) still draws from a movement chain operating from within its own area of functional demand (flow 5). The South West release (termination of flow 1), at least in terms of its relationship to the rest of the city, draws demand from an isolated geographical area with no evidence of strong flows backfilling the initial pool of demand.
There is another noticeable pattern present within this geography, with the majority of the main flows overlapping locations of both higher density and lower density. This observation suggests that a large component of these moves may comprise persons moving from higher-density (and cheaper) property forms into surrounding low-rise suburban locations. Whilst this conforms to relative life-stage considerations of housing market dynamics, the point to stress is that the vast majority retain a relative proximity to their starting point.
Considering the nature of these relationships in terms of overall housing careers, the first dynamic is representative of younger family households moving out of apartments (where they have either been renting or initially purchasing) into houses. The second dynamic is representative of more established family households trading up into larger family homes. These two dynamics form the linchpin of overall housing market functionality: essentially driven by the trading up into larger property forms as families become larger and more established. The fact that the main flows and their relationships to the underlying supply dynamics reassert this should not come as any surprise. However, such dynamics generally do not cross between the broad geographies of demand outlined; less than a third of overall demand shifts occurred between different HMdAs. This final observation serves to underline the local nature of the majority of housing market processes.
7. Conclusions and next steps
This paper has set out to explore and visualise the main housing market dynamics in operation across Sydney (Australia). The basis for this research is grounded within the application of a housing market framework as both a means from which to identify areas for analysis and as a mechanism with which to contextualise findings. This approach (the map as the starting point and as a device to return to and populate) adopts the pluralist-pragmatist methodologies evoked by CitationHaack (1995, Citation2004) for social science in general and CitationMcMaster and Watkins (2006) for housing market analysis specifically. In doing so the methodology applied aims to engage with fundamental questions and ‘… judgements about appropriate location …’ (CitationMaher, 1995) of future property supply by considering contemporary spatial relationships. To enable broader accessibility of the findings the methodology has also sought to communicate these in a relatively straightforward and visualised manner.
However, whilst the research has enabled the dynamics of nearly 900,000 persons and their interactions with underlying supply to be reduced down to a few key visuals it has been done so at the expense of the activity and interactions generated by the near 700,000 additional persons who arrived in Sydney during the same period. Therefore, one missing component of the analysis relates to where and how these persons initially engage with the underlying HMsA geography.
Fortunately, this opens up the possibility to further extend the analysis. On a practical note, analysis of the specific interactions between areas of initial engagement and how these function in terms of underlying supply (interactions including newly built higher-density property forms, for example) becomes a logical first step. Do such locations link in and intermesh with the demonstrated HMdA relationships (for example, as a starting point for many of the main, within-area, trends set out in the main map) or are they discrete in their operational nature?
Coupled to this is the lack of any strong internally generated flows to the areas of higher density that represent the starting point for many of these housing careers. There is, potentially, the case to be made to develop a more robust understanding of where and how these locations are sourcing demand. Key areas of analysis could entail whether newer residents of these locations plan, in the future, to join the established out flows from such locations.
Such questions entail engagement with other approaches, notably more in-depth survey or panels, in order to test and assess the veracity of the observed relationships between the areas of different supply. Further to this (and in light of the pragmatic framework being operationalised) more nuanced forms of analysis can also, in turn, be used to inform on future reiterations of the quantitative analysis underpinning the HMdA creation – should different variable sets be deployed in different locations, should more onus be ceded to particular methodological approaches in one HMdA over another? Posing such questions and articulating their findings within the relational context of underlying structure, it is hoped, offers a fruitful approach for the balanced planning of housing supply.
Annex
A.1 Data and software
Open Office Calc for statistical data preparation and variable standardisation, available at: www.openoffice.org/;
REDCAP and GraphREDCAP Tools available at: http://www.spatialdatamining.org/;
QGIS Wroclaw (1.7.0) for thematic map setting and cartographic layout, available at: http://qgis.org/;
GIMP (GNU Image Manipulation Program (2.6.10)) for image processing and TIFF creation available at: http://www.gimp.org/.
A.2 Main map
Scale: 1 cm = 2.566 km
LL: 150O 28′ 50.25″/−34 O 11′ 21.84″ (UTM MGA94)
UR: 151O 29′ 42.36″/−33 O 34′ 22.88″ (UTM MGA94)
Area: 6870 km2
Main Map: Visualising Sydney's Housing Market
Download PDF (1.6 MB)Acknowledgements
This paper has benefited from the assistance of Dr. Crystal Legacy, Julia Dowling and three anonymous reviewers. Any wild or spurious claims or omissions remain the sole product of the author.
Notes
Collector Districts are the smallest geographical unit that the ABS uses for Census reporting. They typically comprise around 250 households and thus vary in absolute area depending on the density of residential properties.
References
- Alonso , W. 1964 . Location theory , Cambridge , MA : MIT Press .
- Australian Bureau of Statistics. (2006). Census of Population and Housing. TableBuilder (cat. no. 2065.0).
- Badcock , B. and Beer , A. 2000 . Home truths: residential property and home ownership in Australia , Melbourne : Melbourne University Press .
- Batten , D. C. 1999 . The mismatch argument: The construction of a housing orthodoxy in Australia . Urban Studies , 36 ( 1 ) : 137 – 151 . Retrieved from http://dx.doi.org/10.1080/0042098993781
- Beer, A. (2005). 21st Century Housing Careers and Australia's Housing Future. National Housing Conference. Perth.
- Bitter , C. Mulligan , G. 2007 . Incorporating spatial variation in housing attribute prices: A comparison of geographically weighted regression and the spatial expansion method . Journal of Geographical Systems , 9 : 7 – 27 . Retrieved from http://dx.doi.org/10.1007/s10109-006-0028-7
- Burke , T. and Hulse , K. 2010 . The institutional structure of housing and the sub-prime crisis: An Australian case study . Housing Studies , 25 ( 6 ) : 821 – 838 . Retrieved from http://dx.doi.org/10.1080/02673037.2010.511161
- Burke, T., & Wulff, M. (2009). Do submarkets exist in public housing? Research and Policy Bulletin, 121, AHURI, Melbourne.
- Clapham , D. 2002 . Housing pathways: A post modern analytical framework . Housing, Theory and Society , 19 ( 2 ) : 57 – 68 .
- Clark , W. A. V. and Huang , Y. 2003 . The life course and residential mobility in British housing markets . Environment and Planning A , 35 ( 2 ) : 323 – 339 . Retrieved from http://dx.doi.org/10.1068/a3542
- Coombes, M., & Champion, T. (2006). Migration and the division of England into local housing market areas. Paper presented at the 36th Annual Conference of the British and Irish Section of the Regional Science Association International. Jersey.
- Dear , M. 2005 . Comparative urbanism . Urban Geography , 26 ( 3 ) : 247 – 251 .
- Dorling , D. 2012 . The visualization of spatial social structure , Chichester : John Wiley & Sons .
- DTZ Pieda Consulting . 2004 . Housing market assessment manual , London : ODPM .
- Guo , D. 2008 . Regionalization with dynamically constrained agglomerative clustering and partitioning (REDCAP) . International Journal of Geographical Information Science , 22 ( 7 ) : 801 – 823 . Retrieved from http://dx.doi.org/10.1080/13658810701674970
- Guo , D. 2009 . Flow mapping and multivariate visualization of large spatial interaction data . IEEE Transactions on Visualization and Computer Graphics , 15 : 1041 – 1048 . Retrieved from http://dx.doi.org/10.1109/TVCG.2009.143
- Guo , D. and Wang , H. 2011 . Automatic region building for spatial analysis . Transactions in GIS , 15 : 29 – 45 . Retrieved from http://dx.doi.org/10.1111/j.1467-9671.2011.01269.x
- Haack , S. 1995 . Evidence and inquiry: Towards a reconstruction in epistemology , Oxford : Blackwell .
- Haack , S. 2004 . Pragmatism, old and new . Contemporary Pragmatism , 1 ( 1 ) : 3 – 41 .
- Hincks , S. and Wong , C. 2010 . The spatial interaction of housing and labour markets: Commuting flow analysis of North West England . Urban Studies , 47 ( 3 ) : 620 – 649 . Retrieved from http://dx.doi.org/10.1177/0042098009349777
- Hunt , R. W. G. 2004 . The reproduction of colour , Chichester : Wiley .
- Jones , C. 2002 . The definition of housing market areas and strategic planning . Urban Studies , 39 ( 3 ) : 549 – 564 . Retrieved from http://dx.doi.org/10.1080/00420980220112829
- Jones , C. , Leishman , C. and Watkins , C. 2004 . Intra-urban migration and housing submarkets: Theory and evidence . Housing Studies , 19 ( 2 ) : 269 – 283 . Retrieved from http://dx.doi.org/10.1080/0267303032000168630
- Kendig , H. 1984 . Housing careers, life cycle and residential mobility: Implications for the housing market . Urban Studies , 21 ( 3 ) Retrieved from http://dx.doi.org/10.1080/00420988420080541
- Kulish, M., Richards, A. et al. (2011). Urban structure and housing prices: Some evidence from Australian cities. Research Discussion Paper 2011-3, Reserve Bank of Australia.
- Leishman , C. 2009 . Spatial change and the structure of urban housing sub-markets . Housing Studies , 24 ( 5 ) : 563 – 585 . Retrieved from http://dx.doi.org/10.1080/02673030903082310
- Maher , C. 1984 . Residential mobility within Australian cities , Australian Bureau of Statistics .
- Maher , C. 1995 . Housing need and residential mobility: The mismatch debate in perspective . Urban Policy and Research , 13 ( 1 ) Retrieved from http://dx.doi.org/10.1080/08111149508551667
- McMaster , R. and Watkins , C. 2006 . Economics and underdetermination: A case study of urban land and housing economics . Cambridge Journal of Economics , 30 : 901 – 922 . Retrieved from http://dx.doi.org/10.1093/cje/bej002
- Murie, A. (1974). Household movement and housing choice: A study based on the West Yorkshire Movers Survey 1969. Occasional Paper 28, Centre for Urban and Regional Studies: University of Birmingham.
- Muth , R. F. 1969 . Cities and housing: The spatial pattern of urban residential land use , Chicago : University of Chicago Press .
- Newton , P. W. 2010 . Beyond greenfield and brownfield: The challenge of regenerating Australia's greyfield suburbs . Built Environment , 36 ( 1 ) : 81 – 104 . Retrieved from http://dx.doi.org/10.2148/benv.36.1.81
- Openshaw , S. 1983 . The modifiable areal unit problem , Norwich : Geo Press .
- Orford , S. 1999 . Valuing the built environment: GIS and house price analysis , Ashgate .
- Paris , C. 1993 . Housing Australia , Melbourne : Macmillan .
- Pinnegar , S. Freestone , R. 2010 . Suburban reinvestment through 'knockdown rebuild' in Sydney . Research in Urban Sociology , 10 : 205 – 229 . Retrieved from http://dx.doi.org/10.1108/S1047-0042(2010)0000010011
- Puentes , R. and Warren , D. 2006 . One-Fifth of America: A comprehensive guide to America's first suburbs. survey series , Washington , DC : The Brookings Institute .
- Rae , A. 2011 . Flow-data analysis with geographical information systems: A visual approach . Environment and Planning B: Planning and Design , 38 ( 5 ) : 776 – 794 . Retrieved from http://dx.doi.org/10.1068/b36126
- Randolph , B. 1991 . “ Housing markets, labour markets and discontinuity theory ” . In Housing and labour markets: Building the connections , Edited by: Allen , J. and Hamnett , C. London : Unwin Hyman .
- Randolph , B. and Tice , A. 2012 . Who lives in higher density housing? A study of spatially discontinuous housing sub-markets in Sydney and Melbourne . Urban Studies , forthcoming
- Richardson , H. W. , Gordon , P. , Jun , M. J. , Heikkila , E. , Peiser , R. and Dale-Johnson , D. 1990 . Residential property values, the CBD, and multiple nodes: Further analysis . Environment and Planning A , 22 ( 6 ) : 829 – 833 .
- Robinson , W. S. 1950/2009 . Ecological correlations and the behavior of individuals . International Journal of Epidemiology , 38 ( 2 ) : 337 – 341 .
- Robson , B. T. 1969 . Urban analysis: A study of city structure with special reference to Sunderland , London : Cambridge University Press .
- Sassen , S. 2009 . Cities in today's global age . SAIS Review , 29 ( 1 ) : 34
- Searle , G. 2004 . Planning discourses and Sydney's recent metropolitan strategies . Urban Policy and Research , 22 ( 4 ) : 367 – 391 . Retrieved from http://dx.doi.org/10.1080/0811114042000296308
- Short , J. R. 1984 . An introduction to urban geography , London : Routledge & Kegan Paul .
- Spivey , C. 2008 . The mills-muth model of urban spatial structure: Surviving the test of time? . Urban Studies , 45 ( 2 ) : 295 – 312 . Retrieved from http://dx.doi.org/10.1177/0042098007085964
- Watkins , C. 2001 . The definition and identification of housing submarkets . Environment and Planning A , 33 : 2235 – 2253 . Retrieved from http://dx.doi.org/10.1068/a34162
- Watkins , C. 2008 . Microeconomic perspectives on the structure and operation of local housing markets . Housing Studies , 23 ( 2 ) : 163 – 177 . Retrieved from http://dx.doi.org/10.1080/02673030801893131
- Yates , J. 2002 . Housing implications of social, spatial and structural change . Housing Studies , 17 ( 4 ) : 581 – 618 . Retrieved from http://dx.doi.org/10.1080/02673030220144367