Abstract
Local area datasets are becoming more frequently used by planners and policy-makers in analyzing land use and development trends. Records kept by cities and towns are popular for this purpose because they often provide continuous and detailed data.
This investigation utilized municipal records to explore how local area datasets and spatial analysis tools, specifically building permits and GIS, may be used to study land development. In order to assess the effectiveness of this analytical method, programs and changes related to development were evaluated to demonstrate potential uses of this municipal data.
The City of Austin, Texas, was the context for this study, and the permit records used spanned two decades from 1990 to 2009. The permit dataset was first used to review overall construction activity within the City. The locations of all permits issued in the study period were mapped. The next part of this research consisted of two case studies used to demonstrate how a spatial assessment of growth and development change issues could be done using building permit records in varying scenarios. The Balcones Canyonlands Preserves (BCP) conservation project was assessed as an example of proactive and explicit land use decisions. Conversely, shifting neighborhood demographics and reinvestment provided a scenario for studying the changes that have resulted from residential mobility decisions.
Keywords:
1. Introduction
In recent decades, planners and policy-makers have recognized the usefulness of local area datasets in assessing community needs and planning for their futures. In fact, local data have become more popular and more necessary for analysis as power and government programs have become increasingly decentralized in the United States, shifting the responsibility of social and economic welfare from the Federal to State and local levels (CitationMarker, 2001; CitationSawicki & Flynn, 1996; CitationSmith, 2003). The need for low-level land development data is particularly important as the vast majority of land use decisions are made at the local level (CitationAllen, Lu, & Potts, 1996; CitationFarmer, 2005). The US Census has, for several decades, tracked building permit estimates by city, state, county, and metropolitan area as a means to understand new housing construction and growth. However, communities and policy-makers often need to understand residential changes at a much more local level, and analysis of actual building permit records is a novel approach to helping them accomplish this task.
This project uses municipal building permit records geocoded to the street address as a tool to enhance understanding of neighborhood characteristics and change over time. Building permits provide a continuous record of development trends, tracking new construction, renovations, additions and demolitions. The permit data can be used to create pictures of neighborhood features on a level that the Census and other less flexible and less detailed datasets do not allow.
The context for this research is the City of Austin, Texas, from 1990 to 2009. The City has experienced rapid growth over the past few decades, and was specifically identified as having the third fastest growing population of large US cities from 2002 to 2006 (CitationChristie, 2007). Concomitant with this growth, the City undertook a conservation effort aimed at directing development, resulting in the Balcones Canyonlands Preserves (BCP) (CitationThe Nature Conservancy, 2010). Additionally, related to the city's development trends, large demographic shifts and a significant amount of residential reinvestment were seen in some urban core neighborhoods. The conservation project and concentrated occurrence of neighborhood reinvestment proved to be appropriate case studies to demonstrate the use of building permit records to explore development and residential neighborhood change in Austin, as is illustrated in the Main Map.
The location of Austin within the state of Texas and the larger United States is shown in . Also depicted in this figure is the City's urban core area as identified in this study.
Figure 1. Location maps for study areas.

2. Methods
The aim of this research was to demonstrate the use of building permits for land use analysis, but further, to illustrate some of the varied analytical uses and results that could be produced from the different attributes and categories contained within the dataset. Based on this goal, three analyses were performed. The initial assessment consisted of creating visualizations of all building permit records, including commercial and industrial permits, as well as those classified as new construction, additions, rehabilitations and demolitions. Next, a subset of the data containing only new residential permits near conservation lands was mapped. Additional factors, including number of housing units and size of the structures permitted, were also evaluated. Finally, a subset of residential renovation permits was mapped in relation to a study of reinvestment in Austin.
For most of the research presented, raster analysis techniques were utilized as these best fit the data and the objectives. The permit records comprised a vector dataset. When mapped, the records appeared as individual points, each point storing the characteristic data associated with each permit. A raster approach is a useful type of analysis for this data because a continuous surface can be created, indicating change and differences across a large area.
Analysis
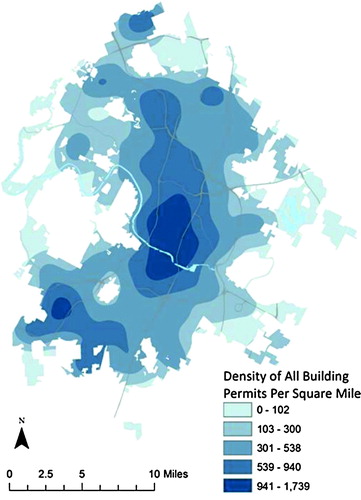
A map of all building permits issued in Austin, Texas from 1990 to 2009 is shown in . From this illustration, one can see where construction activity was occurring in the city. High levels of activity were permitted in the urban core as well as a few targeted areas on the edges of town. In general though, it is evident that the number of building permits issued decreased with distance from the downtown core.
Figure 2. Density of all Austin building permits 1990–2009.
2.1. Balcones conservation project
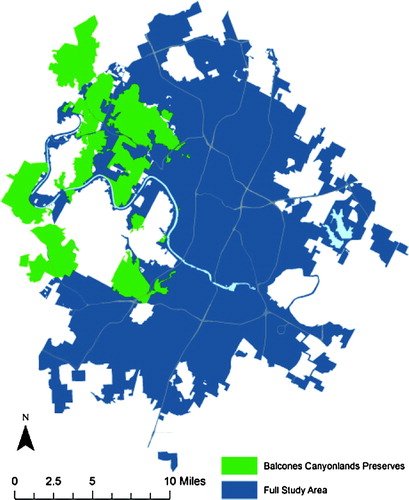
The conservation areas of the Balcones Cayonlands are located in the northwest of Austin, as illustrated in . For this case study, a subset of the permit dataset composed of new residential building permits was used and two types of analysis were performed to show the relationship of housing development to conservation lands. Raster density surfaces were used to create a series of maps depicting the permit data in Austin. Following that, buffer and spatial join tools were used to obtain more information about residential permits issued in close proximity to the preserve areas.
Figure 3. Austin study area and Balcones Canyonlands Preserves.
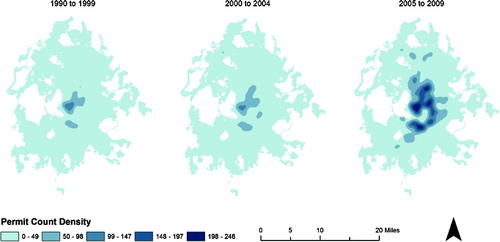
is a series of maps demonstrating the shifts in the number of new residential building permits issued from 1990 to 2007. In reviewing overall patterns in Austin, one can see that the density of permits in the northwest portion of the city diminishes somewhat over time, while a higher concentration of residential permits is apparent on the eastern side of the city in more recent years, particularly in the urban core area. Less change is evident in the southwestern portion of Austin where a high density of permits was issued throughout the study timeframe.
Figure 4. Residential building permit density per square mile from 1990 to 2007.
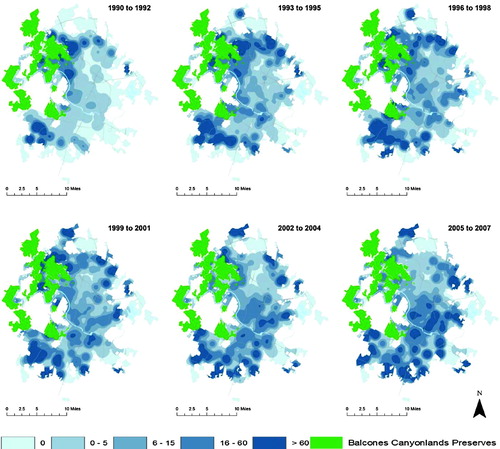
Specifically focusing on the neighborhoods in close proximity to the BCP, one can see that the density of development around the conservation lands was less in the most recent period analyzed from 2005 to 2007 than in the time periods prior to the beginning of the preservation initiative in 1996 (CitationThe Nature Conservancy, 2010, Travis County 2010). However, shortly after the start of the project, the concentration of residential development near some of the BCP lands stayed steady or increased, as illustrated in the 1999–2001 time period.
There are multiple factors that could cause the trends shown. One possible explanation for the picture described in the 1999–2001 period that relates directly to the preservation effort is that it was an attractive area to build homes because the nearby preserves increased property values or provided assurance against overdevelopment in the area. Other factors that may affect development in the area include the availability and value of land. For instance, the number of permits issued near the BCP lands in later years may be a result of few vacant lots or a lack of affordable land in the area. Incentives for developers to construct residences in other areas of the City may be yet another factor in the drop in permits seen over time near the BCP. This analysis of building permit data is not intended to specify why patterns have shifted, but rather is meant to provide a unique spatial perspective of time-elapsed trends from which to develop questions and inform public policy that may more accurately address area characteristics and direct municipal development goals.
To create a more detailed picture of the development trends in close proximity to the Balcones conservation lands, another analysis was performed in which a buffer was created around the conservation lands at a distance of one-half mile from the edges of the BCP polygons. The permit data were then aggregated to the buffer to obtain summary statistics of development within the designated one-half mile distance. The graphs in Figures – summarize the number of permits issued, the total count of housing units (as single permits are issued for multi-unit structures) and total square footage recorded of new construction within close proximity of the conservation property boundaries over time. Using a buffer analysis such as this enables one to utilize data attributes of building permit records to create a more complete picture of the types of homes permitted near the BCP and see the behavioral trends related to this development.
Figure 5. New residential permits issued near the BCP.
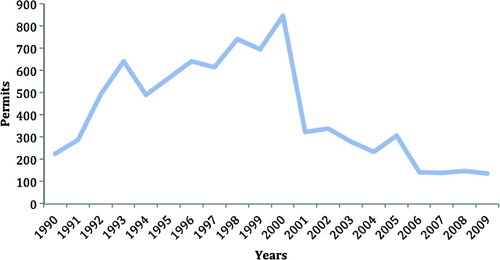
Figure 6. Housing units permitted near the BCP.
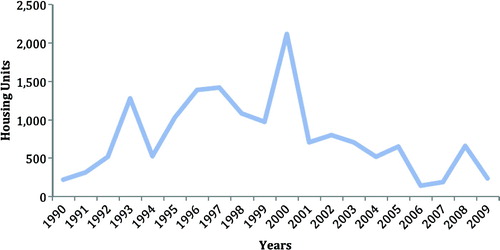
Figure 7. Square feet of residential development permitted near the BCP.
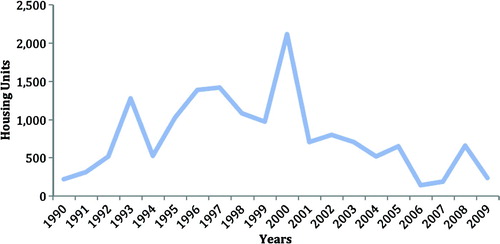
This analysis shows an overall trend of increasing numbers of permits issued within a half-mile of the BCP lands from 1990 to 2000. A sharp drop in permits is seen from 2000 to 2001, followed by a general downward trend. This indicates that development has generally slowed near the BCP in the last decade, from 2000 to 2009.
If controlled for land availability and other factors not directly resulting from the conservation efforts, a similar analysis could be performed where multiple rings of buffers are created around the conservation lands at various distances to provide a comparative picture of permitted development over time in the targeted region. In addition to illustrating the development trends in the neighborhood, combining this type of analysis with data on land availability and value may even allow planners and policy-makers to theorize whether establishing the preserve affected development patterns beyond preventing individuals from constructing within the actual preserve areas.
2.2. Reinvestment
The second case study focused on residential reinvestment in Austin. For this portion of the research, those permits classified as renovations were utilized, since reinvestment is more frequently associated with housing upgrades than new construction. This analysis was broken down into three time periods: 1995–1999, 2000–2004 and 2005–2009. In the initial phase of analysis, raster density surfaces were created based on the permit counts. The results of this are illustrated in . This step made clear that a majority of the renovation work in Austin was occurring toward the center of the city, to the west and southwest of downtown. Therefore, this central urban core area became the focus for the rest of the spatial analysis.
Figure 8. Densities of renovation permits in Austin over time.
The first row of maps in contains simple point maps identifying the locations of renovation permits in Austin's urban core for the specified time periods. The dark blue dots are address-located points, providing a highly accurate picture of where renovation work was permitted. A more focused view of the density surface maps from is shown in the second row of maps in . These maps provide a more informative visual than the point maps by illustrating and quantifying the density of renovation permits in downtown Austin.
Figure 9. Renovation permit analysis in Austin's urban core area.
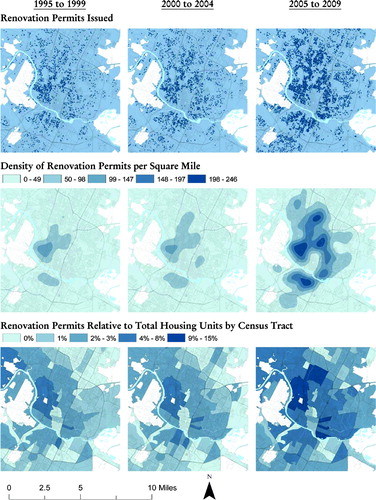
In reviewing the visualizations in overall, concentrations of renovation permits were evident in East Austin where there have been widely noted demographic shifts over the past few decades, and northwest of downtown, where there are city-designated development areas. This supports the hypothesis that this permit data may be used as an indicator of reinvestment trends and neighborhood change patterns.
In the bottom row of maps in , the dataset of renovation records was aggregated to census tracts for each of the three time periods analyzed providing another spatial rendition of the information to analyze trends. This aggregation to census tracts also provides the ability to more easily compare permit records to census data. Being able to integrate this detailed permit data with the myriad data contained in the US Census on demographics, social and economic factors may prove valuable for future analysis.
3. Conclusions
The goal of this research was to spatially explore a low-level data source, specifically building permits, that is not frequently used in visualizing land use trends. The use of building permit records and GIS to investigate and present data related to land development was examined through case studies of change in Austin, Texas over a period of two decades from 1990 to 2009.
This study has shown that there are benefits to using building permit records in planning research. Building permit records comprise a unique dataset that allows for land development analysis at a fine level of spatial detail, down to a specific street address point, providing researchers with the ability to view patterns at various geographic levels and user-defined areas. Additionally, because building permit records comprise continuous datasets, they enable a novel approach where data and patterns can be tracked or viewed by year, quarter, month or even day of permit issuance. The fine level of geographic and temporal detail that building permit records contain enables the use of raster analysis techniques in GIS which allow for more accurate observations of geographic trends and time-lapsed patterns than more commonly used Census datasets. Finally, building permit records provide a variety of attributes to review, contributing to the data cache related to land development. With these records, a wide range of policies and issues can be analyzed by using subsets of the data or by focusing on different permit characteristics.
4. Software
ESRI's ArcGIS ArcMap was the primary software tool used in this research. Additionally, Microsoft Office Excel and Access programs were used to organize and sort data.
Main Map: Tracking Neighborhood Development & Behavioral Trends with Building Permits in Austin, Texas
Download PDF (2.2 MB)Acknowledgements
Thanks go to Professor Barbara Parmenter for her encouragement, support and assistance throughout the research process.
References
- Allen, J., Lu, K., & Potts, T. (1996). A GIS-based analysis and prediction of land-use change in a coastal tourism destination area. Retrieved from http://nsgl.gso.uri.edu/washu/washuw99003/29-Allen_et_al.pdf
- Christie, L. (2007). The fastest growing U.S. cities - From the Empire State to the Lone Star State - the cities that are growing the most. CNNMoney.com. Retrieved from http://money.cnn.com/2007/06/27/real_estate/fastest_growing_cities/
- Farmer, P. (2005). Life in the big city: What is census data telling us about urban America? Are policymakers really listening?. Retrieved from http://www.esri.com/industries/planning/docs/paul_farmer_census.pdf
- Marker , D. 2001 . Producing small area estimates from national surveys: Methods for minimizing use of indirect estimators . Survey Methodology , 27 ( 2 ) : 183 – 188 . Retrieved from http://www.statcan.gc.ca/ads-annonces/12-001-x/4225278-eng.pdf
- Sawicki , D. and Flynn , P. 1996 . Neighborhood indicators: A review of the literature and an assessment of conceptual and methodological issues . Journal of the American Planning Association , 62 ( 2 ) : 165 – 183 . doi: 10.1080/01944369608975683
- Smith , S. 2003 . “ Small-area analysis ” . In Encyclopedia of population , Edited by: Demeny , Paul and McNicoll , Geoffrey . 898 – 901 . Farmington Hills , MI : Macmillan Reference . Retrieved from http://www.bebr.ufl.edu/files/Pop_Encycl_Small_Areas_0.pdf
- The Nature Conservancy. (2010). Conservancy and Austin to Expand Barton Creek Wilderness Park: Purchase of key inholding will protect wilderness slated for commercial development. The Nature Conservancy. Retrieved from http://prod.nature.org/ourinitiatives/regions/northamerica/unitedstates/texas/newsroom/conservancy-and-austin-expand-parklands.xml