
Abstract
In this study an Artificial Neural Network called Self-Organizing Map (SOM) is used in order to classify the synoptic circulation over Europe and especially Eastern Mediterranean. The classification of circulation types is an effective way of summarizing and describing the atmospheric circulation and it is useful in climatology because it provides a better understanding of the climatic variability over an area. Here, the SOM methodology is applied on winter daily geopotential height anomalies of the 500 hPa level, for the period 1971–2000. Twelve unique circulation patterns are identified. Eight of these types are characterized as cyclonic, representing 61% of the total days examined and four types are characterized as anticyclonic, representing 39% of the study period. The results of this classification are comparable to other objective classifications applied on the same study region and present a similar image. Therefore, the SOM methodology is found to be applicable and useful in the classification of circulation types.
1. Introduction
The study aims to present a new approach to the identification of circulation-type weather classification. A weather classification is useful tool in climatology since it provides a better understanding of the climatic variability over a certain area. Both manual and automatic techniques have been used. In manual procedures the classification is performed exclusively by one researcher, depending only on their judgment. The main disadvantages of those methods are that they are not easily replicated and that they require a lot of time, but at the same time, they allow physical interpretation of the climate variability, since the researcher has gained familiarity with the synoptic patterns of the weather maps. Nevertheless, manual methods are still used in contemporary research and circulation-type identification (Hess & Brezowsky, Citation1969; Kassomenos, Flocas, Lykoudis, & Petrakis, Citation1998; Lamb, Citation1972; Maheras, Citation1988, Citation1989). In objective techniques, computer programs determine the circulation types, divide data into categories, and lack the negative aspects associated with subjective approaches (Anagnostopoulou, Tolika, & Maheras, Citation2009; Maheras, Patrikas, Karakostas, & Anagnostopoulou, Citation2000). Automatic classifications are generally based on statistical techniques such as Principal Component Analysis and Cluster Analysis (Luterbacher, Xoplaki, & Maheras, Citation1998; Maheras, Citation1988), and more recently on fuzzy logic techniques and neural networks (Bárdossy, Duckstein, & Bogàrdi, Citation1995; Michaelides, Liassidou, & Schizas, Citation2007). Automatic methods are easily applicable but they also have limitations and restrictions related to the data used and to the physical interpretation of the results.
In this study an Artificial Neural Network, called Self-Organizing Map (SOM), is used in order to classify the synoptic circulation over Europe and especially the Eastern Mediterranean during winter portion of the year. This method is gaining popularity recently since it has many advantages, such as the improved visualization of results, the fact that it also contains a neighbor modification pattern and that it effectively represents a continuum of synoptic situations, compared with discrete ones produced by most traditional methods (Hewitson & Crane, Citation2002).
2. Methods
The SOM methodology is an unsupervised learning process that codifies large, multivariate datasets onto a 2-dimensional array, or map, called the SOM, with the aim of discovering patterns in the data (Kohonen, Citation2001). The initial step in the SOM routine is to define a random distribution of nodes within the data space. The nodes are defined by a reference vector of weighting coefficients, where each coefficient is associated with a particular input variable. Thus, each node has an associated reference vector equal in dimension to the input data. As each data record is presented to the SOM, the similarity between the data record and each of the node reference vectors is calculated, usually as a measure of Euclidean distance. The reference vector of the Best Matching Unit (BMU) is then modified such as to reduce the difference with the input vector by some user-defined factor, or learning rate (Hewitson & Crane, Citation2002). In the final product, the nodes have become ordered, meaning that nodes that are close together in the map represent similar patterns due to the process of each input data sample training the BMU and those surrounding it.
There are many decisions that have to be made by the researcher, such as the SOM grid size and the topology (rectangular or hexagonal). In this study the selection of those parameters was based on both subjective and objective criteria. A rather objective criterion is the computation and evaluation of two types of errors, namely the quantization and topological error. The first one measures the average distance between each data vector and its BMU (the SOM in which it is classified), evaluating the fitting of the neural map to the original data. Therefore, a small quantization error accounts for a good clustering. Regarding the topology preservation, it is more difficult to be evaluated and it is usually done by measuring the topographical error, which is the proportion of all data vectors for which first and second best-matching units are not adjacent vectors. So the lower the topographic error, the better the SOM preserves the topology (Uriarte & Martín, Citation2005).
In the present study, the aim of which is to try a new classification method and compare it to existing ones, the 3 × 4 size was chosen, in order for it to be readily comparable to the 12 circulation types defined by Anagnostopoulou et al. (Citation2009) for the same study region. The topology of the SOM was set to rectangular, since this is the most frequently used one in literature (Liu, Weisberg, & Mooers, Citation2006). Finally, randomly generated weights were created in the initialization process and many runs were performed in order for the one with the minimum errors to be chosen.
In this paper, the winter geopotential height anomalies were used for the 500 hPa isobaric level. The 500 hPa level was chosen because it presents a strong relationship with surface variables (Tolika, Maheras, Vafiadis, Flocas, & Arseni-Papadimitriou, Citation2007) and at the same time, it strongly affects the weather over an area. Furthermore, anomalies were chosen over absolute geopotential values in order to eliminate the seasonality of the data and to get a clearer image of the atmospheric circulation over the study area (Anagnostopoulou et al., Citation2009). Therefore, the positive centers correspond to higher geopotential heights compared to the seasonal mean values and the negative centers correspond to lower geopotential heights. The 500 hPa is commonly used in the classification of circulation types (Anagnostopoulou et al., Citation2009; Huth, Citation1996; Kostopoulou, Citation2003; Kyselý & Huth, Citation2006; Maheras et al., Citation2000; Michaelides et al., Citation2007; Wallace & Gutzler, Citation1981), although it would be possible for other isobaric levels to be used, as well as different thickness levels, depending on the aims of the study.
3. Data
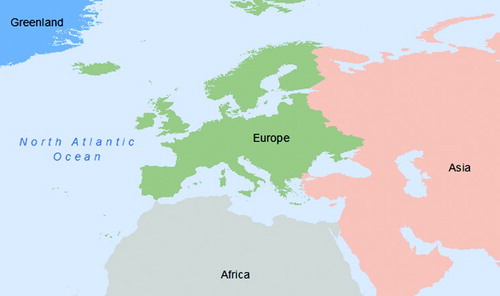
The SOM methodology is applied on winter daily anomalies of geopotential height at the 500 hPa isobaric level of the atmosphere, provided by the National Center for Environmental Prediction/National Center for Atmospheric Research (NCEP/NCAR) Reanalysis project on a uniform 2.5° × 2.5° grid spacing for the broader Europe area (Kalnay et al., Citation1996). The exact study area is 40° W to 70° E and 15°N to 80°N (). The time period examined is 1971–2000.
Figure 1. Reference map of the study area.
4. Discussion and conclusions
The SOMs that are presented on the Main Map products show the 12 circulation patterns that dominate during winter over Europe for the period 1971–2000. Each of the SOMs represents a unique pattern based on the 500 hPa geopotential height anomalies. A description of each of the 12 circulation patterns provided by the SOM methodology can be found in . The patterns could be divided in two groups characterizing cyclonic and anticyclonic circulation over the study region of Eastern Mediterranean. In more detail, in the 12 different SOM nodes, the one with the highest frequency is an anticyclonic node (SOM node 2), accounting for the 14% of the total number of days examined. The cyclonic SOMs have almost the same frequencies, ranging from 5% (SOM node 5) to 9% (SOM node 3). The total percentage of cyclonic patterns is higher than the anticyclonic ones during winter. In particular, 61% of the days examined belong to the eight cyclonic SOM patterns obtained here (SOM nodes 1, 3, 5, 7, 8, 10, 11 and 12), while 39% of the days is classified to the four anticyclonic SOMs (SOM nodes 2, 4, 6 and 9).
Table 1. Description of SOM nodes' patterns (letters C and A in parenthesis correspond to cyclonic and anticyclonic patterns, respectively).
The results of this study are coherent with other studies using different classification methods for Eastern Mediterranean. Maheras and Anagnostopolou (Citation2003), applied an automated circulation classification scheme on Greece for the period October to March for the 500 hPa geopotential height anomalies. The percentages of cyclonic (60.8%) and anticyclonic types (39.2%) found are almost identical to the ones presented in this study. Furthermore, Anagnostopoulou et al. (Citation2009) used a flexible automated approach which is well established in any region of the Mediterranean, resulting into very similar frequencies of winter cyclonic and anticyclonic types compared to the ones found in the present study. The average anticyclonic percentage for two different regions of the Eastern Mediterranean, Greece and Cyprus, is 31.6% (29.8% and 33.5%, respectively). The corresponding cyclonic percentage is 68.4%. According to the results of this study, in Eastern Mediterranean winter days of the 1971–2000 period can be classified to 12 unique circulation patterns. Each pattern is characterized by homogeneous weather conditions, while the differences among the patterns are considered to be relatively marked.
Finally, the SOM approach could be a promising method in Environmental Sciences, providing a descriptive tool for summarizing atmospheric circulation, extremes and risk assessment. The SOM could serve as the link between large-scale atmospheric circulation and environmental risk management, using extreme climatic values. In particular, the output maps of this study could be further associated to climatic parameters such as temperature, precipitation, humidity, cloudiness, and used in environmental risk assessment, predicting the occurrence of extreme weather events, such as heavy rainfall that could result in floods, absence of rainfall causing drought, high temperatures and humidity resulting in heat waves, etc.
Software
For the application of the SOM methodology on the data the R software and the Kohonen package were used (Wehrens & Buydens, Citation2007). All the mapping was performed in ESRI ArcGIS 10. Finally, the graph presented was created in MS Excel.
Main Map: Classification of Circulation Types over Eastern Mediterranean using a Self Organizing Map Approach
Download PDF (3.7 MB)Related Research Data
References
- Anagnostopoulou, C., Tolika, K., & Maheras, P. (2009). Classification of circulation types: A new flexible automated approach applicable to NCEP and GCM datasets. Theoretical and Applied Climatology, 96, 3–15. doi: 10.1007/s00704-008-0032-6
- Bárdossy, A., Duckstein, L., & Bogàrdi, I. (1995). Fuzzy rule based classification of atmospheric circulation patterns. International Journal of Climatology, 15, 1087–1097. doi: 10.1002/joc.3370151003
- Hess, P., & Brezowsky, H. (1969). Katalog der Groβwetterlagen Europas. 2 Neu bearb. U.erg. Aufl. Berichte des Deutschen Wetterdienstes, 113. Selbstverlag des DWD, Offenbach am Main, Germany.
- Hewitson, B. C., & Crane, R. G. (2002). Self-organizing maps: Application to synoptic climatology. Climate Research, 22, 13–26. doi: 10.3354/cr022013
- Huth, R. (1996). Properties of the circulation classification scheme based on the rotated principal component analysis. Meteorology and Atmospheric Physics, 59, 217–233. doi: 10.1007/BF01030145
- Kalnay, E., Kanamitsu, M., Kistler, R., Collins, W., Deaven, D., Gandin, L., …Joseph, D. (1996). The NCEP/NCAR 40-year reanalysis project. Bulletin of the American Meteorology Society, 77, 437–470. doi: 10.1175/1520-0477(1996)077<0437:TNYRP>2.0.CO;2
- Kassomenos, P., Flocas, H., Lykoudis, S., & Petrakis, M. (1998). Analysis of mesoscale patterns in relation to synoptic conditions over an urban Mediterranean basin. Theoretical and Applied Climatology, 59, 215–229. doi: 10.1007/s007040050025
- Kohonen, T. (2001). Self-organizing maps. 3rd ed. Berlin: Springer.
- Kostopoulou, E. (2003). The relationships between atmospheric circulation patterns and surface climatic elements in the eastern Mediterranean, Ph.D. thesis, University of East Anglia, Norwich.
- Kyselý, J., & Huth, R. (2006). Changes in atmospheric circulation over Europe detected by objective and subjective methods. Theoretical and Applied Climatology, 85, 19–36. doi: 10.1007/s00704-005-0164-x
- Lamb, H. H. (1972). British Isles weather types and a register of the daily sequence of circulation patterns, 1861, 1971. Meteorological Office, Geophysical Memoirs no. 116.
- Liu, Y., Weisberg, R. H., & Mooers, C. N. (2006). Performance evaluation of the self-organizing map for feature extraction. Journal of Geophysical Research, 111(C5), C05018. doi: 10.1029/2005JC003117
- Luterbacher, J., Xoplaki, E., & Maheras, P. (1998). Large-scale atmospheric circulation patterns connected with winter rainfall over Greece. 3rd National Conference Meteorology- Climatology-Physics of the Atmosphere, Athens, September 1998, 85–92.
- Maheras, P. (1988). The synoptic weather types and objective delimitation on the winter period in Greece. Weather, 43, 40–45. doi: 10.1002/j.1477-8696.1988.tb03871.x
- Maheras, P. (1989). Delimitation of the summer-dry period in Greece according to the frequency of weather-types. Theoretical and Applied Climatology, 39, 171–176. doi: 10.1007/BF00868312
- Maheras, P., & Anagnostopolou, C. (2003). Circulation types and their influence on the interannual variability and precipitation changes in Greece. In H. J. Bolle (Ed.), Mediterranean climate (p. 215). Springer.
- Maheras, P., Patrikas, I., Karakostas, T., & Anagnostopoulou, C. (2000). Automatic classification of circulation types in Greece: Methodology description, frequency, variability and trend analysis. Theoretical and Applied Climatology, 67, 205–223. doi: 10.1007/s007040070010
- Michaelides, S. C., Liassidou, F., & Schizas, C. N. (2007). Synoptic classification and establishment of analogues with artificial neural networks. Pure and Applied Geophysics, 164, 1347–1364. doi: 10.1007/s00024-007-0222-7
- Tolika, K., Maheras, P., Vafiadis, M., Flocas, H. A., & Arseni-Papadimitriou, A. (2007). Simulation of seasonal precipitation and raindays over Greece: A statistical downscaling technique based on artificial neural networks (ANNs). International Journal of Climatology, 27, 861–881. doi: 10.1002/joc.1442
- Uriarte, E. A., & Martín, F. D. (2005). Topology preservation in SOM. International Journal of Applied Mathematics and Computer Sciences, 1, 19–22.
- Wallace, J. M., & Gutzler, D. S. (1981). Teleconnections in the geopotential height field during the Northern Hemisphere winter. Monthly Weather Review, 109, 784–812. doi: 10.1175/1520-0493(1981)109<0784:TITGHF>2.0.CO;2
- Wehrens, R., & Buydens, L. M. C. (2007). Self- and super-organizing maps in R: The kohonen package. Journal of Statistical Software, 21(5), 1–19.