
Abstract
A 1:12,000 geomorphological map of Fuentes Carrionas (Northern Spain) is presented. Geomorphological landscapes maps are also shown to support map interpretation and show the area's geomorphological diversity. The maps were developed using the IGUL (Institut de Géographie, Université de Lausanne) geomorphological mapping legend. This has been adapted to GIS scheme in order to use the map as a basis for further work. The IGUL legend has been demonstrated to be highly effective for mountain environments where the main morphogenetical agents are dynamic and climatic processes.
1. Introduction
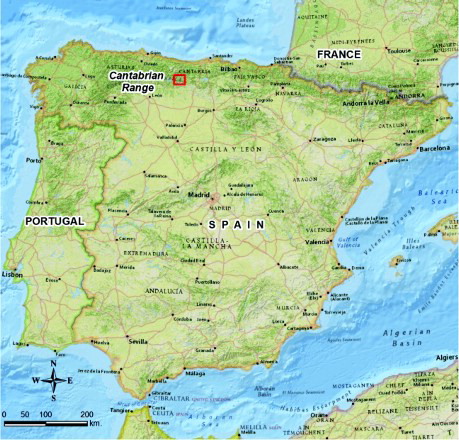
This article depicts the geomorphology of the Fuentes Carrionas Massif. This is a part of Cantabrian Range, on the North of the Iberian Peninsula (). The study area is situated at the border of the León, Palencia and Cantabria provinces (the central peak of the massif is Mojón Tres Provincias, which means Three Provinces Landmark). It is also a hydrological border, because most northern slopes drain to the Cantabrian Sea, and southern ones drain to the Duero basin and therefore to the Atlantic Ocean. Altitudes range between 1200 m.a.s.l. and 2536 m.a.s.l. The total study area is 175 sq. km.
Figure 1. Situation of Fuentes Carrionas within the Iberian Peninsula. Source: National Geographic World Map.
Due to the high altitude, human occupation has traditionally been scarce. Moreover, the mountain climate has made cultivation extremely difficult. The high altitude makes it possible to keep fresh pasture during summer, so the traditional use of this land has been sheep and goat grazing, which has changed to cow grazing during the twentieth century. Since the 1950s and 1960s rural abandonment has deeply affected this region. Pressure on the landscape and natural resources has dramatically decreased and many pastures have been abandoned.
Most of the area is covered by pastures or scrubland, which results from pasture abandonment. The highest areas remain almost free of vegetation due to climate. As a result landforms are the main visual feature of the landscape. The ‘geomorphological map’ has been developed in order to improve understanding of the terrain; several ‘geomorphological landscapes’ cards have been created. These landscapes represent the main agents that have modelled the Fuentes Carrionas' relief and landscape during the Late Pleistocene and Holocene.
2. Methodology
The map was created after a four-year fieldwork programme, with the aid of 1:5000 stereo aerial photographies (anaglyph), provided by ITACYL (Castilla y León Agrarian Research Institute; http://orto.wms.itacyl.es/Server/SgdWms.dll/WMS?) to aid interpretive mapping.
According to CitationVerstappen (1970), a geomorphological legend system should:
– be flexible, so the author can add new symbols more adapted to the area which is being described.
– be as simple as possible, in order to improve legibility and interpretation
– be useful at different scales.
– facilitate applied map creation from a basic geomorphological map.
– use the colour scheme to indicate morphogenetic units rather than lithology or chronology, as colour is the first level of perception in a map.
Following these principles, ideally the Fuentes Carrionas geomorphological map should be legible, semiologicly correct, aesthetically attractive and useful to obtain secondary information using a geographic information system (GIS). Given an alpine environment where climatic and dynamic aspects are more important for relief creation than lithology, the IGUL (Institute of Geography of Lausanne University in Switzerland) legend was chosen due to:
– Its simplicity (only a topographic basemap is required).
– its focus on Geomorphology rather than other information.
– Its adaptation for glacial and periglacial environments.
– Its faithful representation of reality, as all features are scale shaped.
– Its distinction between erosion dominant areas (no colour) and sedimentation dominant areas (a colour depending on the process that created the sedimentation).
The IGUL legend was developed during the 1990s by CitationSchoeneich (1993) to create a simple but coherent mapping system at 1:10,000 scale, which could be used directly by students (CitationReynard, Holzmann, Lambiel, & Phillips, 2005). This method has been widely adopted in an academic environment for mountain areas (CitationDorthe, 2007; CitationGolaz, 1995; CitationOndicol, 2009; CitationScapozza, 2008). It is based on Centre National de la Recherche Scientifique (CNRS) legend, from which it takes many symbols; colours are taken from the German legend (CitationMaillard et al., 2011). Distinctions between landforms (points, lines or polygons with no background) and deposits (degraded colour background) is also taken from the CNRS legend. The colour scheme is shown in .
Table 1. Colours for morphogenesis in the IGUL legend.
The glacial and periglacial colours (purple and pink) were interchanged in order to create two different shades for periglacial landforms: a pale purple for relict periglacial landforms and an intense purple for active periglacial landforms (e.g., CitationOndicol, 2009). Several new symbols were also created in order to represent landform geodiversity, such as that related to periglacial quartzitic surfaces.
The chart's main shortcoming is that it sacrifices lithological and geological information, which have to be presented in separate maps. This is the opposite to the CitationMartin-Serrano et al. (2005) methodology, which has been used in Spain (CitationBenito-Calvo, Tarriño, Lobo, Junguitu, & Larreina, 2010), and which gives a semiologic importance to lithology. On the other hand, the map results more applicable than maps created using the CitationPeña, Pellicer, Chueca, and Julián (1997) legend, one of the most extensively used in Spain (CitationRuiz-Fernández, 2011), where landforms are always represented as lines. In our case landforms and deposits are dominantly shown as polygons, so they have extension, and spatial analysis can be performed after the production of the geomorphological map (e.g., CitationPellitero et al., 2011a).
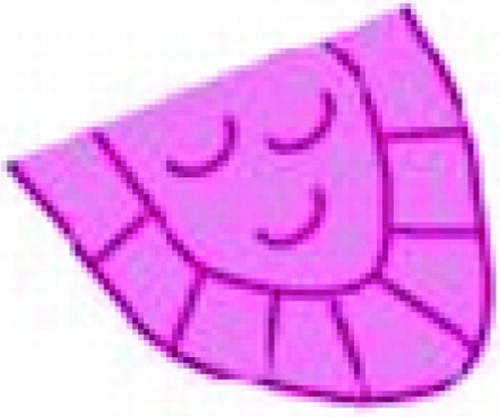
The IGUL mapping legend was designed to be drawn in the field, and has received successive updates that have enriched the symbology with new landforms (CitationGentizon et al., 2001; CitationReynard et al., 2005; CitationSchoeneich, Reynard, & Pierrehumbert, 1998). The last update adapted the legend to be used in drawing software (Adobe Illustrator), however adaptation to a GIS environment has not been addressed so far, and symbols had a complexity that made their use difficult. For example, if we wanted to use the symbol for rock glaciers () in a GIS, three different features should be created: one for the surface, one for the front and another for inner flow marks. In addition spatial analysis potential could not be performed, because the symbology only takes into account rock glacier's toe (surface, roughness, altitudinal gradient, aspect, slope or thickness cannot be calculated).
Figure 2. Rock glacier symbol in IGUL mapping legend.
Due to all these problems an Esri ArcGIS. style file with a 1:10,000 geomorphological mapping legend was developed (http://www.unil.ch/igul/page19238.html).
At this point it is important to stress the advantages and disadvantages of producing a geomorphological map using a GIS or computer-aided design (CAD) package. A GIS has potential for spatial or statistical analysis, which may be required when developing a decision-support map (e.g., Natural Hazards or Environmental Planning) where situation, extension or volume are relevant elements (as for example in CitationTripodo, Casella, Pino, Mandarano, & Rassa, 2012, CitationVilardo & Ventura, 2008). On the other hand mapping legends were mainly designed before GIS availability, and they are not adapted to a GIS environment (CitationMartin-Serrano, Salazar, Nozal, & Suárez, 2004; CitationPeña et al., 1997; CitationSchoeneich, 1993). When adapting previous legends to a GIS some problems come to the fore, mainly with point symbols that change size and direction depending on landform variations (e.g., CitationBenito-Calvo et al. 2010; CitationOliveira & Vieira, 2009).For this reason, maps are often performed with CAD or drawing software. In these cases aesthetic results are better (CitationSahlin & Glasser, 2008) and maps are more faithful to the geomorphological mapping legends (CitationGrecu, 2009), but their potential for integration with other cartographic products (e.g., urban, land use, biodiversity, planning) diminishes because of the lack of feature-related data, typical of GIS.
Many approaches tend to create basic data within a GIS and then produce the final design with CAD or design software (CitationDevoto et al., 2012; CitationSmith et al., 2011). In this case I have tried to perform all processes through a GIS, so I could use spatial analysis techniques for future. In order to avoid managing too many features in ArcGIS, a one-landform-one-feature scheme, which was used previously at CitationOndicol (2009), was abandoned. A geodatabase was constructed where data were distinguished whether they were point, line or polygon features. Several landforms have joint topology. Screes for example, are represented by their shape (polygon) and lines which show slope direction.
The most interesting decision was to use the Representations toolset to produce the map. This decision has improved map performance for three complementary reasons:
– Different landforms can be stored within a single feature, so you can easily draw different landforms during the same edition session without changing the editing target.
– It is not necessary to create a field to identify landforms in the feature data table. While editing you choose which landform you are drawing, and this information is automatically stored in the table.
– the Representations toolset lets you improve the final layout by individually changing orientation, shape or size of each single symbol without changing the representation of all features which represent the same landform type. This is called ‘Free Representation’.
3. Results
Due to its size, 1:10,000 geomorphological map was divided into six parts and the scale was changed to 1:12,000, so that it could fit into six A1 sized pages. Eight ‘geomorphological landscapes maps’ were also created. They are presented at a variable scale, from 1:8000 to 1:25,000, depending on the area shown. Some landforms were removed from the geomorphological landscape maps to enhance relevant landform visibility and lighten the legends.
In total 3164 landforms and features have been mapped, comprising 78 landform types and 8 hydrological features and anthropic constructions. The resulting map has two basic reading levels.
– Simple: colours depict the predominant morphogenetic system.
– Detailed: different patterns depict which landforms exist.
These features have been divided into seven different morphogenetic systems: structural, glacial, periglacial, fluvial, karstic, nival, gravitational and anthropic. Not all of the agents have been equally important in relief modelling since the Pleistocene. Structures were inherited from previous uplift during the Miocene, and they are not the main target of the study, so they have not been drawn in detail.
3.1. Glacial
During the Late Pleistocene an ice mass about 105 sq. km in extent developed in the Fuentes Carrionas. Glacier fronts fell as low as 1240 m.a.s.l. and ice tongues reached a maximum length of 15 km. The highest and central part of the ice mass, the Tres Provincias area (Map 1, E3-E4), was a dome from where ice flowed in three different directions towards the Lechada, Cardaño and Carrión valleys. Glaciers originated in the northern cirques of of Cubil del Can (Map 1, E2) and Peña Prieta (Map 1, E3) joined Lechada and Carrion glaciers through glacial transfluences at Bobias (Map 1, D2) and Vega la Canal (Map 2, C3). The result was an ‘icefield’ that mainly flowed towards the east. Ice thickness reached at least 300 metres in the Vega de Cantos (Map 2, C5 and Geomorphological landscapes 2) area, in the Carriœn valley.
Paradoxically, while northern faced slopes in Tres Provincias, Cuartas, Curavacas and Espigüete were covered by ice hundreds of metres thick, southern and western faced slopes remained unglaciated or scarcely covered by cirque glaciers. The importance of orientation is typical of mountains at the limit of glaciation during glacial stages. Orientation's relevance has even strengthened during the glacial stages after the Local Last Glacial Maximum (hereafter LLGM).
Such an intense glaciation dramatically changed Fuentes Carrionas’ landscape. Erosional glacial landforms, such as cirques, troughs, horns, roches moutonnées and hanging valleys are well developed all over the area. The clearest examples can be found in the upper Carrión, Lechada, Cardaño and Riofrío valleys. Cardaño valley head hosts Las Lomas glacial cirque, where erosional landforms are widely represented (Geomorphological landscapes 1). Pineda valley at Vega de Cantos and Vega la Canal (Geomorphological landscapes 2) joins a wide variability of erosion and sedimentation landforms. Here we can find U-shaped valleys, truncated spurs and glacial troughs, but also lateral and frontal moraines, debris filled tarns and till mantles. This is so because it was the area where ice was deepest during the LLGM, but also housed the ablation area during retreat phases that occurred between the global LGM and Older Dryas (see CitationSerrano, González-Trueba, Pellitero, González, & Gómez-Lende, 2012). On the other hand glacial erosion landforms have been almost completely removed in lower Cardaño, Carrión and Riofrío, because of paraglacial and postglacial gravitational and fluvial processes.
Accumulation landforms are less spectacular than erosion landforms, but much more reliable for palaeoglacier reconstruction. All glacial tongues have left frontal morainic complexes between 1450 and 1290 m.a.s.l., which were deposited during the LLGM and First Retreat Phase. The complex situated in Naranco Valley is the most important, as it has been used to date glaciations thanks to the excellent morainic record (CitationSerrano et al., 2012). There are also groups of frontal moraines deposited between 1600 and 1800 m a.s.l. (see Map 2, B2 and C2 or Map 3, D1), which are remnant of the Second Retreat Phase. Finally there are very well preserved frontal moraines deposited by cirque glaciers, between 1900 and 2200 m.a.s.l. These are the remnants of a Lateglacial Stage (Map 5, D2 or Map 3, C3).
Lateral moraines and erratics are essential for ice thickness reconstruction. However they have been mostly eroded and removed during the paraglacial phase. There are scarce but interesting remnants in Cardaño (Map 3, D4) and Carrión valleys (Map 6, C2), which confirm an ice thickness of several hundred metres within the valleys. Finally kame terraces and debris filled lateral complexes have also been located, which may be used for dating in the future.
The extent of glacial phases', dating and correlation to other glaciated areas in the Iberian Peninsula can be found in CitationSerrano et al. (2012). This correlation suggests a glacial maximum several thousand years before the LGM, and maybe a long period of glacier fluctuation between 35 and 25 ka. BP, as CitationHughes and Woodward (2008) state.
3.2. Periglacial and nival
Periglacial processes were active while glaciers occupied most of the study area, and have kept active until present but gradually at a higher altitude. Several landforms can mark the extension of periglacial environment during the Pleistocene. Stone related (conglomeratic and quartzitic tors, as well as blockslopes, blockstreams and blockfields) are witnesses to a cryonival belt on deglaciated slopes during the LLGM (Geomorphological landscapes 4). During this stage head deposits were created at the foot of schist and limestone walls. Relict rock glaciers (i.e. Map 5, B2 or Map 3, E3) and protalus lobes (i.e. Map 6, C3) are reliable geoindicators of former permafrost occurrence (CitationBarsch, 1996). We have identified 23 rock glaciers and protalus lobes within Fuentes Carrionas, which developed between 1665 and 2476 m.a.s.l. Not all rock glaciers developed during the same period. Based on morphostratigraphic relationships between rock glaciers and glacial features six main rock glacier formation phases are suggested. The first three phases coincide with the three older glacial phases from the LLGM to Second Glacial Retreat. The fifth and sixth phase developed during the Older and Younger Dryas. Finally some protalus lobes may have been formed during the Holocene (CitationPellitero et al. 2011b).
Small landforms, such as terracettes, solifluction lobes, ploughing boulders, and processes like pipcrake are the most active periglacial features nowadays. Terracettes are active over 1900–2000 m.a.s.l., and they developed due to both pipcrake and snowmelt solifluction. Turf-banked solifluction lobes are active over 1900 m.a.s.l. on northern slopes where snow cover is constant in winter, and they are directly related to snow melt and abundant water supply. Stone-banked solifluction lobes are active above 2300 m.a.s.l. on western and northern shaped slopes, and they are the only remnant of an active crionival belt, with no permafrost but a deep, long-lasting freezed soil about 7–9 months per year (Geomorphological landscapes 5). Ploughing boulders, like turf-banked lobes, are related to a mixture of soil moisture and climatic conditions (CitationBallantyne, 2001). Screes and debris cones are the most extensive periglacial landforms within Fuentes Carrionas. Screes are usually active above 1900 m.a.s.l. Active screes (Geomorphological landscapes 5) and debris cones usually have a convex profile and a slope over 30°. Snow avalanche, rockfall and debris flow are the main processes on active screes. Inactive screes and talus are always concave shaped, with their slope below 30°. Solifluction, laminar erosion and sands and clay lixiviation are the main processes within them.
Nival landforms are obviously related to snow distribution during winter and spring, so they are usually found on northern and eastern facing slopes. There are still some permanent snowpatches in Fuentes Carrionas, located at the foot of the highest peaks in northern cirques. At their foot there are active protalus ramparts. There are also permanent snowpatches covering nival dolines at the Espigüete limestone outcrop (Geomorphological landscapes 8). Nivation hollows have developed mainly on eastern facing slopes, where snow blown from peaks and western slopes accumulates. Here we can find some very interesting nival abrasion processes that have even lead to the formation of nival roches moutonnées and nival push-moraines (CitationShakesby, Matthews, McEwen, & Berrisford, 1999) (Geomorphological landscapes 4). Avalanches are common at the highest peaks, and they usually happen along the same avalanche corridors.
3.3. Gravitational
Landsides and rockfall are very well represented in Fuentes Carrionas. Seven mass movement types have been identified following the CitationDikau, Brunsden, Schrott, and Ibsen (1996) classification, although only five different symbols exist on the map. Rotational landslides are the largest gravitational landforms of the area (Geomorphological landscapes 6). They usually occur in deglaciated slopes, and are frequently related to faults, lithological contacts and steep slope facing tilts. Due to their size, they induce instability on slopes and so provoke secondary landslides. Traslational slides (i.e. Map 5, E2) usually affect unstable till mantles and moraines. They can be provoked by previous rotational landslides or by upwelling fluvial erosion. Sackungen also affect deglaciated slopes at areas with a varied lithology. They always provoke slope instability and therefore secondary landslides (i.e. Map 5, D3). Rock avalanches always occur in Fuentes Carrionas on quartzitic slopes which have been destabilized by sackungen (i.e. Map 5, D3). Rockslides are a special type of movement in which the slide body keeps the original shape. They only occur in massive hard lithologies, such as Curavacas conglomerates and Caliza de Montaña limestones (i.e. Map 4, D2). Rockfall or rubble are found at steep cirque walls and glacial troughs, and they are still actively occurring (Geomorphological landscapes 7). Finally debris flows can be found at the highest debris cones and talus of the massif. They are almost always related to summer storms and sudden snow melts (i.e. Map 1, E2).
Six different slope instability phases have been identified, although no direct dating has been performed. Interpretation is based upon landform degradation state and morphostratigraphical relationship to other landforms (fluvial, glacial and periglacial). There is an initial phase previous to the LLGM, three paraglacial phases after the glaciers retreated, a fifth phase where paraglacial instability is extended due to human occupation and deforestation, and the final present phase. This phase is characterized by continuous instability on the slopes eroded by the Riofrío (Geomorphological landscapes 6) drainage system and on the slopes of the Riuplanes area (Map 5, E2). On the peaks there are still rockfall and debris flow formation processes, which directly relate to climatic conditions rather than fluvial dynamics.
3.4. Karst
In spite of the scarce extent of limestone outcrops (only 7% of the study area), a wide variety of karst landforms have developed in Fuentes Carrionas. Exokarst is mainly represented by nival karren fields. At the northern face of Espigüete an extensive karren field has developed on a glacial cirque (Geomorphological landscapes 8). Here we can find rillenkarren, rinnenkarren, wandkarren, meanderkarren, splitkarren and dolomization-related karren, often mixed between them (CitationMiotke, 1968). On the other hand dolines are quite scarce, and only nival dolines can be found in the Espigüete area. A dense endokarst network has developed departing from very frequent sinks (more than 100 in 1 sq. km in the Espigüete area). This network usually follows stone tilting. Galleries use to be vadose until 1400 m.a.s.l., the level where freatic mantle is found, and where we can find many springs at the limits of limestone outcrops. Perched abandoned galleries also exist.
3.5. Fluvial
In spite of the differences between valleys, especially between the Cantabrian Sea and Duero Basin drainage systems, there is a common pattern in fluvial landform creation in Fuentes Carrionas. There is an almost ubiquitous accumulation level perched between 5 and 10 metres above the present fluvial level (i.e. in Pineda valley, Map 5, D1). This level would have been deposited during a phase of low vegetation, and active paraglacial and periglacial processes, which we propose is coetaneous to the Lateglacial stage. The level was later eroded by an organized fluvial network, in a less active environment, that we date to the early Holocene. A second accumulation phase, about 3 metres above the present fluvial level, can be found in the valleys. Slopes were again destabilized, but in this case due to anthopic activity (mainly deforestation for pasture creation) which started about 4500 years ago (CitationPérez-Rodríguez, 2010). Finally, today the Carrion and Cardaño rivers are locally accumulating sediments in the valleys, whereas the Riofrío river is constantly eroding its margins due to the Cantabrian Sea basin differential drainage (Map 2, C2).
3.6. Anthropic
Besides deforestation, human communities that have used the resources of the Fuentes Carrionas' and have directly created landforms. Channels are common at the highest meadows and pastures of the Carrión and Riofrío valley (Map 2, B1). They used to start at springs and take advantage of landforms (as for example lateral moraines) for gently descending and irrigating pastures. Cultivation terraces were built near the villages on southern facing slopes until 1600 m.a.s.l., but these were overwhelmingly abandoned during the 1960s and 1970s (i.e. Map 4, D4). Finally there is a small talc mine in the Lechada valley at 2035 m.a.s.l. (Map 1, D3).
4. Conclusions
The IGUL system is highly suitable for the cartographic representation of mountain areas where landforms are climatic or dynamic related rather than lithology related. For the study area this is the profusion of glacial, periglacial and gravitational landforms. In spite of being developed for 1:10,000 scale, it can be used between 1:5000 and 1:25,000. Adaptation for GIS can be useful for further spatial analysis (CitationTheler et al. 2008). On the other hand it has a major weakness: structure and lithology are scarcely represented because the colour layer is used for mapping different deposits. This shortcoming is offset by the frequent use of symbols that usually consider landforms and deposits as a consequence of some processes applied to a determinate lithology (e.g., blockslopes are formed because of periglacial weathering on quartzitic rocks). In any event, this system is less suitable for small-scale maps (1:50,000 or lower) because these are used to relate landforms to structure and lithology rather than to climatic environments. Adaptation for the Fuentes Carrionas has permitted us to distinguish active and inherited periglacial features, which is useful to determine the contemporary geoecological environment.
Fuentes Carrionas holds a wide variety of glacial, periglacial, gravitational and karstic landforms which are highly relevant in landscape configuration, given a dominant absence of significant vegetal formations. This geodiversity has been shown on ‘Geomorphological landscapes maps’, and should also be taken into account when acting in this environment. Maps presented are therefore essential tool for land management in Fuentes Carrionas.
Software
ArcGIS 10.0 has been used to create the new data, process the data acquired and perform the final layout.
Main Map: Fuentes Carrionas Geomorphological Map
Download PDF (30.3 MB)Acknowledgements
The author would like to thank PANGEA (Natural Heritage and Applied Geography Group) and LACASIG (GIS and Cartography Laboratory) for their help. This research has been supported by OAPN 053-2010 and CGL-2010-19729 projects. Mr Chris Orton, Dr. Matteo Spagnolo and two anonymous reviewers are thanked for suggesting improvements that have made map and paper more expressive.
Related Research Data
References
- Ballantyne, C. K. (2001). Measurement and theory of ploughing boulder movement. Permafrost and Periglacial Processes, 12, 267–288.
- Barsch, D. (1996). Rock-glaciers. Indicators for the present and former geoecology in high mountain environments. Berlin: Springer-Verlag.
- Benito-Calvo, A., Tarriño, A., Lobo, P. J., Junguitu, I., & Larreina, D. (2010). Geomorphology and prehistoric flint mining evidence in the Sierra de Araico (Basque-Cantabrian Basin), Burgos-Álava, Spain. Journal of Maps, 6, 584–590. doi:10.4113/jom.2010.1147
- Devoto, S., Biolchi, S., Bruschi, V. M., Furlani, S., Mantovani, M., Piacentini, D., & Pasuto, A. (2012). Geomorphological map of the NW Coast of the Island of Malta (Mediterranean Sea). Journal of Maps, 8, 33–40. doi:10.1080/17445647.2012.668425
- Dikau, R., Brunsden, D., Schrott, L., & Ibsen, M. (1996). Landslide recognition. Identification, movement and causes. Chichester: Wiley.
- Dorthe, J. (2007). Ventilation des éboulis froids et des glaciers rocheux fossiles des Préalpes suisses romandes. Travail de Diplôme: Institut de Géographie, Université de Fribourg. Retrieved February 5, 2012, from, http://www.unifr.ch/geoscience/geographie/pub/lib/exe/fetch.php?id=pub%3Amaster& cache=cache&media=master:diplome_sm-jd.pdf
- Gentizon, C., Baud, M., Holzmann, C., Lambiel, C., Reynard, E., & Schoeneich, P. (2001). GIS and geomorphological mapping as management tools in alpine periglacial areas. In M. F. Buchroithner (Ed.), High mountain cartography 2000 (pp. 215–228). Dresden: Institute for Cartography of the Dresden University of Technology, Kartographische Bausteine, Band 18.
- Golaz, F. (1995). Le Val de Moiry, Valais. Morphologie glaciaire, périglaciaire et essai de reconstitution paléogéographique des stades glaciaires, volumen 13 de Travaux et Recherches. Institut de Géographie, Université de Lausanne.
- Grecu, F. (2009). Geomorphological Map of the Prahova Subcarpathians (Romania). Journal of Maps, 5, 108–116. doi:10.4113/jom.2009.1052
- Hughes, P. D., & Woodward, J. C. (2008). Timing of glaciation in the Mediterranean mountains during the last cold stage. Journal of Quaternary Science, 23(6–7), 575–588.
- Maillard, B., Lambiel, C., Martin, S., Pellitero, R., Reynard, E., & Schoeneich, P. (2011). The ArcGIS version of the geomorphological mapping legend of the University of Lausanne. Technical report, Université de Lausanne.
- Martín-Serrano, A., Salazar, A., Nozal, F., & Suárez, A. (2005). Mapa geomorfológico de España a escala 1:50.000. Guía para su elaboración. Madrid: Instituto Geológico y Minero de España.
- Miotke, F. D. (1968). Karstmorfologische studien in der glacial übertormten Höhenstute der Picos de Europa. Jahrbuch der Geographischen Gesellschft zu Hannover.
- Oliveira, F. A., & Vieira, C. V. (2009). Semi-detailed geomorphological map of Northeastern Santa Catarina State, Brazil—the Garuva Sheet. Journal of Maps, 5, 66–74. doi:10.4113/jom.2009.1037
- Ondicol, R. P. (2009). Application of an alpine geomorphological mapping system to an atlantic mountain environment: The Curavacas Massif (Cantabrian Range, Northwest Spain). Journal of Maps, 5, 194–205. doi:10.4113/jom.2009.1065
- Pellitero, R., González-Amuchastegui, M. J. Ruiz-Flaño, P., & Serrano, E. (2011a). Geodiversity and geomorphosite assessment applied to a natural protected area: The Ebro and rudron gorges natural park (Spain). Geoheritage, 3(3), 163–174. doi:10.1007/s12371-010-0022-9
- Pellitero, R., Serrano, E., & González, J. J. (2011b). Glaciares rocosos del sector central de la Montaña Cantábrica: indicadores paleoambientales. Cuadernos de Investigación Geográfica, 37(2), 119–144.
- Peña, J., Pellicer, F., Chueca, J., & Julián, A. (1997). Leyenda para mapas geomorfológicos a escalas 1:25.000/1:50.000. In J. Peña (ed.), Cartografía geomorfológica básica y aplicada. (p. separata) Logroño: Geoforma ediciones, Universidad de La Rioja.
- Pérez-Rodríguez, F. (2010). El fenómeno megalítico en la Montaña Palentina. Colección de Historia de la Montaña Palentina. Ediciones Aruz, 4, 11–64.
- Reynard, E., Holzmann, C., Lambiel, C., & Phillips, M. (2005). Légende géomorphologique de l'IGUL et Guide pratique pour le levé de cartes géomorphologiques. Lausanne: Institut de Géographie.
- Ruiz-Fernández, J. (2011). Geomorphological map of an Atlantic mid-height mountain area: The Juan Robre and Jana Ridge (Cantabrian Range, Northwest Spain). Journal of Maps, 7, 260–272. doi:10.4113/jom.2011.1173
- Sahlin, E. A. U., & Glasser, N. F. (2008). A geomorphological map of Cadair Idris, Wales. Journal of Maps, 4, 299–314. doi:10.4113/jom.2008.1011
- Scapozza, C. (2008). Contribution à l'étude géomorphologique et géophysique des environments périglaciaires des Alpes Tessinoises orientales. Master thesis Université de Lausanne, 2008. Retrieved from http://mesoscaphe.unil.ch/igul/doc.php?id=TIGL-691.pdf
- Schoeneich, P. (1993). Comparaison des syst_emes de l_egendes fran_cais, allemand et suisse príncipes de la légende IGUL. In E. Reynard and P. Schoeneich (eds.), Cartographie géomorphologique, cartographie des risques (pp. 15–24). Lausanne: Travaux et Recherches, vol. 9. Université de Lausanne.
- Schoeneich, P., Reynard, E., & Pierrehumbert, G. (1998). Geomorphological mapping in the Swiss Alps and Prealps. In K. Kriz (ed.), Hochgebirgskartographie Silvretta'98 (pp. 145–153). Wiener Schriften zur Geographie und Kartographie, 11.
- Serrano, E., González-Trueba, J. J., Pellitero, R., González, M., & Gómez-Lende, M. (2012). Quaternary glacial evolution in the Central Cantabrian Mountains (Northern Spain). Geomorphology, 196, 65–82. doi:http://dx.doi.org/10.1016/j.geomorph.2012.05.001
- Shakesby, R. A., Matthews, J. A., McEwen, L. J., & Berrisford, M. S. (1999). Snow-push processes in pronival (protalus) rampart formation: Geomorphological evidence from Smorbotn, Romsda lsalpane, Southern Norway. Geografiska Annaler, 81A, 31–45.
- Smith, B., Pellitero, R., & Alexander, G. (2011). Mapping slope instability at the Giant's causeway and causeway coast world heritage site: Implications for site management. Geoheritage, 3, 253–266. doi:10.1007/s12371-010-0021-x
- Theler, D., Reynard, E., & Bardou, E. (2008). Assessing sediment dynamics from geomorphological maps: Bruchi torrential system, Swiss Alps. Journal of Maps, 4, 277–289. doi:10.4113/jom.2008.1013
- Tripodo, A., Casella, S., Pino, P., Mandarano, M., & Rassa, R. (2012). Geomorphological map of the Lipari volcanic island (Aeolian Archipelago – Italy). Journal of Maps, 8, 107–112. doi:10.1080/17445647.2012.668770
- Verstappen, H. T. (1970). “Introduction to the ITC system of geomorphological survey.” Koninlijk Nederlands Aardijkkundig Genootschap. Geografisch Niewe Reeks, 4.1, 85–91.
- Vilardo, G., & Ventura, G. (2008). Geomorphological map of the 1944 Vesuvius lava flow (Italy). Journal of Maps, 4, 225–234. doi:10.4113/jom.2008.1003